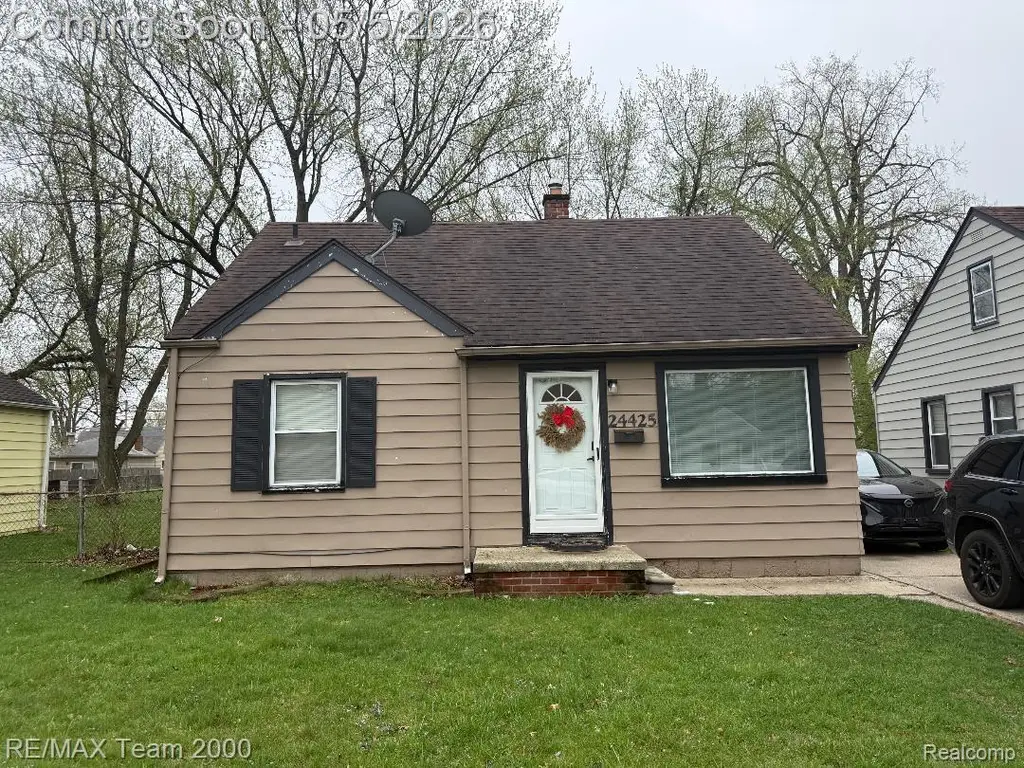
24425 Stanford St · Dearborn Heights, MI
Flood risk 1/10 · Minimal
- FEMA flood zone
- X (unshaded)
- Chance of flooding over 30 yrs
- 0.0%
- Est. flood insurance / yr
- $507 – $1,088
Fire risk 1/10 · Minimal
- Est. fire insurance / yr
- $784 – $1,456
Heat risk 3/10 · Minor
- Hot days now (above 98°F)
- 7 days/yr
- Hot days in 30 yrs
- 15 days/yr
Wind risk 2/10 · Minimal
- Chance of severe wind over 30 yrs
- —
Air-quality risk 2/10 · Minimal
- Unhealthy air days now
- 1 days/yr
- Unhealthy air days in 30 yrs
- 2 days/yr
Risk factors via First Street. Map © Google.
Why this score? — see what drove the D+ grade
The composite is a weighted blend of 9 inputs, each scored 0–100. Each bar is that input's sub-score; the figure is the points it added to the 100-point composite (weight × sub-score).
- Cash flow +22.5/30.0
- DSCR +7.2/10.0
- 1% rule +5.1/10.0
- Livability +4.0/5.0
- ARV discount +3.0/15.0
- Rent growth +3.0/5.0
- Condition / age +2.5/5.0
- Schools +0.7/10.0
- Appreciation +0.0/10.0
$159,900
🖨 Deal sheet 📄 Offer letter ✓ Due diligence
Listing remarks MLS
Welcome home to this super clean and super sharp and nicely updated home. Spacious living room. Updated kitchen with newer stainless steel appliances. Updated full bath. Home is freshly painted. New floors. 2 bedrooms on main level. Upper level can be split in 2 bedrooms. Washer/Dryer included. 1.5 car garage. Fenced yard.
Key facts
- 5,227 sq ft lot
- Garage
- Built 1949
Property features AI
Exterior
- Parking: Detached garage (1.5 car spaces)
- Utilities: Water available; Sewer available
- Home design: Single-family residence; One and one half levels; Ground-level entry
- Construction: Aluminum siding
- Exterior features: Paved road access; Lot approximately 0.12 acres (40 x 134.7)
Interior
- Kitchen: Free-standing electric range; Free-standing refrigerator
- Bedrooms: Total of 6 rooms (includes bedrooms and living spaces)
- Bathrooms: 1 full bathroom
- Heating & cooling: Central air conditioning; Forced air heating; Natural gas heating
- Interior features: Stainless steel appliances; Stacked washer and dryer; Crawl space basement
- Laundry & utility: Stacked washer and dryer
Neighborhood map
What this means for you Summary
Snapshot
- This is a 3-bed/1.0-bath single-family listed at $160k.
Deal economics
- At list price, monthly cash flow is $269 ($3k/yr) — positive.
- The deal already cash-flows at list — no discount required.
- Meets the 1% rule at list price ($2k rent vs $160k).
- Recommended offer: $158k (1.5% below list) — sets the bar for market timing.
- Cap rate 8.3% vs local median 5.5% in Dearborn Heights — top-decile yield for the area; either an underpriced asset or a hidden risk that comps aren't pricing in. Stress-test before assuming the spread holds.
Location & tenants
- Location reads 79/100 on livability (#82 in MI, #1,885 nationally) — a middle-class / working-renter tenant base. Strengths: commute A+, cost of living A+, housing A+; Watch: schools C-, crime D+, employment D+.
- Westwood Community School District (suburban): math 6% / reading 11% proficiency, ranked #529 of 540 in MI (top 98%) — low school quality limits family demand, transient renter base, plan for 1-2y turnover; 81% free/reduced lunch — lower-income household profile, screen leases tightly.
- Market conditions: Rents rising (+2.0%/yr); 137 active listings in the ZIP; 1 comparable units currently listed for rent nearby; 2,639 units permitted in Wayne County in 2024 (1,216 in 5+ unit buildings).
- This rent runs 32% of the median local income ($60k/yr) — at the standard rent-burdened threshold; future hikes will face affordability resistance.
Forward outlook
- Local home prices are declining (-3.0%/yr); year-one equity from $1k of loan paydown is wiped out by about $5k of value loss. Plan a longer hold.
- Wayne County population projected at -17% by 2050 — secular population decline; favor cash flow + early exit over multi-decade hold.
Negotiation context
- It's been on market 30 days — a 2% lower offer ($158k) is reasonable based on typical stale-listing flexibility.
- 8 sale attempts since 29y ago with the ask held roughly flat each time — persistent listings suggest the price (not the market) is what's stuck; bring a comps-based counter.
- Current owner paid $125k; 28% above their basis — modest negotiation headroom, anchor on the comps not their cost.
Risks & watch-outs
- Watch-outs: built in 1949 — expect roof / HVAC / electrical / plumbing capex.
Questions for the listing agent
- Built in 1949 — when were the roof, HVAC, electrical panel, plumbing, and water heater last replaced?
- Is there a deadline driving the sale (1031 exchange, divorce, estate, relocation)? That informs how much negotiation room exists.
- Crime grade is D in this area — have there been break-ins, vandalism, or insurance claims at this property in the last 3 years? What carrier currently insures it and at what premium?
- The area grade is low — what's the realistic commute time and amenity access for the typical tenant pool here? Any planned neighborhood developments (good or bad) we should know about?
- What's the average days-on-market for RENTAL listings here right now (not sales)? A rising rental-DOM trend means longer vacancies and softer asking-rent achievability than the comps imply.
- What's the recent tenant-quality profile in this submarket — average credit score on applications, eviction rate, late-payment / NSF rate, and stable-employment percentage? A property-management company in the area should have these aggregated.
- How much new for-sale + rental construction is in the pipeline within 1–3 miles? Heavy new supply typically softens prices + rents 12–24 months out; constrained supply supports both.
Investment metrics
- 1% rule
- 1.01% ✓
- Cap rate
- 8.31%
- Cash-on-cash
- 7.22%
- DSCR
- 1.32
- GRM
- 8.2
CMA / ARV
- ARV (on-the-fly)
- $145,386
- Comps found
- 12
Show comp detail 12 sales within ~0.75 mi
| Address | Dist | Beds/Ba | Sqft | Sold | Price | $/sf | Match |
|---|---|---|---|---|---|---|---|
| 24425 Lehigh St | 0.06mi | 2/1.0 (-1) | 693 (-6%) | 2mo | $155,000 | $224 | 81 |
| 24754 Annapolis St | 0.25mi | 2/1.0 (-1) | 702 (-5%) | 3mo | $121,000 | $172 | 73 |
| 4474 Syracuse St | 0.47mi | 3/1.0 | 768 (+4%) | 1mo | $165,000 | $215 | 71 |
| 24301 Stanford St | 0.12mi | 2/1.0 (-1) | 824 (+12%) | 2mo | $155,000 | $188 | 69 |
| 4506 Syracuse St | 0.48mi | 3/1.0 | 768 (+4%) | 4mo | $164,200 | $214 | 68 |
| 24337 Ross St | 0.26mi | 2/1.0 (-1) | 780 (+6%) | 7mo | $178,000 | $228 | 68 |
| 25037 Hopkins St | 0.30mi | 2/1.0 (-1) | 812 (+10%) | 2mo | $159,900 | $197 | 62 |
| 4165 Westpoint St | 0.36mi | 3/1.0 | 847 (+15%) | 1mo | $170,000 | $201 | 58 |
| 25038 Annapolis St | 0.31mi | 2/1.0 (-1) | 841 (+14%) | 1mo | $125,000 | $149 | 56 |
| 25007 Hopkins St | 0.27mi | 2/1.0 (-1) | 841 (+14%) | 4mo | $129,000 | $153 | 56 |
| 4901 Cornell St | 0.53mi | 2/1.0 (-1) | 819 (+11%) | 3mo | $92,150 | $113 | 50 |
| 25118 Lehigh St | 0.34mi | 2/1.0 (-1) | 841 (+14%) | 7mo | $145,000 | $172 | 50 |
Match score weights: distance 35% · size 25% · config 20% · recency 20%. Top-matched comps best support the ARV.
Projected returns pro-forma
-3.0% appreciation · 2.03% rent growth · sell at horizon
- IRR
- -6.3%
- Equity multiple
- 0.77×
- Total profit
- $-10,366
- Equity at exit
- $23,842
- IRR
- 2.2%
- Equity multiple
- 1.15×
- Total profit
- $6,608
- Equity at exit
- $13,825
Cash invested: $44,772 (down + closing). Projections, not guarantees.
Landlord ↔ Tenant lean methodology
- Overall (STATE)
- 62 Landlord-Friendly
- State Michigan
- 62 Landlord-Friendly · EVEN
- County
- — inherits STATE
- City
- — inherits STATE
ZIP-level market 48125
- Rents YoY
- 2.0%
- Active inventory
- 137
- Price-to-rent
- 8.2×
Monthly cashflow live
- Estimated rent
- $1,623 medium interval (Pro) →
- Mortgage (P&I)
- −$839
- Tax from tax record
- −$108 /mo · $1,292/yr
- Insurance
- −$67
- HOA
- −$0
- Vacancy / Maint / Mgmt
- −$341
- Net cashflow
- $269
Break-even live
UW: 25.0% down · 7.5% · 30yr · 1.5% tax · 5.0% vac · 8.0% maint · 8.0% mgmt
Financing live
Cash to close
- Down payment
- $39,975
- Closing costs
- $4,797
- Reserves months
- —
- Total cash needed
- —
Loan-product check · same deal, 3 products live
Conventional
25% down · 7.5% · 30yr
- Down + closing
- —
- Monthly P&I
- —
- Monthly cashflow
- —
- DSCR
- —
- Eligible?
- —
Personal DTI + credit; lowest rate.
DSCR
20% down · 8.5% · 30yr
- Down + closing
- —
- Monthly P&I
- —
- Monthly cashflow
- —
- DSCR
- —
- Eligible?
- —
No personal income docs; deal must DSCR.
Hard money
10% down · 12.0% · 12mo
- Down + closing
- —
- Monthly P&I
- —
- Monthly cashflow
- —
- DSCR
- —
- Eligible?
- —
Short-term bridge; refi at stabilization.
Rent comps 1 comps
| Address | Beds | Baths | Sqft | Rent | $/sqft | DOM | Units | Dist |
|---|---|---|---|---|---|---|---|---|
| 5845 Michael St Taylor, MI | 2.0 | 1.0 | 618 | $1,325 | $2.14 | 4d | 1 | 0.85mi |
Listing history 25 events
-
2026-06-04status $159,900 Pending 30 DOM
-
2026-06-03days on market $159,900 Active 30 DOM
-
2026-06-02days on market $159,900 Active 29 DOM
-
2026-06-01days on market $159,900 Active 28 DOM
-
2026-05-31days on market $159,900 Active 27 DOM
-
2026-05-05$159,900 Active 324-char remark
Show marketing remark (324 chars)
Welcome home to this super clean and super sharp and nicely updated home. Spacious living room. Updated kitchen with newer stainless steel appliances. Updated full bath. Home is freshly painted. New floors. 2 bedrooms on main level. Upper level can be split in 2 bedrooms. Washer/Dryer included. 1.5 car garage. Fenced yard.
-
2026-05-05$159,900 Active
Show marketing remark (324 chars)
Welcome home to this super clean and super sharp and nicely updated home. Spacious living room. Updated kitchen with newer stainless steel appliances. Updated full bath. Home is freshly painted. New floors. 2 bedrooms on main level. Upper level can be split in 2 bedrooms. Washer/Dryer included. 1.5 car garage. Fenced yard.
-
2026-05-02historical $159,900 324-char remark
Show marketing remark (324 chars)
Welcome home to this super clean and super sharp and nicely updated home. Spacious living room. Updated kitchen with newer stainless steel appliances. Updated full bath. Home is freshly painted. New floors. 2 bedrooms on main level. Upper level can be split in 2 bedrooms. Washer/Dryer included. 1.5 car garage. Fenced yard.
-
2025-03-12soldstatus $125,000
-
2025-03-10soldstatus $125,000 Closed 441-char remark
Show marketing remark (441 chars)
Charming and cozy, this delightful bungalow is the perfect place to call home. With its spacious living areas, new appliances, and updated finishes throughout, this home is perfect for those looking to move into a nice and quiet neighborhood. The fully fenced yard provides a peaceful retreat, while the convenient location offers easy access to shops, restaurants, and parks. Don’t miss out on this gem—schedule a showing today!
-
2025-03-10soldstatus $125,000 Closed
Show marketing remark (441 chars)
Charming and cozy, this delightful bungalow is the perfect place to call home. With its spacious living areas, new appliances, and updated finishes throughout, this home is perfect for those looking to move into a nice and quiet neighborhood. The fully fenced yard provides a peaceful retreat, while the convenient location offers easy access to shops, restaurants, and parks. Don’t miss out on this gem—schedule a showing today!
-
2025-02-17status Pending
Show marketing remark (441 chars)
Charming and cozy, this delightful bungalow is the perfect place to call home. With its spacious living areas, new appliances, and updated finishes throughout, this home is perfect for those looking to move into a nice and quiet neighborhood. The fully fenced yard provides a peaceful retreat, while the convenient location offers easy access to shops, restaurants, and parks. Don’t miss out on this gem—schedule a showing today!
-
2025-02-17status Pending 441-char remark
Show marketing remark (441 chars)
Charming and cozy, this delightful bungalow is the perfect place to call home. With its spacious living areas, new appliances, and updated finishes throughout, this home is perfect for those looking to move into a nice and quiet neighborhood. The fully fenced yard provides a peaceful retreat, while the convenient location offers easy access to shops, restaurants, and parks. Don’t miss out on this gem—schedule a showing today!
-
2025-02-15$114,900 Active
-
2025-02-13$114,900 Active 441-char remark
Show marketing remark (441 chars)
Charming and cozy, this delightful bungalow is the perfect place to call home. With its spacious living areas, new appliances, and updated finishes throughout, this home is perfect for those looking to move into a nice and quiet neighborhood. The fully fenced yard provides a peaceful retreat, while the convenient location offers easy access to shops, restaurants, and parks. Don’t miss out on this gem—schedule a showing today!
-
2016-02-18soldstatus $175,000
-
2010-07-26soldstatus $15,000
-
2010-06-29$15,900
-
2005-04-06soldstatus $102,000
-
2005-01-28soldstatus $102,000
-
2004-09-02$99,900
-
2004-09-02historical
-
2004-07-30$109,900
-
1997-08-07soldstatus $61,000
-
1997-05-28$63,000
ⓘ Source: listings_history table (triggers on properties + properties_extension) + one-shot
backfill from property_details.listing_events for pre-trigger history.
Tax reassessment forecast MI · Partial reset (capped growth)
- Current annual tax
- $1,292 · $108/mo
- Projected year-2 tax
- $1,877 · $156/mo
- Expected delta
- +$585/yr (+$49/mo · 45.3%)
ⓘ Screening estimate from a state-policy table — verify with the county assessor before closing.
Climate risk First Street
- Flood 1/10 Low FEMA zone X (unshaded) · 0% chance over 30 yrs
- Wildfire 1/10 Low
- Heat 3/10 Moderate 7 d/yr ≥98°F today · 15 d/yr by 30 yrs out
- Wind 2/10 Low
- Air quality 2/10 Low 1 unhealthy d/yr today · 2 by 30 yrs out
Nearby sold comps map
Loading sold comps map…
Walkable amenities ~0.75 mi
Loading nearby amenities…
Taxation est. · year 1
- Rental income
- $19,474
- − Mortgage interest
- −$8,957
- − Property taxes
- −$1,292
- − Insurance
- −$800
- − Repairs & maintenance
- −$1,558
- − Management
- −$1,558
- − Depreciation
- −$4,652
- Taxable income
- $658
- Est. tax owed @ 24.0%
- −$158
- After-tax cash flow
- $3,072/yr
For passive investors: Depreciation is non-cash, so a rental often shows a tax loss while cash-flowing — sheltering income. Rental losses are passive: they offset passive income freely, and up to $25,000/yr can offset ordinary (W-2) income if you actively participate and your MAGI is under $100k (phasing out to $0 by $150k); unused losses carry forward. On sale, claimed depreciation is recaptured at up to 25%, and gains may owe capital-gains tax (a 1031 exchange can defer both). Figures are a year-1 estimate at your 24.0% rate — not tax advice; consult a CPA.
Schools (NCES district)
- District
- Westwood Community School District
- NCES district ID
- 2611640
- Math proficiency
- 6% ▼ -6.00%
- Reading proficiency
- 11% ▼ -6.00%
- Median HH income
- $36,350
- Composite
- 7.06/100
- National rank
- #9967
- State rank
- #529 of 540 in MI
Livability — Dearborn Heights
- Score
- 79/100
- State rank
- #82
- US rank
- #1885
Category grades
Schools grade is shown separately in the Schools card above.
Census & demographics
- Census place
- Dearborn Heights, MI
- County
- Wayne County · 1,562,939 people
- City population
- 61,771
- Metro
- Detroit-Warren-Dearborn, MI
- Population (ZIP)
- 22,125
- Household income
- $60,195
- Rent vs Own
- Severe rent burden
- 654.0
Population outlook (Wayne County) Hauer SSP2
- Today (2025)
- 1,675,273 people
- By 2030
- 1,620,300 · -3.3%
- By 2040
- 1,502,341 · -10.3%
- By 2050
- 1,384,039 · -17.4%
- By 2075
- 1,124,592 · -32.9%
- By 2100
- 881,193 · -47.4%
Race, ethnicity, and origin ACS 2023
- Neighborhood character
- Predominantly White (76%)
- Race & ethnicity
- White 76% Black 10% Two or more races 9% Hispanic / Latino 9%
- Hispanic origin (detail)
- Mexican 6%
- Common ancestry
- Romanian 11% Arab 3% Slovak 2%
- Foreign-born
- 11% · Canada
- Languages at home
- 82% English-only · Arabic 13% Spanish 3% Russian/Polish/Slavic 1%
Political lean MEDSL · Wayne
- 2024 margin
- Strong D (+29.0) · D 62.7% · R 33.7% · Other 3.6%
- 2008→2024 swing
- -20.5pp toward R · 2008: 49.5pp · 2024: 29.0pp
- All cycles
- 2024: D+29.0 2020: D+38.1 2016: D+37.3 2012: D+46.9 2008: D+49.5
Not yet ingested
- Civics
- —
Market trends
- HPI YoY
- ▼ -214.70%
- Current HPI
- 218.4698
- Rent YoY
- ▲ 2.03%
- Metro
- Detroit-Warren-Dearborn, MI
- State GDP YoY
- ▲ 1.37%
- F500 in state
- 28
Industry mix (Fortune 500 HQ in MI)
| Industry | F500 HQs | Revenue |
|---|---|---|
| Automotive Parts | 3 | $48B |
|
||
| Automotive | 2 | $372B |
|
||
| Chemicals | 1 | $45B |
|
||
| Automotive Retail | 1 | $29B |
|
||
| Healthcare / Medical Devices | 1 | $23B |
|
||
| Automotive Technology | 1 | $20B |
|
||
Price history
+153.8% since first listed20 events — show timeline
- 2026-05-05 Listed $159,900 MiRealSource-MiMLS
- 2026-05-05 Listed $159,900 REALCOMP
- 2026-05-02 Coming Soon $159,900 MiRealSource-MiMLS
- 2025-03-12 Sold (Public Records) $125,000 Public Records
- 2025-03-10 Sold (MLS) $125,000 MiRealSource-MiMLS
- 2025-03-10 Sold (MLS) $125,000 REALCOMP
- 2025-02-17 Pending — MiRealSource-MiMLS
- 2025-02-17 Pending — REALCOMP
- 2025-02-15 Listed $114,900 MiRealSource-MiMLS
- 2025-02-13 Listed $114,900 REALCOMP
- 2016-02-18 Sold (Public Records) $175,000 Public Records
- 2010-07-26 Sold (MLS) $15,000 REALCOMP
- 2010-06-29 Listed $15,900 REALCOMP
- 2005-04-06 Sold (Public Records) $102,000 Public Records
- 2005-01-28 Sold (MLS) $102,000 REALCOMP
- 2004-09-02 Listing Removed — REALCOMP
- 2004-09-02 Listed $99,900 REALCOMP
- 2004-07-30 Listed $109,900 REALCOMP
- 1997-08-07 Sold (MLS) $61,000 REALCOMP
- 1997-05-28 Listed $63,000 REALCOMP
Property tax history
-1.0%/yrLatest (2025): $1,292 · -32.4% YoY. Source: county tax records.
Cash-flow waterfall
monthlySold comps — $/sqft
last 12 mo · ≤1 miLoading sold comps…