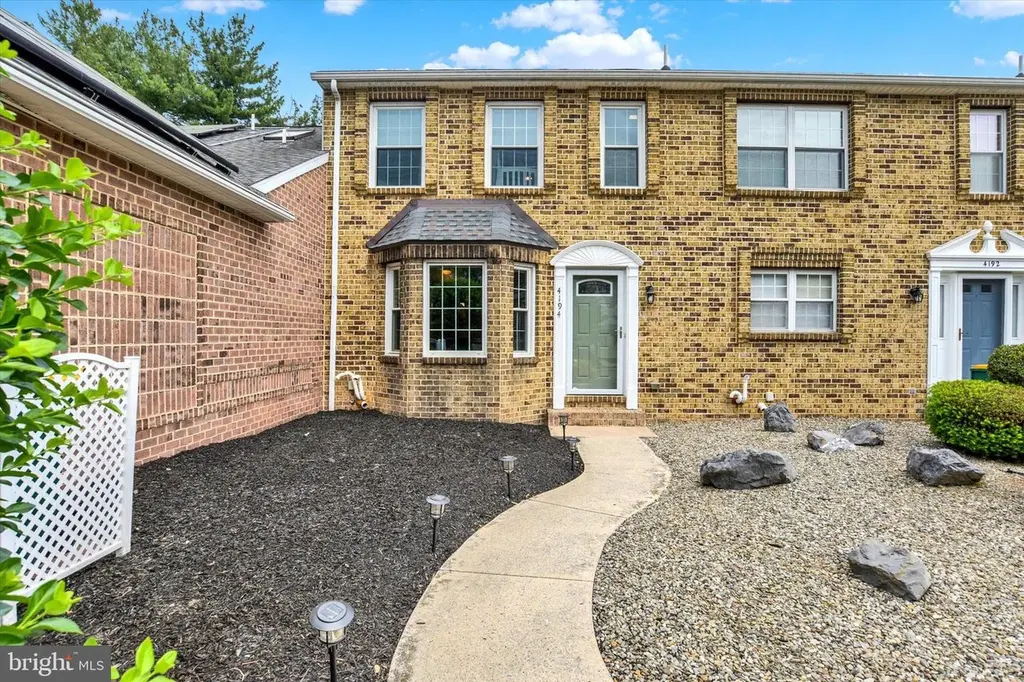
4194 Nantucket Dr · Enola, PA
Flood risk 1/10 · Minimal
- FEMA flood zone
- X (unshaded)
- Chance of flooding over 30 yrs
- 0.0%
- Est. flood insurance / yr
- $507 – $1,088
Fire risk 1/10 · Minimal
- Est. fire insurance / yr
- $511 – $949
Heat risk 5/10 · Moderate
- Hot days now (above 100°F)
- 7 days/yr
- Hot days in 30 yrs
- 15 days/yr
Wind risk 3/10 · Minor
- Chance of severe wind over 30 yrs
- 5.0%
Air-quality risk 2/10 · Minimal
- Unhealthy air days now
- 1 days/yr
- Unhealthy air days in 30 yrs
- 3 days/yr
Risk factors via First Street. Map © Google.
Why this score? — see what drove the D grade
The composite is a weighted blend of 9 inputs, each scored 0–100. Each bar is that input's sub-score; the figure is the points it added to the 100-point composite (weight × sub-score).
- Cash flow +10.9/30.0
- ARV discount +8.3/15.0
- Schools +5.6/10.0
- Livability +4.0/5.0
- DSCR +3.2/10.0
- 1% rule +3.0/10.0
- Rent growth +3.0/5.0
- Condition / age +2.5/5.0
- Appreciation +0.0/10.0
$265,000
🖨 Deal sheet (PDF) 📄 Offer letter ✓ Due diligence
Listing remarks MLS
Move in ready townhouse! This home is ideally located in desirable Hampden Township that is minutes away from the the new Giant and Weis Shopping Centers, new Pinnacle Hospital, and all major routes. This home has been painted from top to bottom, newer flooring installed throughout, new roof, and so much more. Each room has its own on suite full bathroom! Call today for a private tour!
Key facts
- $92 HOA
- Built 1992
- Listed 4 days
Property features AI
Finance
- HOA & community: HOA fee $275 quarterly
Exterior
- Parking: Off-street parking
- Utilities: Public water; Public sewer; 200+ amp electric service; Natural gas hot water
- Home design: Interior townhouse/rowhouse; Fee simple ownership; Not in a federal flood zone
- Construction: Brick and vinyl siding exterior; Composite roof; Concrete perimeter foundation; Year built (assessor source)
- Exterior features: Patio(s); Backs to open common area
Interior
- Kitchen: Dishwasher; Built-in microwave; Electric range/oven; Refrigerator
- Bedrooms: Two bedrooms on the first upper level; Master bedroom
- Bathrooms: Two full bathrooms (all upper levels); One half bathroom on the main level
- Heating & cooling: Forced air heating (natural gas); Central air conditioning
- Interior features: Fully finished full basement; Street lighting in neighborhood; Estimated living area
- Laundry & utility: Washer; Dryer; Upper-floor laundry
Neighborhood map
What this means for you Summary
Snapshot
- This is a 2-bed/2.5-bath townhouse listed at $265k.
Deal economics
- At list price, monthly cash flow is $-117 ($-1k/yr) — negative.
- To cash-flow at today's rent, offer at most $244k (7.8% below list).
- To meet the 1% rule (rent ≥ 1% of price), the offer needs to be $212k (19.9% below list).
- Recommended offer: $212k (19.9% below list) — sets the bar for 1% rule.
- Cap rate 5.8% vs local median 3.4% in Enola — top-decile yield for the area; either an underpriced asset or a hidden risk that comps aren't pricing in. Stress-test before assuming the spread holds.
Location & tenants
- Location reads 79/100 on livability (#243 in PA, #2,077 nationally) — a middle-class / working-renter tenant base. Strengths: cost of living A+, housing A+, health & safety A+; Watch: employment C-, commute D+, amenities F.
- Cumberland Valley SD (suburban): math 54% / reading 71% proficiency, ranked #52 of 539 in PA (top 10%) — acceptable for families but not a draw, mixed tenant base, ~2y average lease; only 13% free/reduced lunch — higher-income household profile.
- Zoned schools: Hampden El Sch (math 65% / reading 75%, grade A-, #147 of 1,518 statewide, top 10%, 530 students, 27% FRL); Mountain View Ms (math 46% / reading 70%, grade B, #59 of 512 statewide, top 12%, 1,378 students, 26% FRL); Cumberland Valley Hs (math 66% / reading 24%, grade D-, #191 of 437 statewide, top 44%, 3,035 students, 25% FRL).
- Market conditions: Rents rising (+2.0%/yr); 341 active listings in the ZIP; 3 comparable units currently listed for rent nearby; rentals lingering (median 46d on market — plan ~5-8 weeks vacancy on turnover, expect pricing pressure); 67% of comp listings sitting > 30 days — soft ceiling on asking rent; high-income renter base; 1,052 units permitted in Cumberland County in 2024 (310 in 5+ unit buildings).
Forward outlook
- Local home prices are declining (-3.0%/yr); year-one equity from $2k of loan paydown is wiped out by about $8k of value loss. Plan a longer hold.
- Cumberland County population projected at +17% by 2050 — long-run rental-demand tailwind backs the buy-and-hold thesis.
Negotiation context
- Only 4 days on market — expect competitive offers; lowballing is unlikely to land.
- 3 sale attempts since 15y ago; this cycle's ask is 51% above the opening price — seller raised mid-cycle; expect resistance to lowballs.
- Current owner paid $175k; list at $265k implies a 51% gain — meaningful room to come down on a strong offer.
Risks & watch-outs
- Climate carrying-cost: extreme-heat days projected 7→15/yr by 2055 (HVAC capex compounding) — expect insurance premiums to compound above CPI over the hold.
Questions for the listing agent
- What do current leases actually rent for vs. the listed asking? Can we see a recent rent roll and the last 12 months of T-12 income?
- What does the HOA fee cover, when was the last increase, and are there any pending special assessments or reserve-fund shortfalls?
- Is there a deadline driving the sale (1031 exchange, divorce, estate, relocation)? That informs how much negotiation room exists.
- Schools are B-rated — typically a magnet for longer-tenancy family renters. What's the average tenant stay here, and is there a school-zone premium baked into asking?
- The area grade is low — what's the realistic commute time and amenity access for the typical tenant pool here? Any planned neighborhood developments (good or bad) we should know about?
- What's the average days-on-market for RENTAL listings here right now (not sales)? A rising rental-DOM trend means longer vacancies and softer asking-rent achievability than the comps imply.
- What's the recent tenant-quality profile in this submarket — average credit score on applications, eviction rate, late-payment / NSF rate, and stable-employment percentage? A property-management company in the area should have these aggregated.
- How much new for-sale + rental construction is in the pipeline within 1–3 miles? Heavy new supply typically softens prices + rents 12–24 months out; constrained supply supports both.
Investment metrics
- 1% rule
- 0.80% ✗
- Cap rate
- 5.77%
- Cash-on-cash
- -1.89%
- DSCR
- 0.92
- GRM
- 10.4
CMA / ARV
- ARV (on-the-fly)
- $270,072
- Comps found
- 12
Show comp detail 12 sales within ~0.75 mi
| Address | Dist | Beds/Ba | Sqft | Sold | Price | $/sf | Match |
|---|---|---|---|---|---|---|---|
| 4226 Nantucket Dr | 0.07mi | 2/2.5 | 1,466 (+1%) | 8mo | $260,000 | $177 | 89 |
| 4186 Nantucket Dr | 0.02mi | 3/2.5 (+1) | 1,496 (+3%) | 7mo | $305,000 | $204 | 83 |
| 4261 Nantucket Dr | 0.10mi | 2/2.5 | 1,336 (-8%) | 17mo | $247,900 | $186 | 68 |
| 1450 Timber Chase Dr | 0.62mi | 2/2.0 | 1,440 (-1%) | 7mo | $236,500 | $164 | 62 |
| 1486 Timber Chase Dr | 0.65mi | 3/2.5 (+1) | 1,364 (-6%) | 3mo | $257,000 | $188 | 52 |
| 1510 Timber Chase Dr | 0.71mi | 2/2.0 | 1,415 (-2%) | 12mo | $239,900 | $170 | 51 |
| 1097 Pebble | 0.22mi | 2/2.0 | 1,663 (+14%) | 17mo | $345,000 | $207 | 49 |
| 1462 Timber Brook Dr | 0.69mi | 3/2.5 (+1) | 1,496 (+3%) | 11mo | $286,000 | $191 | 49 |
| 1286 Timber View Dr | 0.69mi | 3/2.5 (+1) | 1,496 (+3%) | 11mo | $274,900 | $184 | 49 |
| 1260 Timber View Dr | 0.67mi | 2/2.5 | 1,320 (-9%) | 10mo | $251,000 | $190 | 46 |
| 1526 Tussey Ct | 0.63mi | 2/1.5 | 1,620 (+12%) | 10mo | $247,500 | $153 | 39 |
| 4165 Kittatinny Dr | 0.63mi | 2/1.5 | 1,620 (+12%) | 18mo | $225,000 | $139 | 32 |
Match score weights: distance 35% · size 25% · config 20% · recency 20%. Top-matched comps best support the ARV.
Projected returns pro-forma
-3.0% appreciation · 1.99% rent growth · sell at horizon
- IRR
- -20.5%
- Equity multiple
- 0.29×
- Total profit
- $-52,492
- Equity at exit
- $39,512
- IRR
- -16.0%
- Equity multiple
- 0.14×
- Total profit
- $-63,820
- Equity at exit
- $22,912
Cash invested: $74,200 (down + closing). Projections, not guarantees.
Landlord ↔ Tenant lean methodology
- Overall (STATE)
- 62 Landlord-Friendly
- State Pennsylvania
- 62 Landlord-Friendly · EVEN
- County
- — inherits STATE
- City
- — inherits STATE
ZIP-level market 17050
- Rents YoY
- 2.0%
- Active inventory
- 341
- Price-to-rent
- 10.4×
Monthly cashflow live
- Estimated rent
- $2,123 medium interval (Pro) →
- Mortgage (P&I)
- −$1,390
- Tax from tax record
- −$201 /mo · $2,416/yr
- Insurance
- −$110
- HOA
- −$92
- Vacancy / Maint / Mgmt
- −$446
- Net cashflow
- $-117
Break-even live
Sensitivity live
| Price | -10% $33 | -5% $-42 | +0% $-117 | +5% $-192 | +10% $-267 |
|---|---|---|---|---|---|
| Rent | -10% $-284 | -5% $-200 | +0% $-117 | +5% $-33 | +10% $51 |
| Rate | -1.0pp $17 | -0.5pp $-49 | base $-117 | +0.5pp $-185 | +1.0pp $-255 |
UW: 25.0% down · 7.5% · 30yr · 1.5% tax · 5.0% vac · 8.0% maint · 8.0% mgmt
Financing live
Cash to close
- Down payment
- $66,250
- Closing costs
- $7,950
- Reserves months
- —
- Total cash needed
- —
Loan-product check · same deal, 3 products live
Conventional
25% down · 7.5% · 30yr
- Down + closing
- —
- Monthly P&I
- —
- Monthly cashflow
- —
- DSCR
- —
- Eligible?
- —
Personal DTI + credit; lowest rate.
DSCR
20% down · 8.5% · 30yr
- Down + closing
- —
- Monthly P&I
- —
- Monthly cashflow
- —
- DSCR
- —
- Eligible?
- —
No personal income docs; deal must DSCR.
Hard money
10% down · 12.0% · 12mo
- Down + closing
- —
- Monthly P&I
- —
- Monthly cashflow
- —
- DSCR
- —
- Eligible?
- —
Short-term bridge; refi at stabilization.
Rent comps 3 comps
| Address | Beds | Baths | Sqft | Rent | $/sqft | DOM | Units | Dist |
|---|---|---|---|---|---|---|---|---|
| 5050 Mendenhall Dr Mechanicsburg, PA | 3.0 | 4.0 | 1829 | $2,475 | $1.35 | 45d | 1 | 1.02mi |
| 99 Lee Ann Ct Enola, PA | 3.0 | 2.5 | 1540 | $1,995 | $1.30 | 15d | 1 | 1.20mi |
| 2208 Gleim Ct Enola, PA | 3.0 | 3.0 | 1418 | $2,050 | $1.45 | 45d | 1 | 1.23mi |
HOA detail
- Monthly dues
- $92 · $1,104/yr
Listing history 16 events
-
2026-06-01statusdays on market $265,000 Pending 4 DOM
-
2026-05-31days on market $265,000 Active 3 DOM
-
2026-05-31days on market $265,000 Active 2 DOM
-
2026-05-22historical $265,000
-
2019-12-23soldstatus $175,000
-
2019-12-20soldstatus $175,000 Closed 389-char remark
Show marketing remark (389 chars)
Move in ready townhouse! This home is ideally located in desirable Hampden Township that is minutes away from the the new Giant and Weis Shopping Centers, new Pinnacle Hospital, and all major routes. This home has been painted from top to bottom, newer flooring installed throughout, new roof, and so much more. Each room has its own on suite full bathroom! Call today for a private tour!
-
2019-11-10status Pending 389-char remark
Show marketing remark (389 chars)
Move in ready townhouse! This home is ideally located in desirable Hampden Township that is minutes away from the the new Giant and Weis Shopping Centers, new Pinnacle Hospital, and all major routes. This home has been painted from top to bottom, newer flooring installed throughout, new roof, and so much more. Each room has its own on suite full bathroom! Call today for a private tour!
-
2019-11-07$175,000 Active 389-char remark
Show marketing remark (389 chars)
Move in ready townhouse! This home is ideally located in desirable Hampden Township that is minutes away from the the new Giant and Weis Shopping Centers, new Pinnacle Hospital, and all major routes. This home has been painted from top to bottom, newer flooring installed throughout, new roof, and so much more. Each room has its own on suite full bathroom! Call today for a private tour!
-
2016-01-14historical
-
2015-07-10$175,000
-
2011-08-18soldstatus $147,900
-
2011-08-16soldstatus $147,900
-
2011-07-08historical
-
2011-06-08$147,900
-
2005-11-28soldstatus $125,000
-
1993-01-04soldstatus $92,200
ⓘ Source: listings_history table (triggers on properties + properties_extension) + one-shot
backfill from property_details.listing_events for pre-trigger history.
Tax reassessment forecast PA · Partial reset (capped growth)
- Current annual tax
- $2,416 · $201/mo
- Projected year-2 tax
- $3,301 · $275/mo
- Expected delta
- +$886/yr (+$74/mo · 36.7%)
ⓘ Screening estimate from a state-policy table — verify with the county assessor before closing.
Climate risk First Street
- Flood 1/10 Low FEMA zone X (unshaded) · 0% chance over 30 yrs
- Wildfire 1/10 Low
- Heat 5/10 Major 7 d/yr ≥100°F today · 15 d/yr by 30 yrs out
- Wind 3/10 Moderate 5% chance of damaging wind over 30 yrs
- Air quality 2/10 Low 1 unhealthy d/yr today · 3 by 30 yrs out
Nearby sold comps map
Loading sold comps map…
Walkable amenities ~0.75 mi
Loading nearby amenities…
Taxation est. · year 1
- Rental income
- $25,471
- − Mortgage interest
- −$14,844
- − Property taxes
- −$2,416
- − Insurance
- −$1,325
- − Repairs & maintenance
- −$2,038
- − Management
- −$2,038
- − HOA
- −$1,104
- − Depreciation
- −$7,709
- Taxable loss
- −$6,002
- Est. tax savings @ 24.0%
- +$1,441
- After-tax cash flow
- $42/yr
For passive investors: Depreciation is non-cash, so a rental often shows a tax loss while cash-flowing — sheltering income. Rental losses are passive: they offset passive income freely, and up to $25,000/yr can offset ordinary (W-2) income if you actively participate and your MAGI is under $100k (phasing out to $0 by $150k); unused losses carry forward. On sale, claimed depreciation is recaptured at up to 25%, and gains may owe capital-gains tax (a 1031 exchange can defer both). Figures are a year-1 estimate at your 24.0% rate — not tax advice; consult a CPA.
Schools (NCES district)
- District
- Cumberland Valley SD
- NCES district ID
- 4207110
- Math proficiency
- 54% ▼ -6.00%
- Reading proficiency
- 71% ▼ -7.00%
- Median HH income
- $78,135
- Composite
- 55.77/100
- National rank
- #1218
- State rank
- #52 of 539 in PA
Livability — Enola
- Score
- 79/100
- State rank
- #243
- US rank
- #2077
Category grades
Schools grade is shown separately in the Schools card above.
Census & demographics
- County
- Cumberland County · 257,673 people
- City population
- 17,648
- Metro
- Harrisburg-Carlisle, PA
- Population (ZIP)
- 43,571
- Household income
- $113,720
- Rent vs Own
- Severe rent burden
- 535.0
Population outlook (Cumberland County) Hauer SSP2
- Today (2025)
- 267,950 people
- By 2030
- 278,105 · +3.8%
- By 2040
- 296,552 · +10.7%
- By 2050
- 312,937 · +16.8%
- By 2075
- 349,233 · +30.3%
- By 2100
- 361,875 · +35.1%
Race, ethnicity, and origin ACS 2023
- Neighborhood character
- Predominantly White (75%)
- Race & ethnicity
- White 75% Asian 16% Two or more races 5% Hispanic / Latino 4% Black 1%
- Common ancestry
- Romanian 4% Lithuanian 2% Slovak 2%
- Foreign-born
- 16% · Canada, China, Vietnam
- Languages at home
- 81% English-only · Other Indo-European 6% Other Asian/Pacific 5% Spanish 3%
Political lean MEDSL · Cumberland
- 2024 margin
- Lean R (+9.4) · D 44.6% · R 54.1% · Other 1.3%
- 2008→2024 swing
- +4.2pp toward D · 2008: -13.6pp · 2024: -9.4pp
- All cycles
- 2024: R+9.4 2020: R+10.6 2016: R+18.6 2012: R+18.5 2008: R+13.6
Not yet ingested
- Civics
- —
Market trends
- HPI YoY
- ▼ -140.84%
- Current HPI
- 241.7363
- Rent YoY
- ▲ 1.99%
- Metro
- Harrisburg-Carlisle, PA
- State GDP YoY
- ▲ 1.68%
- F500 in state
- 34
Industry mix (Fortune 500 HQ in PA)
| Industry | F500 HQs | Revenue |
|---|---|---|
| Healthcare | 2 | $309B |
|
||
| Insurance | 2 | $27B |
|
||
| Telecommunications / Media | 1 | $124B |
|
||
| Industrial Distribution | 1 | $22B |
|
||
| Financial Services | 1 | $20B |
|
||
| Chemicals / Materials | 1 | $18B |
|
||
Price history
+187.4% since first listed13 events — show timeline
- 2026-05-22 Coming Soon $265,000 BRIGHT MLS
- 2019-12-23 Sold (Public Records) $175,000 Public Records
- 2019-12-20 Sold (MLS) $175,000 BRIGHT MLS
- 2019-11-10 Pending — BRIGHT MLS
- 2019-11-07 Listed $175,000 BRIGHT MLS
- 2016-01-14 Listing Removed — BRIGHT MLS
- 2015-07-10 Listed $175,000 BRIGHT MLS
- 2011-08-18 Sold (Public Records) $147,900 Public Records
- 2011-08-16 Sold (MLS) $147,900 BRIGHT MLS
- 2011-07-08 Listing Removed — BRIGHT MLS
- 2011-06-08 Listed $147,900 BRIGHT MLS
- 2005-11-28 Sold (Public Records) $125,000 Public Records
- 1993-01-04 Sold (Public Records) $92,200 Public Records
Property tax history
+2.8%/yrLatest (2026): $2,416 · +3.2% YoY. Source: county tax records.
Cash-flow waterfall
monthlySold comps — $/sqft
last 12 mo · ≤1 miLoading sold comps…