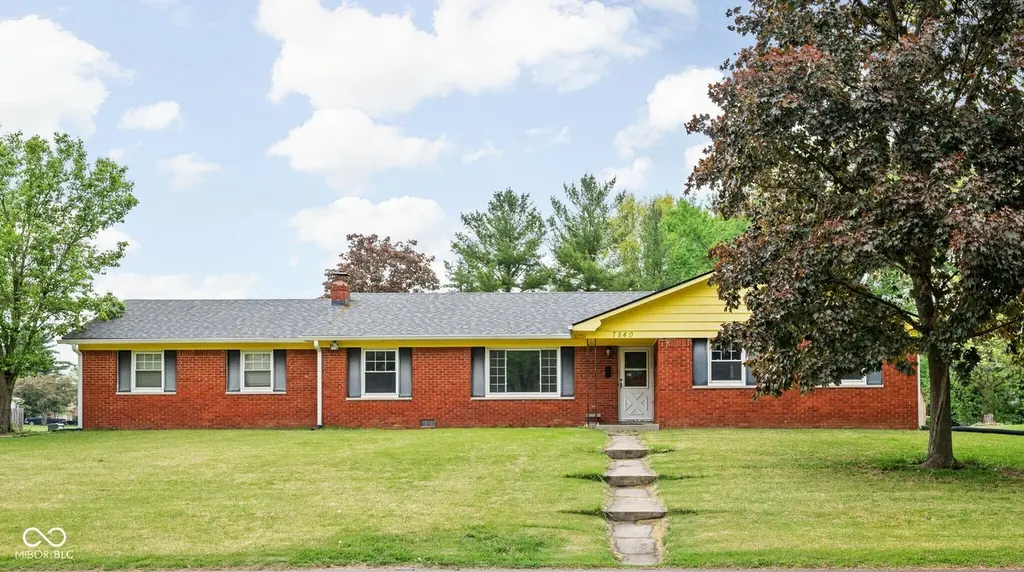
7840 Jennifer Ln · Brownsburg, IN
Flood risk 1/10 · Minimal
- FEMA flood zone
- X (unshaded)
- Chance of flooding over 30 yrs
- 0.0%
- Est. flood insurance / yr
- $507 – $1,088
Fire risk 1/10 · Minimal
- Est. fire insurance / yr
- $717 – $1,331
Heat risk 3/10 · Minor
- Hot days now (above 100°F)
- 7 days/yr
- Hot days in 30 yrs
- 19 days/yr
Wind risk 2/10 · Minimal
- Chance of severe wind over 30 yrs
- 1.0%
Air-quality risk 3/10 · Minor
- Unhealthy air days now
- 2 days/yr
- Unhealthy air days in 30 yrs
- 3 days/yr
Risk factors via First Street. Map © Google.
Why this score? — see what drove the C+ grade
The composite is a weighted blend of 9 inputs, each scored 0–100. Each bar is that input's sub-score; the figure is the points it added to the 100-point composite (weight × sub-score).
- Cash flow +19.8/30.0
- ARV discount +15.0/15.0
- DSCR +6.3/10.0
- Schools +6.3/10.0
- 1% rule +4.7/10.0
- Rent growth +4.1/5.0
- Livability +3.8/5.0
- Condition / age +2.5/5.0
- Appreciation +0.0/10.0
$219,900
🖨 Deal sheet 📄 Offer letter ✓ Due diligence
Listing remarks
Super Custom Built All Brick Ranch in Wonderful Established North Brownsburg Neighborhood! Fabulous Location Close to Shopping, Dining, Parks, Highways for Easy Commute and Award Winning Brownsburg Schools!! You'll Love this Spacious Floor Plan Featuring Large Family Room with Beautiful Full Wall Stone Fireplace Open to Kitchen and Large Dining Room with Lovely Hardwood Floors! There's also a Good Size Living Room which could Flex as an Ideal Home Office/Den. Three Spacious Bedrooms all also have Hardwoods Floors as well, and include Primary Suite with Full Bathroom and Large Closet! Spacious 2 Car Side Load Attached Garage and Covered Front Porch and Rear Deck! Spectacular Yard is nearly .
Key facts
- Close to parks
- All brick ranch
- Close to dining
Tags
Property features AI
Exterior
- Parking: Attached 2-car garage with garage door opener; Guest street parking
- Utilities: Private water source; Septic system; 200+ amp electric service; Cable available; Electricity connected; Natural gas connected; Water connected; Sewer connected
- Home design: Single-family residence; One level
- Construction: Brick construction; Block foundation
- Exterior features: Covered patio; Patio; Mini barn; Full yard fencing; Mature trees; Corner lot with curbs and sidewalks; Storm sewer
Interior
- Kitchen: Gas oven; Range hood; Refrigerator; Disposal
- Bedrooms: 3 bedrooms (all on the main level)
- Bathrooms: 2 full bathrooms; Primary bathroom with full shower stall
- Heating & cooling: Forced air heating (natural gas); Central air conditioning
- Interior features: Attic access; Wood-burning fireplace in family room
- Laundry & utility: Laundry located in garage; Gas water heater
Neighborhood map
What this means for you Summary
Snapshot
- This is a 3-bed/2.0-bath single-family listed at $220k.
Deal economics
- At list price, monthly cash flow is $263 ($3k/yr) — positive.
- The deal already cash-flows at list — no discount required.
- To meet the 1% rule (rent ≥ 1% of price), the offer needs to be $213k (3.3% below list).
- Recommended offer: $213k (3.3% below list) — sets the bar for 1% rule.
- Cap rate 7.7% vs local median 3.8% in Brownsburg — top-decile yield for the area; either an underpriced asset or a hidden risk that comps aren't pricing in. Stress-test before assuming the spread holds.
Location & tenants
- Location reads 75/100 on livability (#61 in IN, #4,105 nationally) — a middle-class / working-renter tenant base. Strengths: schools A+, crime A+, employment A+; Watch: amenities F, commute F, health & safety F.
- Brownsburg Community School Corporation (suburban): math 72% / reading 72% proficiency, ranked #2 of 301 in IN (top 1%) — strong family-tenant draw, lease renewals of 3-5y typical; only 17% free/reduced lunch — higher-income household profile.
- Market conditions: Rents rising fast (+6.3%/yr); 328 active listings in the ZIP; 4 comparable units currently listed for rent nearby; rentals at typical pace (median 15d on market — plan ~3-4 weeks tenant-placement turnaround); high-income renter base; 1,294 units permitted in Hendricks County in 2024 (18 in 5+ unit buildings).
Forward outlook
- Local home prices are declining (-3.0%/yr); year-one equity from $2k of loan paydown is wiped out by about $7k of value loss. Plan a longer hold.
- Hendricks County population projected at +35% by 2050 — long-run rental-demand tailwind backs the buy-and-hold thesis.
Negotiation context
- It's been on market 20 days — a 2% lower offer ($217k) is reasonable based on typical stale-listing flexibility.
- 4 sale attempts; this cycle's ask has dropped $33k (13%) from the opening price — seller is motivated, your offer sets the floor, not the list.
Questions for the listing agent
- Built in 1969 — when were the roof, HVAC, electrical panel, plumbing, and water heater last replaced?
- Is there a deadline driving the sale (1031 exchange, divorce, estate, relocation)? That informs how much negotiation room exists.
- Schools are A-rated — typically a magnet for longer-tenancy family renters. What's the average tenant stay here, and is there a school-zone premium baked into asking?
- What's the average days-on-market for RENTAL listings here right now (not sales)? A rising rental-DOM trend means longer vacancies and softer asking-rent achievability than the comps imply.
- What's the recent tenant-quality profile in this submarket — average credit score on applications, eviction rate, late-payment / NSF rate, and stable-employment percentage? A property-management company in the area should have these aggregated.
- How much new for-sale + rental construction is in the pipeline within 1–3 miles? Heavy new supply typically softens prices + rents 12–24 months out; constrained supply supports both.
Investment metrics
- 1% rule
- 0.97% ✗
- Cap rate
- 7.73%
- Cash-on-cash
- 5.12%
- DSCR
- 1.23
- GRM
- 8.6
CMA / ARV
- ARV (median comp)
- $318,460
- List price
- $219,900
- Delta
- -30.95%
- Verdict
- UNDERPRICED
- Comps
- 20 within 1.0 mi
Show comp detail 12 sales within ~0.75 mi
| Address | Dist | Beds/Ba | Sqft | Sold | Price | $/sf | Match |
|---|---|---|---|---|---|---|---|
| 7859 Jennifer Ln | 0.04mi | 3/2.0 | 1,440 (-1%) | 13mo | $305,000 | $212 | 87 |
| 327 Brooks Bnd | 0.45mi | 3/2.0 | 1,410 (-3%) | 4mo | $250,000 | $177 | 71 |
| 7680 Sherry Ln | 0.45mi | 3/2.0 | 1,428 (-1%) | 7mo | $271,900 | $190 | 71 |
| 1568 Winding Creek Trl | 0.54mi | 3/2.0 | 1,400 (-3%) | 2mo | $270,000 | $193 | 68 |
| 7694 Poplar Rd | 0.37mi | 4/2.0 (+1) | 1,494 (+3%) | 6mo | $284,900 | $191 | 67 |
| 7580 Sherry Ln | 0.50mi | 3/1.5 | 1,444 (-0%) | 11mo | $273,286 | $189 | 65 |
| 1579 Winding Creek Trl | 0.51mi | 3/2.0 | 1,411 (-3%) | 11mo | $250,000 | $177 | 62 |
| 141 Brooks Bnd | 0.61mi | 3/2.0 | 1,365 (-6%) | 2mo | $274,000 | $201 | 60 |
| 328 Brooks Bnd | 0.45mi | 3/2.0 | 1,645 (+14%) | 1mo | $300,000 | $182 | 56 |
| 7395 N State Road 267 | 0.35mi | 3/2.0 | 1,232 (-15%) | 7mo | $265,000 | $215 | 53 |
| 736 Hawthorne Ln | 0.74mi | 3/2.0 | 1,284 (-11%) | 6mo | $200,000 | $156 | 42 |
| 1351 Audubon Dr | 0.74mi | 3/2.0 | 1,292 (-11%) | 9mo | $274,000 | $212 | 40 |
Match score weights: distance 35% · size 25% · config 20% · recency 20%. Top-matched comps best support the ARV.
Projected returns pro-forma
-3.0% appreciation · 6.31% rent growth · sell at horizon
- IRR
- -4.9%
- Equity multiple
- 0.81×
- Total profit
- $-11,605
- Equity at exit
- $32,788
- IRR
- 8.1%
- Equity multiple
- 1.71×
- Total profit
- $43,475
- Equity at exit
- $19,013
Cash invested: $61,572 (down + closing). Projections, not guarantees.
Landlord ↔ Tenant lean methodology
- Overall (STATE)
- 90 Strongly Landlord-Friendly
- State Indiana
- 90 Strongly Landlord-Friendly · R+11
- County
- — inherits STATE
- City
- — inherits STATE
ZIP-level market 46112
- Rents YoY
- 6.3%
- Active inventory
- 328
- Price-to-rent
- 8.6×
Monthly cashflow live
- Estimated rent
- $2,127 medium interval (Pro) →
- Mortgage (P&I)
- −$1,153
- Tax from tax record
- −$173 /mo · $2,073/yr
- Insurance
- −$92
- HOA
- −$0
- Vacancy / Maint / Mgmt
- −$447
- Net cashflow
- $263
Break-even live
UW: 25.0% down · 7.5% · 30yr · 1.5% tax · 5.0% vac · 8.0% maint · 8.0% mgmt
Financing live
Cash to close
- Down payment
- $54,975
- Closing costs
- $6,597
- Reserves months
- —
- Total cash needed
- —
Loan-product check · same deal, 3 products live
Conventional
25% down · 7.5% · 30yr
- Down + closing
- —
- Monthly P&I
- —
- Monthly cashflow
- —
- DSCR
- —
- Eligible?
- —
Personal DTI + credit; lowest rate.
DSCR
20% down · 8.5% · 30yr
- Down + closing
- —
- Monthly P&I
- —
- Monthly cashflow
- —
- DSCR
- —
- Eligible?
- —
No personal income docs; deal must DSCR.
Hard money
10% down · 12.0% · 12mo
- Down + closing
- —
- Monthly P&I
- —
- Monthly cashflow
- —
- DSCR
- —
- Eligible?
- —
Short-term bridge; refi at stabilization.
Rent comps 4 comps
| Address | Beds | Baths | Sqft | Rent | $/sqft | DOM | Units | Dist |
|---|---|---|---|---|---|---|---|---|
| 1573 Winding Creek Trl Brownsburg, IN | 4.0 | 2.5 | 1836 | $2,211 | $1.20 | 15d | 1 | 0.54mi |
| 1083 Pine Ridge Way Brownsburg, IN | 3.0 | 2.0 | 1434 | $1,955 | $1.36 | 4d | 1 | 1.16mi |
| 711 Green Ridge Pkwy Brownsburg, IN | 1.0–2.0 | 1.0–2.0 | 857 | $1,529 | $1.78 | 2d | 3 | 1.45mi |
| 6480 E County Road 700 N Brownsburg, IN | 3.0 | 1.0 | 950 | $1,650 | $1.74 | 44d | 1 | 1.47mi |
Listing history 8 events
-
2026-06-13statusdays on market $219,900 Pending 20 DOM
-
2026-06-09statusdays on market $219,900 Active 19 DOM
-
2026-05-31status $219,900 Pending 18 DOM
-
2026-05-31days on market $219,900 Active 18 DOM
-
2026-05-13status Active 854-char remark
-
2026-05-13price $240,000 854-char remark
-
2026-05-04status Pending 854-char remark
-
2026-04-28$253,300 Active 854-char remark
ⓘ Source: listings_history table (triggers on properties + properties_extension) + one-shot
backfill from property_details.listing_events for pre-trigger history.
Tax reassessment forecast IN · Partial reset (capped growth)
- Current annual tax
- $2,073 · $173/mo
- Projected year-2 tax
- $2,073 · $173/mo
- Expected delta
- $0/yr ($0/mo · 0.0%)
ⓘ Screening estimate from a state-policy table — verify with the county assessor before closing.
Climate risk First Street
- Flood 1/10 Low FEMA zone X (unshaded) · 0% chance over 30 yrs
- Wildfire 1/10 Low
- Heat 3/10 Moderate 7 d/yr ≥100°F today · 19 d/yr by 30 yrs out
- Wind 2/10 Low 100% chance of damaging wind over 30 yrs
- Air quality 3/10 Moderate 2 unhealthy d/yr today · 3 by 30 yrs out
Nearby sold comps map
Loading sold comps map…
Walkable amenities ~0.75 mi
Loading nearby amenities…
Taxation est. · year 1
- Rental income
- $25,525
- − Mortgage interest
- −$12,318
- − Property taxes
- −$2,073
- − Insurance
- −$1,100
- − Repairs & maintenance
- −$2,042
- − Management
- −$2,042
- − Depreciation
- −$6,397
- Taxable loss
- −$447
- Est. tax savings @ 24.0%
- +$107
- After-tax cash flow
- $3,261/yr
For passive investors: Depreciation is non-cash, so a rental often shows a tax loss while cash-flowing — sheltering income. Rental losses are passive: they offset passive income freely, and up to $25,000/yr can offset ordinary (W-2) income if you actively participate and your MAGI is under $100k (phasing out to $0 by $150k); unused losses carry forward. On sale, claimed depreciation is recaptured at up to 25%, and gains may owe capital-gains tax (a 1031 exchange can defer both). Figures are a year-1 estimate at your 24.0% rate — not tax advice; consult a CPA.
Schools (NCES district)
- District
- Brownsburg Community School Corporation
- NCES district ID
- 1801020
- Math proficiency
- 72% ▼ -5.00%
- Reading proficiency
- 72% ▼ -4.00%
- Median HH income
- $75,304
- Composite
- 63.45/100
- National rank
- #616
- State rank
- #2 of 301 in IN
Livability — Brownsburg
- Score
- 75/100
- State rank
- #61
- US rank
- #4105
Category grades
Schools grade is shown separately in the Schools card above.
Census & demographics
- County
- Hendricks County · 143,373 people
- City population
- 44,220
- Metro
- Indianapolis-Carmel-Anderson, IN
- Population (ZIP)
- 44,220
- Household income
- $112,565
- Rent vs Own
- Severe rent burden
- 614.0
Population outlook (Hendricks County) Hauer SSP2
- Today (2025)
- 187,418 people
- By 2030
- 201,494 · +7.5%
- By 2040
- 228,487 · +21.9%
- By 2050
- 253,068 · +35.0%
- By 2075
- 308,920 · +64.8%
- By 2100
- 336,510 · +79.6%
Race, ethnicity, and origin ACS 2023
- Neighborhood character
- Predominantly White (83%)
- Race & ethnicity
- White 83% Black 10% Two or more races 4% Hispanic / Latino 4%
- Common ancestry
- Slovak 3% Iranian 2% Romanian 2%
- Foreign-born
- 6% · Canada, China
- Languages at home
- 93% English-only · Spanish 2% French/Haitian/Cajun 1%
Political lean MEDSL · Hendricks
- 2024 margin
- Strong R (+21.5) · D 38.4% · R 59.9% · Other 1.7%
- 2008→2024 swing
- +1.9pp toward D · 2008: -23.4pp · 2024: -21.5pp
- All cycles
- 2024: R+21.5 2020: R+23.9 2016: R+34.2 2012: R+34.9 2008: R+23.4
Not yet ingested
- Civics
- —
Market trends
- HPI YoY
- ▼ -135.99%
- Current HPI
- 217.3787
- Rent YoY
- ▲ 6.31%
- Metro
- Indianapolis-Carmel-Anderson, IN
- State GDP YoY
- ▲ 2.90%
- F500 in state
- 18
Industry mix (Fortune 500 HQ in IN)
| Industry | F500 HQs | Revenue |
|---|---|---|
| Industrial Machinery | 2 | $37B |
|
||
| Healthcare | 1 | $177B |
|
||
| Pharmaceuticals | 1 | $45B |
|
||
| Metals / Steel | 1 | $18B |
|
||
| Agriculture | 1 | $17B |
|
||
| Packaging | 1 | $12B |
|
||
Price history
-13.2% since first listed10 events — show timeline
- 2026-06-11 Pending — MIBOR as Distributed by MLS Grid
- 2026-06-08 Relisted — MIBOR as Distributed by MLS Grid
- 2026-05-31 Pending — MIBOR as Distributed by MLS Grid
- 2026-05-27 Relisted — MIBOR as Distributed by MLS Grid
- 2026-05-27 Price Changed $219,900 MIBOR as Distributed by MLS Grid
- 2026-05-21 Pending — MIBOR as Distributed by MLS Grid
- 2026-05-13 Relisted — MIBOR as Distributed by MLS Grid
- 2026-05-13 Price Changed $240,000 MIBOR as Distributed by MLS Grid
- 2026-05-04 Pending — MIBOR as Distributed by MLS Grid
- 2026-04-28 Listed $253,300 MIBOR as Distributed by MLS Grid
Property tax history
+5.2%/yrLatest (2025): $2,073 · +23.0% YoY. Source: county tax records.
Cash-flow waterfall
monthlySold comps — $/sqft
last 12 mo · ≤1 miLoading sold comps…