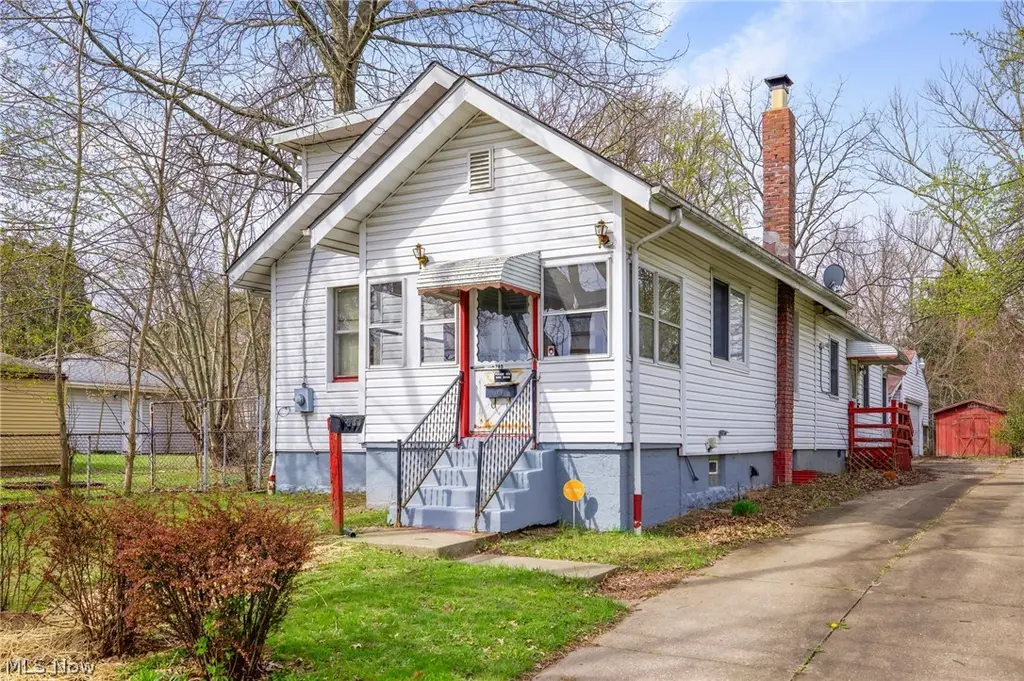
740 Fuller St · Akron, OH
Flood risk 1/10 · Minimal
- FEMA flood zone
- X (unshaded)
- Chance of flooding over 30 yrs
- 0.0%
- Est. flood insurance / yr
- $473 – $860
Fire risk 1/10 · Minimal
- Est. fire insurance / yr
- $713 – $1,323
Heat risk 3/10 · Minor
- Hot days now (above 96°F)
- 7 days/yr
- Hot days in 30 yrs
- 17 days/yr
Wind risk 1/10 · Minimal
- Chance of severe wind over 30 yrs
- —
Air-quality risk 3/10 · Minor
- Unhealthy air days now
- 2 days/yr
- Unhealthy air days in 30 yrs
- 4 days/yr
Risk factors via First Street. Map © Google.
Why this score? — see what drove the B+ grade
The composite is a weighted blend of 9 inputs, each scored 0–100. Each bar is that input's sub-score; the figure is the points it added to the 100-point composite (weight × sub-score).
- Cash flow +30.0/30.0
- ARV discount +15.0/15.0
- 1% rule +10.0/10.0
- DSCR +10.0/10.0
- Rent growth +4.4/5.0
- Livability +4.0/5.0
- Condition / age +2.5/5.0
- Schools +2.1/10.0
- Appreciation +0.0/10.0
$84,900
🖨 Deal sheet 📄 Offer letter ✓ Due diligence
Listing remarks
Welcome to this updated 3-bedroom, 1-full-bath home with a detached 2-car garage in Akron. Freshly refreshed throughout, this move-in-ready property offers immediate comfort and modern touches. The entire home features brand-new flooring and fresh interior paint for a clean, bright appearance. With 3 spacious bedrooms and a detached 2-car garage, this home provides practical living in a convenient Akron location. Nothing left to do but move right in! Agent-owned.
Key facts
- 0.25 acre lot
- 2 garage spots
- Built 1928
Neighborhood map
What this means for you Summary
Snapshot
- This is a 3-bed/1.0-bath single-family listed at $85k.
Deal economics
- At list price, monthly cash flow is $410 ($5k/yr) — positive.
- The deal already cash-flows at list — no discount required.
- Meets the 1% rule at list price ($1k rent vs $85k).
- Cap rate 12.1% vs local median 6.6% in Akron — top-decile yield for the area; either an underpriced asset or a hidden risk that comps aren't pricing in. Stress-test before assuming the spread holds.
Location & tenants
- Location reads 81/100 on livability (#104 in OH, #1,591 nationally) — a professional / high-income tenant draw. Strengths: amenities A+, commute A+, cost of living A+; Watch: crime F, employment F.
- Akron City (urban): math 22% / reading 30% proficiency, ranked #602 of 656 in OH (top 92%) — low school quality limits family demand, transient renter base, plan for 1-2y turnover; 66% free/reduced lunch — lower-income household profile, screen leases tightly.
- Market conditions: Rents rising fast (+7.6%/yr); 69 active listings in the ZIP; 30 comparable units currently listed for rent nearby; rentals lingering (median 44d on market — plan ~5-8 weeks vacancy on turnover, expect pricing pressure); 50% of comp listings sitting > 30 days — soft ceiling on asking rent; lower-income renter base — watch delinquency; 1,114 units permitted in Summit County in 2024 (397 in 5+ unit buildings).
- This rent runs 38% of the median local income ($42k/yr) — at the standard rent-burdened threshold; future hikes will face affordability resistance.
Forward outlook
- Local home prices are declining (-3.0%/yr); year-one equity from $587 of loan paydown is wiped out by about $3k of value loss. Plan a longer hold.
- Summit County population projected to shrink 6% by 2050 — rents likely to lag national; underwrite the cash flow, not the appreciation.
- At projected returns (-3.0% appreciation + 7.6% rent growth), your $24k cash investment doubles in ~5 years — after that, you're playing with house money.
Negotiation context
- Only 8 days on market — expect competitive offers; lowballing is unlikely to land.
- Current owner paid $45k; list at $85k implies a 89% gain — meaningful room to come down on a strong offer.
Risks & watch-outs
- Watch-outs: built in 1928 — expect roof / HVAC / electrical / plumbing capex.
Questions for the listing agent
- Built in 1928 — when were the roof, HVAC, electrical panel, plumbing, and water heater last replaced?
- Is there a deadline driving the sale (1031 exchange, divorce, estate, relocation)? That informs how much negotiation room exists.
- Crime grade is F in this area — have there been break-ins, vandalism, or insurance claims at this property in the last 3 years? What carrier currently insures it and at what premium?
- What's the average days-on-market for RENTAL listings here right now (not sales)? A rising rental-DOM trend means longer vacancies and softer asking-rent achievability than the comps imply.
- What's the recent tenant-quality profile in this submarket — average credit score on applications, eviction rate, late-payment / NSF rate, and stable-employment percentage? A property-management company in the area should have these aggregated.
- How much new for-sale + rental construction is in the pipeline within 1–3 miles? Heavy new supply typically softens prices + rents 12–24 months out; constrained supply supports both.
Investment metrics
- 1% rule
- 1.55% ✓
- Cap rate
- 12.09%
- Cash-on-cash
- 20.69%
- DSCR
- 1.92
- GRM
- 5.4
CMA / ARV
- ARV (on-the-fly)
- $108,537
- Comps found
- 12
Show comp detail 12 sales within ~0.75 mi
| Address | Dist | Beds/Ba | Sqft | Sold | Price | $/sf | Match |
|---|---|---|---|---|---|---|---|
| 632 Roscoe Ave | 0.24mi | 3/1.0 | 1,483 (-6%) | 2mo | $85,000 | $57 | 78 |
| 1098 Wyley Ave | 0.26mi | 3/1.0 | 1,480 (-6%) | 11mo | $75,000 | $51 | 69 |
| 450 Lucy St | 0.60mi | 4/1.5 (+1) | 1,552 (-1%) | 11mo | $74,500 | $48 | 54 |
| 1122 Delos St | 0.27mi | 3/2.0 | 1,364 (-13%) | 9mo | $230,000 | $169 | 54 |
| 244 Kelly Ave | 0.49mi | 3/1.5 | 1,692 (+8%) | 16mo | $99,000 | $59 | 49 |
| 941 Hunt St | 0.46mi | 4/2.0 (+1) | 1,761 (+12%) | 2mo | $154,000 | $87 | 48 |
| 897 Davies Ave | 0.62mi | 4/3.0 (+1) | 1,500 (-5%) | 4mo | $89,000 | $59 | 47 |
| 522 Winans Ave | 0.73mi | 3/1.0 | 1,373 (-13%) | 5mo | $95,000 | $69 | 41 |
| 900 Ardella Ave | 0.58mi | 3/2.0 | 1,404 (-11%) | 13mo | $76,600 | $55 | 41 |
| 1172 5th Ave | 0.69mi | 4/2.5 (+1) | 1,428 (-9%) | 1mo | $233,000 | $163 | 40 |
| 455 Talbot Ave | 0.68mi | 3/1.0 | 1,373 (-13%) | 11mo | $105,000 | $76 | 38 |
| 820 Ravenswood St | 0.49mi | 4/1.5 (+1) | 1,360 (-14%) | 16mo | $128,000 | $94 | 34 |
Match score weights: distance 35% · size 25% · config 20% · recency 20%. Top-matched comps best support the ARV.
Projected returns pro-forma
-3.0% appreciation · 7.63% rent growth · sell at horizon
- IRR
- 18.4%
- Equity multiple
- 1.79×
- Total profit
- $18,813
- Equity at exit
- $12,659
- IRR
- 30.0%
- Equity multiple
- 4.33×
- Total profit
- $79,175
- Equity at exit
- $7,341
Cash invested: $23,772 (down + closing). Projections, not guarantees.
Landlord ↔ Tenant lean methodology
- Overall (STATE)
- 73 Landlord-Friendly
- State Ohio
- 73 Landlord-Friendly · R+6
- County
- — inherits STATE
- City
- — inherits STATE
ZIP-level market 44306
- Rents YoY
- 7.6%
- Active inventory
- 69
- Price-to-rent
- 5.4×
Monthly cashflow live
- Estimated rent
- $1,317 high interval (Pro) →
- Mortgage (P&I)
- −$445
- Tax from tax record
- −$150 /mo · $1,795/yr
- Insurance
- −$35
- HOA
- −$0
- Vacancy / Maint / Mgmt
- −$276
- Net cashflow
- $410
Break-even live
UW: 25.0% down · 7.5% · 30yr · 1.5% tax · 5.0% vac · 8.0% maint · 8.0% mgmt
Financing live
Cash to close
- Down payment
- $21,225
- Closing costs
- $2,547
- Reserves months
- —
- Total cash needed
- —
Loan-product check · same deal, 3 products live
Conventional
25% down · 7.5% · 30yr
- Down + closing
- —
- Monthly P&I
- —
- Monthly cashflow
- —
- DSCR
- —
- Eligible?
- —
Personal DTI + credit; lowest rate.
DSCR
20% down · 8.5% · 30yr
- Down + closing
- —
- Monthly P&I
- —
- Monthly cashflow
- —
- DSCR
- —
- Eligible?
- —
No personal income docs; deal must DSCR.
Hard money
10% down · 12.0% · 12mo
- Down + closing
- —
- Monthly P&I
- —
- Monthly cashflow
- —
- DSCR
- —
- Eligible?
- —
Short-term bridge; refi at stabilization.
Rent comps 30 comps
| Address | Beds | Baths | Sqft | Rent | $/sqft | DOM | Units | Dist |
|---|---|---|---|---|---|---|---|---|
| 1280 7th Ave Akron, OH | 2.0 | 1.0 | 1152 | $1,200 | $1.04 | 14d | 1 | 0.45mi |
| 1125 Georgia Ave Akron, OH | 3.0 | 1.0 | 1060 | $1,300 | $1.23 | 14d | 1 | 0.51mi |
| 497 Lucy St Akron, OH | 4.0 | 1.0 | 1600 | $1,500 | $0.94 | 43d | 1 | 0.54mi |
| 488 Alexander St Akron, OH | 4.0 | 2.0 | 1311 | $1,350 | $1.03 | 23d | 1 | 0.61mi |
| 990 Baird St Akron, OH | 3.0 | 1.0 | 1140 | $1,250 | $1.10 | 43d | 1 | 0.63mi |
| 516 Whitney Ave Akron, OH | 4.0 | 2.0 | 1676 | $1,500 | $0.89 | 43d | 1 | 0.67mi |
| 1182 5th Ave Akron, OH | 3.0 | 1.0 | 1248 | $1,250 | $1.00 | 14d | 1 | 0.72mi |
| 1070 Super Genius Cir Akron, OH | 2.0–4.0 | 1.0–2.0 | 1145 | $1,174 | $1.03 | 14d | 1 | 0.78mi |
| 377 Talbot Ave Akron, OH | 2.0 | 1.0 | 1070 | $1,050 | $0.98 | 43d | 1 | 0.84mi |
| 1204 Inman St Akron, OH | 3.0 | 1.0 | 1080 | $1,200 | $1.11 | 23d | 1 | 0.88mi |
| 1125 2nd Ave Akron, OH | 3.0 | 1.0 | 1373 | $1,100 | $0.80 | 23d | 1 | 0.93mi |
| 1076 Ackley St Akron, OH | 4.0 | 2.0 | 1998 | $2,000 | $1.00 | 14d | 1 | 1.12mi |
| 1071 Ackley St Akron, OH | 4.0 | 2.0 | 1164 | $1,175 | $1.01 | 43d | 1 | 1.14mi |
| 979 Neptune Ave Akron, OH | 3.0 | 1.0 | 1248 | $1,250 | $1.00 | 23d | 1 | 1.15mi |
| 1040 Neptune Ave Akron, OH | 4.0 | 1.0 | 1400 | $1,300 | $0.93 | 43d | 1 | 1.16mi |
| 1085 Herberich Ave Akron, OH | 4.0 | 1.0 | 1350 | $1,400 | $1.04 | 43d | 1 | 1.19mi |
| 1114 Herberich Ave Akron, OH | 4.0 | 1.0 | 1308 | $1,200 | $0.92 | 43d | 1 | 1.21mi |
| 1428 Sara Ave Akron, OH | 2.0 | 1.0 | 1080 | $1,050 | $0.97 | 14d | 1 | 1.28mi |
| 987 Boone St Akron, OH | 3.0 | 1.0 | 1248 | $1,100 | $0.88 | 23d | 1 | 1.31mi |
| 1012 Brown St Akron, OH | 4.0 | 2.0 | 1518 | $1,295 | $0.85 | 43d | 1 | 1.34mi |
| 1297 Pondview Ave Akron, OH | 4.0 | 1.0 | 1373 | $1,450 | $1.06 | 23d | 1 | 1.35mi |
| 435 Margaret St Akron, OH | 4.0 | 2.0 | 1900 | $1,450 | $0.76 | 43d | 1 | 1.37mi |
| 885 Brown St Akron, OH | 4.0 | 2.0 | 1280 | $1,400 | $1.09 | 23d | 1 | 1.37mi |
| 466 Adkins Ave Akron, OH | 4.0 | 1.5 | 1800 | $1,450 | $0.81 | 43d | 1 | 1.42mi |
| 1028 Kling St Akron, OH | 4.0 | 2.0 | 1500 | $1,450 | $0.97 | 43d | 1 | 1.44mi |
| 450 Stanton Ave Akron, OH | 3.0 | 2.0 | 1927 | $1,425 | $0.74 | 43d | 1 | 1.45mi |
| 907 Kling St Akron, OH | 3.0 | 1.0 | 1248 | $1,250 | $1.00 | 14d | 1 | 1.45mi |
| 432 N Firestone Blvd Unit 1496097P Akron, OH | 4.0 | 2.0 | 1926 | $6,253 | $3.25 | 21d | 1 | 1.45mi |
| 796 Brown St Akron, OH | 4.0 | 2.0 | 1200 | $900 | $0.75 | 43d | 1 | 1.46mi |
| 1395 Goodyear Blvd Akron, OH | 3.0 | 1.5 | 1542 | $1,450 | $0.94 | 43d | 1 | 1.47mi |
Listing history 4 events
-
2026-04-20status Pending
-
2026-04-12$84,900 Active
-
2025-09-22soldstatus $45,000
-
2009-04-09soldstatus $22,240
ⓘ Source: listings_history table (triggers on properties + properties_extension) + one-shot
backfill from property_details.listing_events for pre-trigger history.
Tax reassessment forecast OH · Partial reset (capped growth)
- Current annual tax
- $1,795 · $150/mo
- Projected year-2 tax
- $1,795 · $150/mo
- Expected delta
- $0/yr ($0/mo · 0.0%)
ⓘ Screening estimate from a state-policy table — verify with the county assessor before closing.
Climate risk First Street
- Flood 1/10 Low FEMA zone X (unshaded) · 0% chance over 30 yrs
- Wildfire 1/10 Low
- Heat 3/10 Moderate 7 d/yr ≥96°F today · 17 d/yr by 30 yrs out
- Wind 1/10 Low
- Air quality 3/10 Moderate 2 unhealthy d/yr today · 4 by 30 yrs out
Nearby sold comps map
Loading sold comps map…
Walkable amenities ~0.75 mi
Loading nearby amenities…
Taxation est. · year 1
- Rental income
- $15,798
- − Mortgage interest
- −$4,756
- − Property taxes
- −$1,795
- − Insurance
- −$424
- − Repairs & maintenance
- −$1,264
- − Management
- −$1,264
- − Depreciation
- −$2,470
- Taxable income
- $3,826
- Est. tax owed @ 24.0%
- −$918
- After-tax cash flow
- $4,000/yr
For passive investors: Depreciation is non-cash, so a rental often shows a tax loss while cash-flowing — sheltering income. Rental losses are passive: they offset passive income freely, and up to $25,000/yr can offset ordinary (W-2) income if you actively participate and your MAGI is under $100k (phasing out to $0 by $150k); unused losses carry forward. On sale, claimed depreciation is recaptured at up to 25%, and gains may owe capital-gains tax (a 1031 exchange can defer both). Figures are a year-1 estimate at your 24.0% rate — not tax advice; consult a CPA.
Schools (NCES district)
- District
- Akron City
- NCES district ID
- 3904348
- Math proficiency
- 22% ▼ -17.00%
- Reading proficiency
- 30% ▼ -12.00%
- Median HH income
- $33,811
- Composite
- 21.31/100
- National rank
- #8383
- State rank
- #602 of 656 in OH
Livability — Akron
- Score
- 81/100
- State rank
- #104
- US rank
- #1591
Category grades
Schools grade is shown separately in the Schools card above.
Census & demographics
- Census place
- Akron, OH
- County
- Summit County · 440,783 people
- City population
- 174,375
- Metro
- Akron, OH
- Population (ZIP)
- 20,905
- Household income
- $41,688
- Rent vs Own
- Severe rent burden
- 1251.0
Population outlook (Summit County) Hauer SSP2
- Today (2025)
- 546,583 people
- By 2030
- 544,028 · -0.5%
- By 2040
- 531,363 · -2.8%
- By 2050
- 514,923 · -5.8%
- By 2075
- 481,765 · -11.9%
- By 2100
- 432,265 · -20.9%
Race, ethnicity, and origin ACS 2023
- Neighborhood character
- Diverse neighborhood (Simpson 0.62)
- Race & ethnicity
- White 48% Black 38% Two or more races 8% Hispanic / Latino 3% Asian 2%
- Common ancestry
- Lithuanian 2% Iranian 1% Scotch-Irish 1%
- Foreign-born
- 4% · Vietnam, Canada, Philippines
- Languages at home
- 94% English-only · Spanish 2% Other Asian/Pacific 1% Vietnamese 1%
Political lean MEDSL · Summit
- 2024 margin
- Lean D (+7.0) · D 53.0% · R 46.0%
- 2008→2024 swing
- -9.6pp toward R · 2008: 16.6pp · 2024: 7.0pp
- All cycles
- 2024: D+7.0 2020: D+9.6 2016: D+8.2 2012: D+14.8 2008: D+16.6
Not yet ingested
- Civics
- —
Market trends
- HPI YoY
- ▼ -101.46%
- Current HPI
- 132.768
- Rent YoY
- ▲ 7.63%
- Metro
- Akron, OH
- State GDP YoY
- ▲ 1.98%
- F500 in state
- 48
Industry mix (Fortune 500 HQ in OH)
| Industry | F500 HQs | Revenue |
|---|---|---|
| Insurance | 3 | $145B |
|
||
| Industrial Machinery | 3 | $49B |
|
||
| Financial Services | 3 | $24B |
|
||
| Consumer Goods | 2 | $93B |
|
||
| Aerospace / Defense | 2 | $47B |
|
||
| Utilities | 2 | $33B |
|
||
Price history
+281.7% since first listed4 events — show timeline
- 2026-04-20 Pending — MLSNOW
- 2026-04-12 Listed $84,900 MLSNOW
- 2025-09-22 Sold (Public Records) $45,000 Public Records
- 2009-04-09 Sold (Public Records) $22,240 Public Records
Property tax history
+8.8%/yrLatest (2025): $1,795 · +51.6% YoY. Source: county tax records.
Cash-flow waterfall
monthlySold comps — $/sqft
last 12 mo · ≤1 miLoading sold comps…