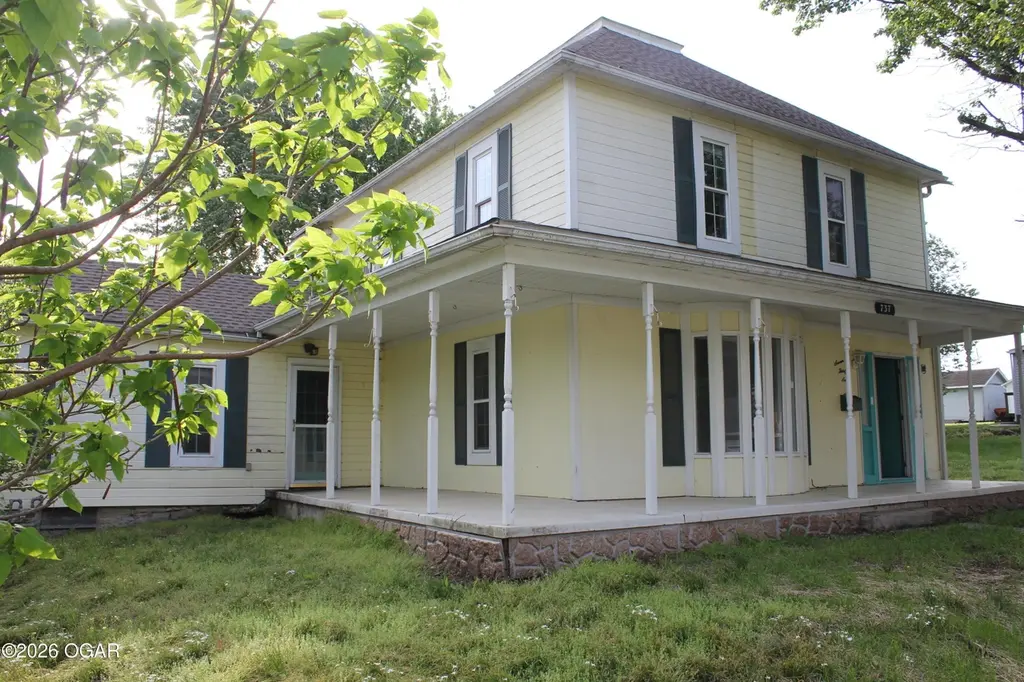
737 Prospect St · Webb City, MO
Flood risk 1/10 · Minimal
- FEMA flood zone
- X (unshaded)
- Chance of flooding over 30 yrs
- 0.0%
- Est. flood insurance / yr
- $473 – $860
Fire risk 4/10 · Minor
- Est. fire insurance / yr
- $1,054 – $1,958
Heat risk 5/10 · Moderate
- Hot days now (above 107°F)
- 7 days/yr
- Hot days in 30 yrs
- 20 days/yr
Wind risk 2/10 · Minimal
- Chance of severe wind over 30 yrs
- 2.0%
Air-quality risk 2/10 · Minimal
- Unhealthy air days now
- 1 days/yr
- Unhealthy air days in 30 yrs
- 1 days/yr
Risk factors via First Street. Map © Google.
Why this score? — see what drove the C+ grade
The composite is a weighted blend of 9 inputs, each scored 0–100. Each bar is that input's sub-score; the figure is the points it added to the 100-point composite (weight × sub-score).
- Cash flow +20.9/30.0
- ARV discount +15.0/15.0
- DSCR +6.6/10.0
- Schools +4.8/10.0
- 1% rule +4.6/10.0
- Livability +3.9/5.0
- Rent growth +3.1/5.0
- Condition / age +2.5/5.0
- Appreciation +0.0/10.0
$158,240
🖨 Deal sheet 📄 Offer letter ✓ Due diligence
Listing remarks MLS
Spacious three bedroom two bath home offering over 2600 Sq. ft of living. Two living areas on main floor, bonus room on the third floor. Formal dinning and sun room as well! Character and charm all the way around!!! Beautiful wrap around porch, privacy wood fenced back yard, and a detached garage. Call to see today!!!
Key facts
- Wrap around porch
- Bonus room
- Two living areas
Tags
Neighborhood map
What this means for you Summary
Snapshot
- This is a 3-bed/2.0-bath other listed at $158k.
Deal economics
- At list price, monthly cash flow is $220 ($3k/yr) — positive.
- The deal already cash-flows at list — no discount required.
- To meet the 1% rule (rent ≥ 1% of price), the offer needs to be $152k (3.7% below list).
- Recommended offer: $149k (6.0% below list) — sets the bar for market timing.
Location & tenants
- Location reads 77/100 on livability (#35 in MO, #3,062 nationally) — a middle-class / working-renter tenant base. Strengths: cost of living A+, housing A+, health & safety A+; Watch: employment C-, amenities D-, commute F.
- Webb City R-VII (suburban): math 53% / reading 60% proficiency, ranked #21 of 324 in MO (top 6%) — acceptable for families but not a draw, mixed tenant base, ~2y average lease.
- Market conditions: Rents rising (+2.5%/yr); 122 active listings in the ZIP; 602 units permitted in Jasper County in 2024 (0 in 5+ unit buildings).
Forward outlook
- Local home prices are declining (-3.0%/yr); year-one equity from $1k of loan paydown is wiped out by about $5k of value loss. Plan a longer hold.
Negotiation context
- It's been on market 65 days — a 6% lower offer ($149k) is reasonable based on typical stale-listing flexibility.
- 6 sale attempts since 8y ago; this cycle's ask has dropped $14k (8%) from the opening price — seller is motivated, your offer sets the floor, not the list.
Risks & watch-outs
- Watch-outs: built in 1890 — expect roof / HVAC / electrical / plumbing capex.
- Climate carrying-cost: extreme-heat days projected 7→20/yr by 2055 (HVAC capex compounding) — expect insurance premiums to compound above CPI over the hold.
Questions for the listing agent
- It's been on market 65 days. Have you received any prior offers? Is the seller open to a 6% concession, seller financing, or rate buy-down credit?
- Built in 1890 — when were the roof, HVAC, electrical panel, plumbing, and water heater last replaced?
- Why hasn't it sold? Are there any deal-killer items the seller is aware of (foundation, flood, title, zoning, code violations)?
- Is there a deadline driving the sale (1031 exchange, divorce, estate, relocation)? That informs how much negotiation room exists.
- Schools are B-rated — typically a magnet for longer-tenancy family renters. What's the average tenant stay here, and is there a school-zone premium baked into asking?
- What's the average days-on-market for RENTAL listings here right now (not sales)? A rising rental-DOM trend means longer vacancies and softer asking-rent achievability than the comps imply.
- What's the recent tenant-quality profile in this submarket — average credit score on applications, eviction rate, late-payment / NSF rate, and stable-employment percentage? A property-management company in the area should have these aggregated.
- How much new for-sale + rental construction is in the pipeline within 1–3 miles? Heavy new supply typically softens prices + rents 12–24 months out; constrained supply supports both.
Investment metrics
- 1% rule
- 0.96% ✗
- Cap rate
- 7.96%
- Cash-on-cash
- 5.95%
- DSCR
- 1.26
- GRM
- 8.7
CMA / ARV
- ARV (median comp)
- $307,071
- List price
- $158,240
- Delta
- -48.47%
- Verdict
- UNDERPRICED
- Comps
- 8 within 1.0 mi
Projected returns pro-forma
-3.0% appreciation · 2.49% rent growth · sell at horizon
- IRR
- -7.7%
- Equity multiple
- 0.72×
- Total profit
- $-12,483
- Equity at exit
- $23,594
- IRR
- 1.2%
- Equity multiple
- 1.09×
- Total profit
- $3,793
- Equity at exit
- $13,682
Cash invested: $44,307 (down + closing). Projections, not guarantees.
Landlord ↔ Tenant lean methodology
- Overall (STATE)
- 81 Strongly Landlord-Friendly
- State Missouri
- 81 Strongly Landlord-Friendly · R+10
- County
- — inherits STATE
- City
- — inherits STATE
ZIP-level market 64870
- Home prices YoY
- -8.3%
- Rents YoY
- 2.5%
- Active inventory
- 122
- Price-to-rent
- 8.7×
Monthly cashflow live
- Estimated rent
- $1,523 medium interval (Pro) →
- Mortgage (P&I)
- −$830
- Tax from tax record
- −$88 /mo · $1,059/yr
- Insurance
- −$66
- HOA
- −$0
- Vacancy / Maint / Mgmt
- −$320
- Net cashflow
- $220
Break-even live
UW: 25.0% down · 7.5% · 30yr · 1.5% tax · 5.0% vac · 8.0% maint · 8.0% mgmt
Financing live
Cash to close
- Down payment
- $39,560
- Closing costs
- $4,747
- Reserves months
- —
- Total cash needed
- —
Loan-product check · same deal, 3 products live
Conventional
25% down · 7.5% · 30yr
- Down + closing
- —
- Monthly P&I
- —
- Monthly cashflow
- —
- DSCR
- —
- Eligible?
- —
Personal DTI + credit; lowest rate.
DSCR
20% down · 8.5% · 30yr
- Down + closing
- —
- Monthly P&I
- —
- Monthly cashflow
- —
- DSCR
- —
- Eligible?
- —
No personal income docs; deal must DSCR.
Hard money
10% down · 12.0% · 12mo
- Down + closing
- —
- Monthly P&I
- —
- Monthly cashflow
- —
- DSCR
- —
- Eligible?
- —
Short-term bridge; refi at stabilization.
Listing history 34 events
-
2026-06-19days on market $158,240 Active 65 DOM
-
2026-06-18days on market $158,240 Active 64 DOM
-
2026-06-17days on market $158,240 Active 63 DOM
-
2026-06-16days on market $158,240 Active 62 DOM
-
2026-06-15days on market $158,240 Active 61 DOM
-
2026-06-14days on market $158,240 Active 59 DOM
-
2026-06-13days on market $158,240 Active 58 DOM
-
2026-06-10days on market $158,240 Active 56 DOM
-
2026-06-09days on market $158,240 Active 55 DOM
-
2026-06-08days on market $158,240 Active 54 DOM
-
2026-06-07days on market $158,240 Active 53 DOM
-
2026-06-05days on market $158,240 Active 50 DOM
-
2026-06-03price $158,240 Active 48 DOM
-
2026-06-02days on market $172,000 Active 48 DOM
-
2026-06-01days on market $172,000 Active 47 DOM
-
2026-05-31days on market $172,000 Active 46 DOM
-
2026-05-30days on market $172,000 Active 45 DOM
-
2026-04-15$172,000 Active 319-char remark
Show marketing remark (319 chars)
Spacious three bedroom two bath home offering over 2600 Sq. ft of living. Two living areas on main floor, bonus room on the third floor. Formal dinning and sun room as well! Character and charm all the way around!!! Beautiful wrap around porch, privacy wood fenced back yard, and a detached garage. Call to see today!!!
-
2024-07-16price $199,900
-
2023-11-22price $205,000
-
2023-09-13price $225,000
-
2023-09-12price $225,000
-
2023-08-11status Active
-
2023-08-11price $239,000
-
2023-08-11price $239,000
-
2023-08-05historical
-
2023-08-02$265,000 Active
-
2021-10-12soldstatus
-
2021-10-05soldstatus
-
2021-08-10$184,500
-
2018-10-31$114,900
-
2018-10-30$114,900
-
2008-07-23soldstatus
-
2005-04-01soldstatus
ⓘ Source: listings_history table (triggers on properties + properties_extension) + one-shot
backfill from property_details.listing_events for pre-trigger history.
Tax reassessment forecast MO · Resets to sale price
- Current annual tax
- $1,059 · $88/mo
- Projected year-2 tax
- $1,535 · $128/mo
- Expected delta
- +$476/yr (+$40/mo · 44.9%)
ⓘ Screening estimate from a state-policy table — verify with the county assessor before closing.
Climate risk First Street
- Flood 1/10 Low FEMA zone X (unshaded) · 0% chance over 30 yrs
- Wildfire 4/10 Moderate
- Heat 5/10 Major 7 d/yr ≥107°F today · 20 d/yr by 30 yrs out
- Wind 2/10 Low 2% chance of damaging wind over 30 yrs
- Air quality 2/10 Low 1 unhealthy d/yr today · 1 by 30 yrs out
Nearby sold comps map
Loading sold comps map…
Walkable amenities ~0.75 mi
Loading nearby amenities…
Taxation est. · year 1
- Rental income
- $18,282
- − Mortgage interest
- −$8,864
- − Property taxes
- −$1,059
- − Insurance
- −$791
- − Repairs & maintenance
- −$1,463
- − Management
- −$1,463
- − Depreciation
- −$4,603
- Taxable income
- $39
- Est. tax owed @ 24.0%
- −$9
- After-tax cash flow
- $2,625/yr
For passive investors: Depreciation is non-cash, so a rental often shows a tax loss while cash-flowing — sheltering income. Rental losses are passive: they offset passive income freely, and up to $25,000/yr can offset ordinary (W-2) income if you actively participate and your MAGI is under $100k (phasing out to $0 by $150k); unused losses carry forward. On sale, claimed depreciation is recaptured at up to 25%, and gains may owe capital-gains tax (a 1031 exchange can defer both). Figures are a year-1 estimate at your 24.0% rate — not tax advice; consult a CPA.
Schools (NCES district)
- District
- Webb City R-VII
- NCES district ID
- 2931500
- Math proficiency
- 53% ▼ -1.00%
- Reading proficiency
- 60% ▼ -1.00%
- Median HH income
- $45,022
- Composite
- 47.68/100
- National rank
- #2244
- State rank
- #21 of 324 in MO
Livability — Webb City
- Score
- 77/100
- State rank
- #35
- US rank
- #3062
Category grades
Schools grade is shown separately in the Schools card above.
Census & demographics
- Census place
- Webb City, MO
- County
- Jasper County · 79,035 people
- City population
- 16,186
- Metro
- Joplin, MO
- Population (ZIP)
- 16,186
- Household income
- $68,300
- Rent vs Own
- Severe rent burden
- 427.0
Population outlook (Jasper County) Hauer SSP2
- Today (2025)
- 120,033 people
- By 2030
- 120,091 · +0.0%
- By 2040
- 119,297 · -0.6%
- By 2050
- 117,705 · -1.9%
- By 2075
- 110,402 · -8.0%
- By 2100
- 99,719 · -16.9%
Race, ethnicity, and origin ACS 2023
- Neighborhood character
- Predominantly White (86%)
- Race & ethnicity
- White 86% Two or more races 8% Hispanic / Latino 4% Asian 2% Black 2%
- Common ancestry
- Lithuanian 2% Slovak 2% Italian 2%
- Foreign-born
- 2% · Canada, China
- Languages at home
- 98% English-only · Spanish 1%
Political lean MEDSL · Jasper
- 2024 margin
- Solid R (+46.8) · D 25.9% · R 72.7% · Other 1.4%
- 2008→2024 swing
- -13.6pp toward R · 2008: -33.2pp · 2024: -46.8pp
- All cycles
- 2024: R+46.8 2020: R+46.2 2016: R+50.8 2012: R+41.0 2008: R+33.2
Not yet ingested
- Civics
- —
Market trends
- HPI YoY
- ▼ -24.29%
- Current HPI
- 267.5318
- Rent YoY
- ▲ 2.49%
- Metro
- Joplin, MO
- State GDP YoY
- ▲ 1.84%
- F500 in state
- 20
Industry mix (Fortune 500 HQ in MO)
| Industry | F500 HQs | Revenue |
|---|---|---|
| Healthcare | 1 | $163B |
|
||
| Insurance | 1 | $21B |
|
||
| Industrial Technology | 1 | $17B |
|
||
| Retail | 1 | $16B |
|
||
| Industrial Distribution | 1 | $10B |
|
||
| Utilities | 1 | $9B |
|
||
Price history
+49.7% since first listed17 events — show timeline
- 2026-04-15 Listed $172,000 OGAR
- 2024-07-16 Price Changed $199,900 OGAR
- 2023-11-22 Price Changed $205,000 OGAR
- 2023-09-13 Price Changed $225,000 SOMO
- 2023-09-12 Price Changed $225,000 OGAR
- 2023-08-11 Relisted — SOMO
- 2023-08-11 Price Changed $239,000 SOMO
- 2023-08-11 Price Changed $239,000 OGAR
- 2023-08-05 Delisted — SOMO
- 2023-08-02 Listed $265,000 SOMO
- 2021-10-12 Sold (Public Records) — Public Records
- 2021-10-05 Sold (MLS) — OGAR
- 2021-08-10 Listed $184,500 OGAR
- 2018-10-31 Listed $114,900 SOMO
- 2018-10-30 Listed $114,900 OGAR
- 2008-07-23 Sold (Public Records) — Public Records
- 2005-04-01 Sold (Public Records) — Public Records
Property tax history
+2.0%/yrLatest (2025): $1,059 · +11.8% YoY. Source: county tax records.
Cash-flow waterfall
monthlySold comps — $/sqft
last 12 mo · ≤1 miLoading sold comps…