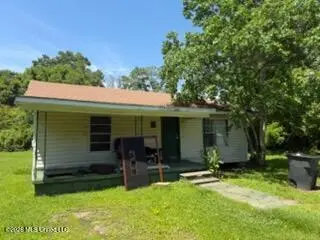
1115 Krebs · Pascagoula, MS
Flood risk 6/10 · Moderate
- FEMA flood zone
- X (shaded)
- Chance of flooding over 30 yrs
- 0.53%
- Est. flood insurance / yr
- $507 – $1,088
Fire risk 2/10 · Minimal
- Est. fire insurance / yr
- $1,241 – $2,305
Heat risk 10/10 · Severe
- Hot days now (above 105°F)
- 7 days/yr
- Hot days in 30 yrs
- 23 days/yr
Wind risk 9/10 · Severe
- Chance of severe wind over 30 yrs
- 99.0%
Air-quality risk 2/10 · Minimal
- Unhealthy air days now
- 1 days/yr
- Unhealthy air days in 30 yrs
- 2 days/yr
Risk factors via First Street. Map © Google.
Why this score? — see what drove the B- grade
The composite is a weighted blend of 9 inputs, each scored 0–100. Each bar is that input's sub-score; the figure is the points it added to the 100-point composite (weight × sub-score).
- Cash flow +30.0/30.0
- 1% rule +10.0/10.0
- DSCR +10.0/10.0
- ARV discount +7.5/15.0
- Livability +3.5/5.0
- Schools +3.3/10.0
- Rent growth +2.5/5.0
- Condition / age +2.5/5.0
- Appreciation +0.0/10.0
$39,500
🖨 Deal sheet (PDF) 📄 Offer letter ✓ Due diligence
Listing remarks
This 3-bedroom, 1-bath property in Pascagoula presents a prime opportunity for investors and renovators looking for their next project. Sold strictly as-is, this home is priced to reflect its condition and is ready for the right buyer to come in and unlock its potential. Bring your vision and your contractor — this one is waiting on you.
Key facts
- 6,098 sq ft lot
- Built 1976
- Listed 15 days
Property features AI
Finance
- Other: Lot approximately 0.14 acre (about 6,098 sq ft)
Exterior
- Parking: Unpaved parking
- Utilities: Electricity available; Water available (source listed as Other); Sewer available (listed as Other)
- Home design: Single-family residence; Modular home; One level; Raised entry/foundation
- Construction: Siding construction; Composition roof; Built in (year source: Public Records)
- Exterior features: City lot
Interior
- Bathrooms: 1 full bathroom
- Heating & cooling: Heating present (type: Other); Cooling present (type: Other)
- Interior features: Front porch
Neighborhood map
What this means for you Summary
Snapshot
- This is a 3-bed/1.0-bath single-family listed at $40k.
Deal economics
- At list price, monthly cash flow is $912 ($11k/yr) — positive.
- The deal already cash-flows at list — no discount required.
- Meets the 1% rule at list price ($1k rent vs $40k).
- Recommended offer: $39k (1.5% below list) — sets the bar for market timing.
- Cap rate 34.0% vs local median 4.2% in Pascagoula — top-decile yield for the area; either an underpriced asset or a hidden risk that comps aren't pricing in. Stress-test before assuming the spread holds.
Location & tenants
- Location reads 70/100 on livability (#41 in MS) — a middle-class / working-renter tenant base. Strengths: cost of living A+, housing A+, health & safety A+; Watch: crime F, amenities D-, commute F.
- Pascagoula-Gautier School District (urban): math 40% / reading 38% proficiency, ranked #41 of 130 in MS (top 32%) — families likely to look elsewhere, expect single-tenant / working-renter base with shorter leases; 78% free/reduced lunch — lower-income household profile, screen leases tightly.
- Market conditions: 85 active listings in the ZIP; 5 comparable units currently listed for rent nearby; rentals at typical pace (median 15d on market — plan ~3-4 weeks tenant-placement turnaround); 516 units permitted in Jackson County in 2024 (6 in 5+ unit buildings).
Forward outlook
- Local home prices are declining (-3.0%/yr); year-one equity from $273 of loan paydown is wiped out by about $1k of value loss. Plan a longer hold.
- At projected returns (-3.0% appreciation + 3.0% rent growth), your $11k cash investment doubles in ~2 years — after that, you're playing with house money.
Negotiation context
- It's been on market 15 days — a 2% lower offer ($39k) is reasonable based on typical stale-listing flexibility.
Risks & watch-outs
- Climate carrying-cost: major flood risk; severe wind risk, 99% chance of damaging wind over 30y; extreme-heat days projected 7→23/yr by 2055 (HVAC capex compounding) — expect insurance premiums to compound above CPI over the hold.
Questions for the listing agent
- Built in 1976 — when were the roof, HVAC, electrical panel, plumbing, and water heater last replaced?
- Is there a deadline driving the sale (1031 exchange, divorce, estate, relocation)? That informs how much negotiation room exists.
- Crime grade is F in this area — have there been break-ins, vandalism, or insurance claims at this property in the last 3 years? What carrier currently insures it and at what premium?
- What's the average days-on-market for RENTAL listings here right now (not sales)? A rising rental-DOM trend means longer vacancies and softer asking-rent achievability than the comps imply.
- What's the recent tenant-quality profile in this submarket — average credit score on applications, eviction rate, late-payment / NSF rate, and stable-employment percentage? A property-management company in the area should have these aggregated.
- How much new for-sale + rental construction is in the pipeline within 1–3 miles? Heavy new supply typically softens prices + rents 12–24 months out; constrained supply supports both.
Investment metrics
- 1% rule
- 3.79% ✓
- Cap rate
- 34.01%
- Cash-on-cash
- 98.99%
- DSCR
- 5.40
- GRM
- 2.2
CMA / ARV
- ARV (on-the-fly)
- $115,200
- Comps found
- 8
Show comp detail 8 sales within ~0.75 mi
| Address | Dist | Beds/Ba | Sqft | Sold | Price | $/sf | Match |
|---|---|---|---|---|---|---|---|
| 1110 Live Oak Ave | 0.08mi | 2/1.0 (-1) | 950 (-1%) | 1mo | $49,900 | $53 | 88 |
| 1317 E Becht Ave | 0.56mi | 3/1.0 | 918 (-4%) | 7mo | $139,900 | $152 | 61 |
| 3908 Pine St | 0.37mi | 3/1.0 | 926 (-4%) | 20mo | $116,000 | $125 | 60 |
| 1211 Tucker Ave | 0.40mi | 2/1.0 (-1) | 868 (-10%) | 2mo | $60,000 | $69 | 59 |
| 802 Dupont Ave | 0.49mi | 3/2.0 | 1,008 (+5%) | 7mo | $134,900 | $134 | 59 |
| 2111 Jackson Ave | 0.67mi | 2/1.0 (-1) | 1,012 (+5%) | 3mo | $60,000 | $59 | 52 |
| 3024 Frederic St | 0.54mi | 2/1.0 (-1) | 939 (-2%) | 22mo | $59,900 | $64 | 48 |
| 2413 8th St | 0.70mi | 2/1.0 (-1) | 1,000 (+4%) | 16mo | $119,900 | $120 | 42 |
Match score weights: distance 35% · size 25% · config 20% · recency 20%. Top-matched comps best support the ARV.
Projected returns pro-forma
-3.0% appreciation · 3.0% rent growth · sell at horizon
- IRR
- —
- Equity multiple
- 5.68×
- Total profit
- $51,729
- Equity at exit
- $5,890
- IRR
- —
- Equity multiple
- 11.85×
- Total profit
- $119,955
- Equity at exit
- $3,415
Cash invested: $11,060 (down + closing). Projections, not guarantees.
Landlord ↔ Tenant lean methodology
- Overall (STATE)
- 90 Strongly Landlord-Friendly
- State Mississippi
- 90 Strongly Landlord-Friendly · R+11
- County
- — inherits STATE
- City
- — inherits STATE
ZIP-level market 39567
- Home prices YoY
- -26.0%
- Active inventory
- 85
- Price-to-rent
- 2.2×
Monthly cashflow live
- Estimated rent
- $1,498 high interval (Pro) →
- Mortgage (P&I)
- −$207
- Tax from tax record
- −$47 /mo · $567/yr
- Insurance
- −$16
- HOA
- −$0
- Vacancy / Maint / Mgmt
- −$315
- Net cashflow
- $912
Break-even live
Sensitivity live
| Price | -10% $935 | -5% $924 | +0% $912 | +5% $901 | +10% $890 |
|---|---|---|---|---|---|
| Rent | -10% $794 | -5% $853 | +0% $912 | +5% $972 | +10% $1,031 |
| Rate | -1.0pp $932 | -0.5pp $922 | base $912 | +0.5pp $902 | +1.0pp $892 |
UW: 25.0% down · 7.5% · 30yr · 1.5% tax · 5.0% vac · 8.0% maint · 8.0% mgmt
Financing live
Cash to close
- Down payment
- $9,875
- Closing costs
- $1,185
- Reserves months
- —
- Total cash needed
- —
Loan-product check · same deal, 3 products live
Conventional
25% down · 7.5% · 30yr
- Down + closing
- —
- Monthly P&I
- —
- Monthly cashflow
- —
- DSCR
- —
- Eligible?
- —
Personal DTI + credit; lowest rate.
DSCR
20% down · 8.5% · 30yr
- Down + closing
- —
- Monthly P&I
- —
- Monthly cashflow
- —
- DSCR
- —
- Eligible?
- —
No personal income docs; deal must DSCR.
Hard money
10% down · 12.0% · 12mo
- Down + closing
- —
- Monthly P&I
- —
- Monthly cashflow
- —
- DSCR
- —
- Eligible?
- —
Short-term bridge; refi at stabilization.
Rent comps 5 comps
| Address | Beds | Baths | Sqft | Rent | $/sqft | DOM | Units | Dist |
|---|---|---|---|---|---|---|---|---|
| 303 Delmas Ave Unit I Pascagoula, MS | 2.0 | 1.0 | 778 | $1,525 | $1.96 | 22d | 1 | 0.49mi |
| 2002 Ducayet St Pascagoula, MS | 3.0 | 2.0 | 1075 | $1,400 | $1.30 | 22d | 1 | 0.78mi |
| 1810 12th St Pascagoula, MS | 2.0 | 1.0 | 925 | $1,100 | $1.19 | 14d | 1 | 1.15mi |
| 3801 Melton Dr Pascagoula, MS | 1.0–3.0 | 1.0–2.0 | 825 | $1,430 | $1.73 | 14d | 43 | 1.31mi |
| 3015 Eden St Pascagoula, MS | 1.0–3.0 | 1.0–1.5 | 875 | $1,430 | $1.63 | 14d | 43 | 1.33mi |
Listing history 11 events
-
2026-06-18days on market $39,500 Active 15 DOM
-
2026-06-17days on market $39,500 Active 14 DOM
-
2026-06-16pricedays on market $39,500 Active 13 DOM
-
2026-06-15days on market $40,000 Active 12 DOM
-
2026-06-14days on market $40,000 Active 10 DOM
-
2026-06-13days on market $40,000 Active 9 DOM
-
2026-06-10days on market $40,000 Active 7 DOM
-
2026-06-09days on market $40,000 Active 6 DOM
-
2026-06-08days on market $40,000 Active 5 DOM
-
2026-06-07remarks 339-char remark
-
2026-06-07$40,000 Active 4 DOM
ⓘ Source: listings_history table (triggers on properties + properties_extension) + one-shot
backfill from property_details.listing_events for pre-trigger history.
Tax reassessment forecast MS · Resets to sale price
- Current annual tax
- $567 · $47/mo
- Projected year-2 tax
- $567 · $47/mo
- Expected delta
- $0/yr ($0/mo · 0.0%)
ⓘ Screening estimate from a state-policy table — verify with the county assessor before closing.
Climate risk First Street
- Flood 6/10 Major FEMA zone X (shaded) · 53% chance over 30 yrs
- Wildfire 2/10 Low
- Heat 10/10 Extreme 7 d/yr ≥105°F today · 23 d/yr by 30 yrs out
- Wind 9/10 Extreme 99% chance of damaging wind over 30 yrs
- Air quality 2/10 Low 1 unhealthy d/yr today · 2 by 30 yrs out
Nearby sold comps map
Loading sold comps map…
Walkable amenities ~0.75 mi
Loading nearby amenities…
Taxation est. · year 1
- Rental income
- $17,973
- − Mortgage interest
- −$2,213
- − Property taxes
- −$567
- − Insurance
- −$198
- − Repairs & maintenance
- −$1,438
- − Management
- −$1,438
- − Depreciation
- −$1,149
- Taxable income
- $10,971
- Est. tax owed @ 24.0%
- −$2,633
- After-tax cash flow
- $8,315/yr
For passive investors: Depreciation is non-cash, so a rental often shows a tax loss while cash-flowing — sheltering income. Rental losses are passive: they offset passive income freely, and up to $25,000/yr can offset ordinary (W-2) income if you actively participate and your MAGI is under $100k (phasing out to $0 by $150k); unused losses carry forward. On sale, claimed depreciation is recaptured at up to 25%, and gains may owe capital-gains tax (a 1031 exchange can defer both). Figures are a year-1 estimate at your 24.0% rate — not tax advice; consult a CPA.
Schools (NCES district)
- District
- Pascagoula-Gautier School District
- NCES district ID
- 2803480
- Math proficiency
- 40% ▼ -3.00%
- Reading proficiency
- 38% ▼ -4.00%
- Median HH income
- $41,392
- Composite
- 32.86/100
- National rank
- #5613
- State rank
- #41 of 130 in MS
Livability — Pascagoula
- Score
- 70/100
- State rank
- #41
- US rank
- #7866
Category grades
Schools grade is shown separately in the Schools card above.
Census & demographics
- Census place
- Pascagoula, MS
- County
- Jackson County · 82,196 people
- City population
- 21,731
- Metro
- Gulfport-Biloxi, MS
- Population (ZIP)
- 10,341
- Household income
- $62,254
- Rent vs Own
- Severe rent burden
- 308.0
Population outlook (Jackson County) Hauer SSP2
- Today (2025)
- 146,926 people
- By 2030
- 148,442 · +1.0%
- By 2040
- 149,631 · +1.8%
- By 2050
- 148,723 · +1.2%
- By 2075
- 147,845 · +0.6%
- By 2100
- 144,510 · -1.6%
Race, ethnicity, and origin ACS 2023
- Neighborhood character
- Diverse neighborhood (Simpson 0.60)
- Race & ethnicity
- White 52% Black 34% Hispanic / Latino 9% Two or more races 6%
- Hispanic origin (detail)
- Mexican 1% Puerto Rican 3% Dominican 3%
- Common ancestry
- Lithuanian 4% Italian 2% Slovak 1%
- Foreign-born
- 2% · Canada, Guatemala
- Languages at home
- 91% English-only · Spanish 9%
Political lean MEDSL · Jackson
- 2024 margin
- Solid R (+39.9) · D 29.5% · R 69.4% · Other 1.1%
- 2008→2024 swing
- -6.4pp toward R · 2008: -33.5pp · 2024: -39.9pp
- All cycles
- 2024: R+39.9 2020: R+34.6 2016: R+39.9 2012: R+36.1 2008: R+33.5
Not yet ingested
- Civics
- —
Market trends
- HPI YoY
- ▼ -57.05%
- Current HPI
- 162.4666
- Rent YoY
- —
- Metro
- Gulfport-Biloxi, MS
- State GDP YoY
- —
- F500 in state
- 0
Price history
1 event — show timeline
- 2026-06-03 Listed $40,000 MLSU
Property tax history
+3.4%/yrLatest (2025): $567 · +11.2% YoY. Source: county tax records.
Cash-flow waterfall
monthlySold comps — $/sqft
last 12 mo · ≤1 miLoading sold comps…