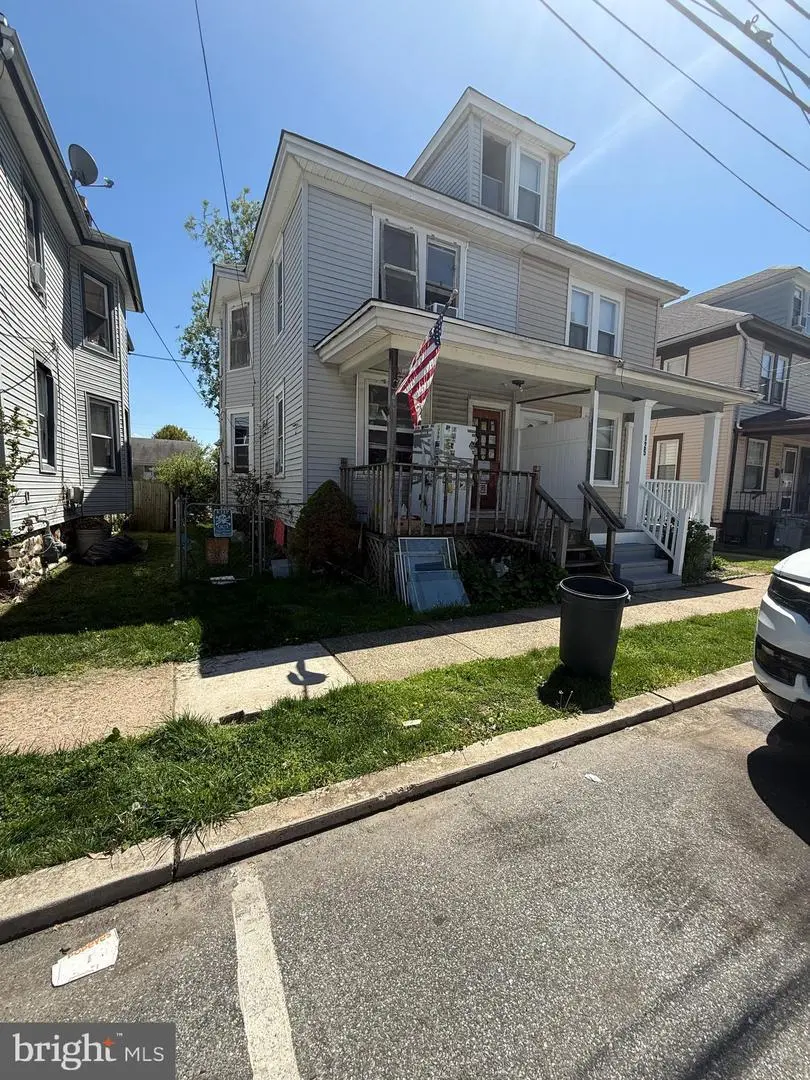
127 White Ave · Linwood, PA
Flood risk 1/10 · Minimal
- FEMA flood zone
- X (unshaded)
- Chance of flooding over 30 yrs
- 0.0%
- Est. flood insurance / yr
- $473 – $860
Fire risk 1/10 · Minimal
- Est. fire insurance / yr
- $511 – $949
Heat risk 7/10 · Major
- Hot days now (above 104°F)
- 7 days/yr
- Hot days in 30 yrs
- 15 days/yr
Wind risk 6/10 · Moderate
- Chance of severe wind over 30 yrs
- 27.0%
Air-quality risk 4/10 · Minor
- Unhealthy air days now
- 4 days/yr
- Unhealthy air days in 30 yrs
- 7 days/yr
Risk factors via First Street. Map © Google.
Why this score? — see what drove the B- grade
The composite is a weighted blend of 9 inputs, each scored 0–100. Each bar is that input's sub-score; the figure is the points it added to the 100-point composite (weight × sub-score).
- Cash flow +30.0/30.0
- 1% rule +10.0/10.0
- DSCR +10.0/10.0
- ARV discount +7.5/15.0
- Livability +4.0/5.0
- Rent growth +3.0/5.0
- Schools +2.7/10.0
- Condition / age +2.5/5.0
- Appreciation +0.0/10.0
$85,000
🖨 Deal sheet (PDF) 📄 Offer letter ✓ Due diligence
Listing remarks
nvestor special! This property is being sold strictly as-is, with the buyer responsible for any and all township requirements, including the U & O. Full rehab needed — ideal opportunity for a fix & flip or long-term rental investment. Strong upside potential for the right buyer willing to bring this property back to life. Cash or rehab financing recommended.
Key facts
- Built 1935
- Listed 7 days
Property features AI
Exterior
- Parking: On-street parking
- Utilities: Public water; Public sewer
- Home design: Semi-detached property; Above-grade finished living area 1,106 (per assessor); Fee simple ownership
- Construction: Vinyl and aluminum siding; Stone foundation
- Exterior features: Lot dimensions approximately 20 x 86
Interior
- Bedrooms: 3 bedrooms on main level
- Bathrooms: 1 full bathroom on main level; 1 full bathroom total
- Heating & cooling: Forced air heating; Oil-fired heating; Electric hot water
- Interior features: Unfinished basement
Neighborhood map
What this means for you Summary
Snapshot
- This is a 3-bed/1.0-bath townhouse listed at $85k.
Deal economics
- At list price, monthly cash flow is $784 ($9k/yr) — positive.
- The deal already cash-flows at list — no discount required.
- Meets the 1% rule at list price ($2k rent vs $85k).
Location & tenants
- Location reads 79/100 on livability (#234 in PA, #2,020 nationally) — a middle-class / working-renter tenant base. Strengths: cost of living A+, housing A+, crime A; Watch: commute D+, amenities F.
- Chichester SD (suburban): math 19% / reading 41% proficiency, ranked #438 of 539 in PA (top 81%) — families likely to look elsewhere, expect single-tenant / working-renter base with shorter leases.
- Market conditions: Rents rising (+1.8%/yr); 68 active listings in the ZIP; 17 comparable units currently listed for rent nearby; rentals at typical pace (median 23d on market — plan ~3-4 weeks tenant-placement turnaround); solid renter incomes; 299 units permitted in Delaware County in 2024 (5 in 5+ unit buildings).
Forward outlook
- Local home prices are declining (-3.0%/yr); year-one equity from $588 of loan paydown is wiped out by about $3k of value loss. Plan a longer hold.
- At projected returns (-3.0% appreciation + 1.8% rent growth), your $24k cash investment doubles in ~4 years — after that, you're playing with house money.
Negotiation context
- Only 7 days on market — expect competitive offers; lowballing is unlikely to land.
Risks & watch-outs
- Watch-outs: built in 1935 — expect roof / HVAC / electrical / plumbing capex.
- Climate carrying-cost: major wind risk, 27% chance of damaging wind over 30y; extreme-heat days projected 7→15/yr by 2055 (HVAC capex compounding) — expect insurance premiums to compound above CPI over the hold.
Questions for the listing agent
- Built in 1935 — when were the roof, HVAC, electrical panel, plumbing, and water heater last replaced?
- Is there a deadline driving the sale (1031 exchange, divorce, estate, relocation)? That informs how much negotiation room exists.
- What's the average days-on-market for RENTAL listings here right now (not sales)? A rising rental-DOM trend means longer vacancies and softer asking-rent achievability than the comps imply.
- What's the recent tenant-quality profile in this submarket — average credit score on applications, eviction rate, late-payment / NSF rate, and stable-employment percentage? A property-management company in the area should have these aggregated.
- How much new for-sale + rental construction is in the pipeline within 1–3 miles? Heavy new supply typically softens prices + rents 12–24 months out; constrained supply supports both.
Investment metrics
- 1% rule
- 2.04% ✓
- Cap rate
- 17.36%
- Cash-on-cash
- 39.53%
- DSCR
- 2.76
- GRM
- 4.1
CMA / ARV
- ARV (median comp)
- $178,444
- List price
- $85,000
- Delta
- -52.37%
- Verdict
- UNDERPRICED
- Comps
- 20 within 1.0 mi
Show comp detail 12 sales within ~0.75 mi
| Address | Dist | Beds/Ba | Sqft | Sold | Price | $/sf | Match |
|---|---|---|---|---|---|---|---|
| 125 White Ave | 0.00mi | 4/1.0 (+1) | 1,106 (0%) | 3mo | $185,000 | $167 | 92 |
| 1515 Yates Ave | 0.14mi | 3/1.5 | 1,080 (-2%) | 1mo | $170,000 | $157 | 87 |
| 101 Chadwick Ave | 0.09mi | 3/1.5 | 1,080 (-2%) | 7mo | $180,000 | $167 | 84 |
| 1363 Green St | 0.18mi | 3/1.5 | 1,072 (-3%) | 5mo | $176,000 | $164 | 80 |
| 1339 Green St | 0.22mi | 3/1.5 | 1,056 (-4%) | 4mo | $177,000 | $168 | 77 |
| 136 Chadwick Ave | 0.11mi | 3/1.5 | 1,031 (-7%) | 8mo | $225,000 | $218 | 75 |
| 159 Chadwick Ave | 0.11mi | 3/1.5 | 1,005 (-9%) | 6mo | $225,000 | $224 | 73 |
| 33 Maple St | 0.40mi | 3/1.0 | 1,168 (+6%) | 8mo | $179,000 | $153 | 65 |
| 1335 Green St | 0.23mi | 3/1.5 | 960 (-13%) | 0mo | $185,000 | $193 | 65 |
| 630 Taylor Ave | 0.51mi | 2/1.0 (-1) | 1,200 (+8%) | 0mo | $235,500 | $196 | 57 |
| 1024 Washington Ave | 0.43mi | 3/1.0 | 1,238 (+12%) | 9mo | $190,000 | $153 | 53 |
| 303 Johnson Ave | 0.41mi | 3/1.5 | 1,245 (+13%) | 8mo | $249,000 | $200 | 51 |
Match score weights: distance 35% · size 25% · config 20% · recency 20%. Top-matched comps best support the ARV.
Projected returns pro-forma
-3.0% appreciation · 1.83% rent growth · sell at horizon
- IRR
- 34.5%
- Equity multiple
- 2.44×
- Total profit
- $34,174
- Equity at exit
- $12,674
- IRR
- 40.7%
- Equity multiple
- 4.62×
- Total profit
- $86,086
- Equity at exit
- $7,349
Cash invested: $23,800 (down + closing). Projections, not guarantees.
Landlord ↔ Tenant lean methodology
- Overall (STATE)
- 62 Landlord-Friendly
- State Pennsylvania
- 62 Landlord-Friendly · EVEN
- County
- — inherits STATE
- City
- — inherits STATE
ZIP-level market 19061
- Rents YoY
- 1.8%
- Active inventory
- 68
- Price-to-rent
- 4.1×
Monthly cashflow live
- Estimated rent
- $1,730 high interval (Pro) →
- Mortgage (P&I)
- −$446
- Tax from tax record
- −$102 /mo · $1,221/yr
- Insurance
- −$35
- HOA
- −$0
- Vacancy / Maint / Mgmt
- −$363
- Net cashflow
- $784
Break-even live
Sensitivity live
| Price | -10% $832 | -5% $808 | +0% $784 | +5% $760 | +10% $736 |
|---|---|---|---|---|---|
| Rent | -10% $647 | -5% $716 | +0% $784 | +5% $852 | +10% $921 |
| Rate | -1.0pp $827 | -0.5pp $806 | base $784 | +0.5pp $762 | +1.0pp $740 |
UW: 25.0% down · 7.5% · 30yr · 1.5% tax · 5.0% vac · 8.0% maint · 8.0% mgmt
Financing live
Cash to close
- Down payment
- $21,250
- Closing costs
- $2,550
- Reserves months
- —
- Total cash needed
- —
Loan-product check · same deal, 3 products live
Conventional
25% down · 7.5% · 30yr
- Down + closing
- —
- Monthly P&I
- —
- Monthly cashflow
- —
- DSCR
- —
- Eligible?
- —
Personal DTI + credit; lowest rate.
DSCR
20% down · 8.5% · 30yr
- Down + closing
- —
- Monthly P&I
- —
- Monthly cashflow
- —
- DSCR
- —
- Eligible?
- —
No personal income docs; deal must DSCR.
Hard money
10% down · 12.0% · 12mo
- Down + closing
- —
- Monthly P&I
- —
- Monthly cashflow
- —
- DSCR
- —
- Eligible?
- —
Short-term bridge; refi at stabilization.
Rent comps 17 comps
| Address | Beds | Baths | Sqft | Rent | $/sqft | DOM | Units | Dist |
|---|---|---|---|---|---|---|---|---|
| 130 Harvey Ave Unit 1 Linwood, PA | 3.0 | 1.0 | 1173 | $1,750 | $1.49 | 10d | 1 | 0.07mi |
| 151 Chadwick Ave Marcus Hook, PA | 3.0 | 1.5 | 1080 | $1,600 | $1.48 | 11d | 1 | 0.12mi |
| 117 Ervin Ave Marcus Hook, PA | 3.0 | 1.5 | 720 | $1,595 | $2.22 | 21d | 1 | 0.13mi |
| 119 E Laughead Ave Marcus Hook, PA | 3.0 | 1.5 | 1080 | $1,530 | $1.42 | 4d | 1 | 0.22mi |
| 1015 McClenahan Ter Marcus Hook, PA | 3.0 | 2.5 | 1456 | $2,400 | $1.65 | 11d | 1 | 0.40mi |
| 15 Marshall Ave Marcus Hook, PA | 3.0 | 1.0 | 1204 | $1,600 | $1.33 | 25d | 1 | 0.51mi |
| 8 W 8th St Marcus Hook, PA | 3.0 | 1.0 | 1120 | $1,600 | $1.43 | 19d | 1 | 0.60mi |
| 7 W 6th St Marcus Hook, PA | 3.0 | 1.0 | 1287 | $1,815 | $1.41 | 15d | 1 | 0.73mi |
| 1006 Keystone Rd Chester, PA | 2.0 | 1.0 | 750 | $1,200 | $1.60 | 25d | 1 | 1.16mi |
| 1107-1115 Keystone Rd Chester, PA | 2.0 | 1.0 | 700 | $1,250 | $1.79 | 44d | 1 | 1.18mi |
| 908 Keystone Rd Chester, PA | 2.0 | 1.0 | 750 | $1,200 | $1.60 | 44d | 1 | 1.20mi |
| 906 Keystone Rd Unit 1 Chester, PA | 2.0 | 1.0 | 800 | $1,200 | $1.50 | 25d | 1 | 1.20mi |
| 906 Keystone Rd Chester, PA | 2.0 | 1.0 | 800 | $1,200 | $1.50 | 22d | 1 | 1.20mi |
| 3312 W 13th St Chester, PA | 2.0 | 1.0 | 936 | $1,499 | $1.60 | 22d | 1 | 1.21mi |
| 2820 Chichester Ave Boothwyn, PA | 2.0 | 1.0 | 850 | $1,347 | $1.58 | 22d | 1 | 1.24mi |
| 237 Ridge Rd Claymont, DE | 2.0 | 1.0 | 950 | $1,700 | $1.79 | 22d | 1 | 1.42mi |
| 2832 W 6th St Unit 306 Chester, PA | 3.0 | 1.0 | 1428 | $1,500 | $1.05 | 5d | 1 | 1.46mi |
Listing history 2 events
-
2026-05-04status Pending 376-char remark
-
2026-04-27$85,000 Active 376-char remark
ⓘ Source: listings_history table (triggers on properties + properties_extension) + one-shot
backfill from property_details.listing_events for pre-trigger history.
Tax reassessment forecast PA · Partial reset (capped growth)
- Current annual tax
- $1,221 · $102/mo
- Projected year-2 tax
- $1,282 · $107/mo
- Expected delta
- +$61/yr (+$5/mo · 5.0%)
ⓘ Screening estimate from a state-policy table — verify with the county assessor before closing.
Climate risk First Street
- Flood 1/10 Low FEMA zone X (unshaded) · 0% chance over 30 yrs
- Wildfire 1/10 Low
- Heat 7/10 Severe 7 d/yr ≥104°F today · 15 d/yr by 30 yrs out
- Wind 6/10 Major 27% chance of damaging wind over 30 yrs
- Air quality 4/10 Moderate 4 unhealthy d/yr today · 7 by 30 yrs out
Nearby sold comps map
Loading sold comps map…
Walkable amenities ~0.75 mi
Loading nearby amenities…
Taxation est. · year 1
- Rental income
- $20,764
- − Mortgage interest
- −$4,761
- − Property taxes
- −$1,221
- − Insurance
- −$425
- − Repairs & maintenance
- −$1,661
- − Management
- −$1,661
- − Depreciation
- −$2,473
- Taxable income
- $8,562
- Est. tax owed @ 24.0%
- −$2,055
- After-tax cash flow
- $7,354/yr
For passive investors: Depreciation is non-cash, so a rental often shows a tax loss while cash-flowing — sheltering income. Rental losses are passive: they offset passive income freely, and up to $25,000/yr can offset ordinary (W-2) income if you actively participate and your MAGI is under $100k (phasing out to $0 by $150k); unused losses carry forward. On sale, claimed depreciation is recaptured at up to 25%, and gains may owe capital-gains tax (a 1031 exchange can defer both). Figures are a year-1 estimate at your 24.0% rate — not tax advice; consult a CPA.
Schools (NCES district)
- District
- Chichester SD
- NCES district ID
- 4205910
- Math proficiency
- 19% ▼ -12.00%
- Reading proficiency
- 41% ▼ -17.00%
- Median HH income
- $57,612
- Composite
- 26.84/100
- National rank
- #7110
- State rank
- #438 of 539 in PA
Livability — Linwood
- Score
- 79/100
- State rank
- #234
- US rank
- #2020
Category grades
Schools grade is shown separately in the Schools card above.
Census & demographics
- Census place
- Linwood, PA
- County
- Delaware County · 399,863 people
- City population
- 20,135
- Metro
- Philadelphia-Camden-Wilmington, PA-NJ-DE-MD
- Population (ZIP)
- 19,896
- Household income
- $82,005
- Rent vs Own
- Severe rent burden
- 612.0
Population outlook (Delaware County) Hauer SSP2
- Today (2025)
- 577,490 people
- By 2030
- 581,243 · +0.6%
- By 2040
- 584,700 · +1.2%
- By 2050
- 586,581 · +1.6%
- By 2075
- 598,706 · +3.7%
- By 2100
- 590,823 · +2.3%
Race, ethnicity, and origin ACS 2023
- Neighborhood character
- Predominantly White (74%)
- Race & ethnicity
- White 74% Black 11% Hispanic / Latino 5% Two or more races 5% Asian 4%
- Hispanic origin (detail)
- Mexican 1% Puerto Rican 2%
- Common ancestry
- Romanian 5% Subsaharan African 3% Polish 2%
- Foreign-born
- 8% · Canada, China, South Korea
- Languages at home
- 90% English-only · Spanish 3% Chinese 3% Other Indo-European 1%
Political lean MEDSL · Delaware
- 2024 margin
- Strong D (+23.7) · D 61.4% · R 37.6% · Other 1.0%
- 2008→2024 swing
- +2.3pp toward D · 2008: 21.4pp · 2024: 23.7pp
- All cycles
- 2024: D+23.7 2020: D+26.7 2016: D+22.0 2012: D+21.8 2008: D+21.4
Not yet ingested
- Civics
- —
Market trends
- HPI YoY
- ▼ -187.71%
- Current HPI
- 265.507
- Rent YoY
- ▲ 1.83%
- Metro
- Philadelphia-Camden-Wilmington, PA-NJ-DE-MD
- State GDP YoY
- ▲ 1.68%
- F500 in state
- 34
Industry mix (Fortune 500 HQ in PA)
| Industry | F500 HQs | Revenue |
|---|---|---|
| Healthcare | 2 | $309B |
|
||
| Insurance | 2 | $27B |
|
||
| Telecommunications / Media | 1 | $124B |
|
||
| Industrial Distribution | 1 | $22B |
|
||
| Financial Services | 1 | $20B |
|
||
| Chemicals / Materials | 1 | $18B |
|
||
Price history
2 events — show timeline
- 2026-05-04 Pending — BRIGHT MLS
- 2026-04-27 Listed $85,000 BRIGHT MLS
Property tax history
-4.3%/yrLatest (2026): $1,221 · -67.7% YoY. Source: county tax records.
Cash-flow waterfall
monthlySold comps — $/sqft
last 12 mo · ≤1 miLoading sold comps…