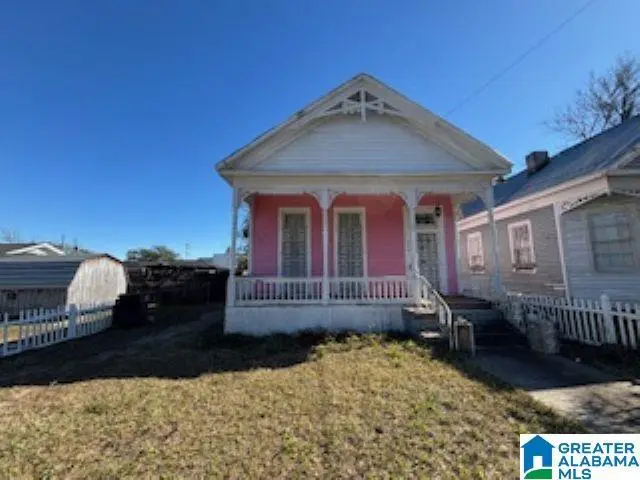
256 N Pine St · Mobile, AL
Flood risk 5/10 · Moderate
- FEMA flood zone
- X (unshaded)
- Chance of flooding over 30 yrs
- 0.24%
- Est. flood insurance / yr
- $507 – $1,088
Fire risk 1/10 · Minimal
- Est. fire insurance / yr
- $916 – $1,700
Heat risk 9/10 · Severe
- Hot days now (above 104°F)
- 7 days/yr
- Hot days in 30 yrs
- 22 days/yr
Wind risk 9/10 · Severe
- Chance of severe wind over 30 yrs
- 99.0%
Air-quality risk 2/10 · Minimal
- Unhealthy air days now
- 1 days/yr
- Unhealthy air days in 30 yrs
- 1 days/yr
Risk factors via First Street. Map © Google.
Why this score? — see what drove the B grade
The composite is a weighted blend of 9 inputs, each scored 0–100. Each bar is that input's sub-score; the figure is the points it added to the 100-point composite (weight × sub-score).
- Cash flow +30.0/30.0
- 1% rule +10.0/10.0
- DSCR +10.0/10.0
- ARV discount +7.5/15.0
- Appreciation +5.7/10.0
- Livability +3.8/5.0
- Rent growth +2.5/5.0
- Condition / age +2.5/5.0
- Schools +2.3/10.0
$80,000
🖨 Deal sheet (PDF) 📄 Offer letter ✓ Due diligence
Listing remarks MLS
single-family home located at 256 N Pine St, Mobile, AL. 256 N Pine St is in the Owens neighborhood in Mobile. This property has 3 large bedrooms and 2 bathrooms and approximately 1,605 sqft of floor space, that contains a large and spacious living room and den. This property was built in 1984. All measurements are appropriate and are to be verified by the buyer. Property is being sold as-is.
Key facts
- Great location
- Blocks from downtown
- 8,712 sq ft lot
Tags
Property features AI
Finance
- Financial info: Has down payment assistance available
Exterior
- Parking: Off-street parking
- Utilities: Public water; Connected sewer; Electric water heater; Internet availability unknown
- Home design: Log home features; Historic register designation; Existing construction
- Construction: Wood siding construction; Crawl space foundation
- Exterior features: Fenced yard; No pool; No deck; No patio; Not waterfront; Lot with approximately 0.2 acres; Not in a flood plain; No notable lot view
Interior
- Kitchen: Stone countertops; Some stainless appliances
- Bedrooms: Multiple bedrooms on main level (bedrooms and sitting area in master noted)
- Flooring: Hardwood floors; Tile floors
- Bathrooms: Two full bathrooms; Master includes a sitting area and tub/shower combo; some bathrooms are shared
- Heating & cooling: Central heating; Central cooling
- Interior features: 9 ft. and higher ceilings; Stone kitchen countertops; Some stainless steel kitchen appliances; One wood-burning fireplace with brick surround located in the den; Has laundry room; No attic
- Laundry & utility: Main-level laundry room; Washer hookup provided; Electric dryer hookup; Electric water heater
Neighborhood map
What this means for you Summary
Snapshot
- This is a 3-bed/2.0-bath single-family listed at $80k.
Deal economics
- At list price, monthly cash flow is $1k ($15k/yr) — positive.
- The deal already cash-flows at list — no discount required.
- Meets the 1% rule at list price ($2k rent vs $80k).
- Recommended offer: $70k (12.0% below list) — sets the bar for market timing.
- Cap rate 24.8% vs local median 4.9% in Mobile — top-decile yield for the area; either an underpriced asset or a hidden risk that comps aren't pricing in. Stress-test before assuming the spread holds.
Location & tenants
- Location reads 75/100 on livability (#20 in AL, #4,262 nationally) — a middle-class / working-renter tenant base. Strengths: commute A+, cost of living A+, housing A+; Watch: crime F, employment D-.
- Mobile County (urban): math 15% / reading 39% proficiency, ranked #81 of 129 in AL (top 63%) — low school quality limits family demand, transient renter base, plan for 1-2y turnover; 67% free/reduced lunch — lower-income household profile, screen leases tightly.
- Zoned schools: Florence Howard Elementary School (math 2% / reading 22%, grade F, #536 of 627 statewide, top 88%, 488 students, 94% FRL); Calloway Smith Middle School (math 0% / reading 18%, grade F, #235 of 257 statewide, top 93%, 396 students, 96% FRL); John L Leflore Magnet School (math 2% / reading 2%, grade F, #291 of 305 statewide, top 100%, 618 students, 84% FRL) — zoned schools average 91% FRL vs 67% district-wide (24 pts higher); higher-poverty schools than district average — tighter screening recommended.
- Zoned-school proficiency averages 8% at this address vs 27% district-wide (-19 pts) — the specific schools serving this property underperform the Mobile County average; the district grade overstates school quality for this exact location.
- Market conditions: 36 active listings in the ZIP; 17 comparable units currently listed for rent nearby; rentals at typical pace (median 24d on market — plan ~3-4 weeks tenant-placement turnaround); 47% of comp listings sitting > 30 days — soft ceiling on asking rent; 1,678 units permitted in Mobile County in 2024 (264 in 5+ unit buildings).
Forward outlook
- In year one you build about $2k of equity ($553 loan paydown + $1k appreciation (1.3% local appreciation)).
- Mobile County population projected to shrink 8% by 2050 — rents likely to lag national; underwrite the cash flow, not the appreciation.
- At projected returns (1.3% appreciation + 3.0% rent growth), your $22k cash investment doubles in ~2 years — after that, you're playing with house money.
Negotiation context
- It's been on market 175 days — a 12% lower offer ($70k) is reasonable based on typical stale-listing flexibility.
- 8 sale attempts since 6y ago; this cycle's ask has dropped $9k (10%) from the opening price — seller is motivated, your offer sets the floor, not the list.
- Current owner paid $40k; list at $80k implies a 103% gain — meaningful room to come down on a strong offer.
Risks & watch-outs
- Climate carrying-cost: moderate flood risk; severe wind risk, 99% chance of damaging wind over 30y; extreme-heat days projected 7→22/yr by 2055 (HVAC capex compounding) — expect insurance premiums to compound above CPI over the hold.
Questions for the listing agent
- It's been on market 175 days. Have you received any prior offers? Is the seller open to a 12% concession, seller financing, or rate buy-down credit?
- Built in 1964 — when were the roof, HVAC, electrical panel, plumbing, and water heater last replaced?
- Why hasn't it sold? Are there any deal-killer items the seller is aware of (foundation, flood, title, zoning, code violations)?
- Is there a deadline driving the sale (1031 exchange, divorce, estate, relocation)? That informs how much negotiation room exists.
- Schools are D-rated, which usually means shorter tenancies and higher turnover. Who's the typical renter profile here, and what's been the actual vacancy rate?
- Crime grade is F in this area — have there been break-ins, vandalism, or insurance claims at this property in the last 3 years? What carrier currently insures it and at what premium?
- What's the average days-on-market for RENTAL listings here right now (not sales)? A rising rental-DOM trend means longer vacancies and softer asking-rent achievability than the comps imply.
- What's the recent tenant-quality profile in this submarket — average credit score on applications, eviction rate, late-payment / NSF rate, and stable-employment percentage? A property-management company in the area should have these aggregated.
- How much new for-sale + rental construction is in the pipeline within 1–3 miles? Heavy new supply typically softens prices + rents 12–24 months out; constrained supply supports both.
Investment metrics
- 1% rule
- 2.74% ✓
- Cap rate
- 24.81%
- Cash-on-cash
- 66.14%
- DSCR
- 3.94
- GRM
- 3.0
CMA / ARV
- ARV (on-the-fly)
- $179,760
- Comps found
- 12
Show comp detail 12 sales within ~0.75 mi
| Address | Dist | Beds/Ba | Sqft | Sold | Price | $/sf | Match |
|---|---|---|---|---|---|---|---|
| 401 GASTON St | 0.29mi | 4/1.5 (+1) | 1,600 (-0%) | 9mo | $70,000 | $44 | 71 |
| 259 Dearborn St N | 0.39mi | 2/2.0 (-1) | 1,564 (-3%) | 4mo | $290,000 | $185 | 69 |
| 122 Bush Ave | 0.47mi | 3/1.0 | 1,587 (-1%) | 8mo | $177,000 | $112 | 66 |
| 1154 Old Shell Rd | 0.34mi | 3/1.0 | 1,473 (-8%) | 1mo | $235,000 | $160 | 65 |
| 1015 Old Shell Rd | 0.31mi | 2/2.0 (-1) | 1,435 (-11%) | 2mo | $250,000 | $174 | 62 |
| 1119 Old Shell Rd | 0.35mi | 3/2.0 | 1,737 (+8%) | 12mo | $163,000 | $94 | 60 |
| 612 Hickory St | 0.64mi | 3/2.0 | 1,488 (-7%) | 4mo | $53,000 | $36 | 55 |
| 118 Bush Ave | 0.47mi | 3/2.0 | 1,842 (+15%) | 2mo | $120,000 | $65 | 52 |
| 1216 Pecan St | 0.59mi | 3/2.0 | 1,392 (-13%) | 4mo | $128,500 | $92 | 47 |
| 361 Lexington Ave | 0.71mi | 3/2.0 | 1,764 (+10%) | 5mo | $60,500 | $34 | 46 |
| 125 Bush Ave | 0.49mi | 3/2.0 | 1,400 (-13%) | 13mo | $174,900 | $125 | 45 |
| 32 Blacklawn St | 0.67mi | 3/2.0 | 1,410 (-12%) | 14mo | $319,000 | $226 | 37 |
Match score weights: distance 35% · size 25% · config 20% · recency 20%. Top-matched comps best support the ARV.
Projected returns pro-forma
1.32% appreciation · 3.0% rent growth · sell at horizon
- IRR
- 69.3%
- Equity multiple
- 4.63×
- Total profit
- $81,391
- Equity at exit
- $28,657
- IRR
- 70.1%
- Equity multiple
- 9.43×
- Total profit
- $188,722
- Equity at exit
- $39,146
Cash invested: $22,400 (down + closing). Projections, not guarantees.
Landlord ↔ Tenant lean methodology
- Overall (STATE)
- 90 Strongly Landlord-Friendly
- State Alabama
- 90 Strongly Landlord-Friendly · R+15
- County
- — inherits STATE
- City
- — inherits STATE
ZIP-level market 36603
- Home prices YoY
- 2.8%
- Active inventory
- 36
- Price-to-rent
- 3.0×
Monthly cashflow live
- Estimated rent
- $2,193 high interval (Pro) →
- Mortgage (P&I)
- −$420
- Tax from tax record
- −$45 /mo · $544/yr
- Insurance
- −$33
- HOA
- −$0
- Lot rent
- −$0
- Vacancy / Maint / Mgmt
- −$461
- Net cashflow
- $1,235
Break-even live
Sensitivity live
| Price | -10% $1,280 | -5% $1,257 | +0% $1,235 | +5% $1,212 | +10% $1,189 |
|---|---|---|---|---|---|
| Rent | -10% $1,061 | -5% $1,148 | +0% $1,235 | +5% $1,321 | +10% $1,408 |
| Rate | -1.0pp $1,275 | -0.5pp $1,255 | base $1,235 | +0.5pp $1,214 | +1.0pp $1,193 |
UW: 25.0% down · 7.5% · 30yr · 1.5% tax · 5.0% vac · 8.0% maint · 8.0% mgmt
Financing live
Cash to close
- Down payment
- $20,000
- Closing costs
- $2,400
- Reserves months
- —
- Total cash needed
- —
Loan-product check · same deal, 3 products live
Conventional
25% down · 7.5% · 30yr
- Down + closing
- —
- Monthly P&I
- —
- Monthly cashflow
- —
- DSCR
- —
- Eligible?
- —
Personal DTI + credit; lowest rate.
DSCR
20% down · 8.5% · 30yr
- Down + closing
- —
- Monthly P&I
- —
- Monthly cashflow
- —
- DSCR
- —
- Eligible?
- —
No personal income docs; deal must DSCR.
Hard money
10% down · 12.0% · 12mo
- Down + closing
- —
- Monthly P&I
- —
- Monthly cashflow
- —
- DSCR
- —
- Eligible?
- —
Short-term bridge; refi at stabilization.
Rent comps 17 comps
| Address | Beds | Baths | Sqft | Rent | $/sqft | DOM | Units | Dist |
|---|---|---|---|---|---|---|---|---|
| 961 Old Shell Rd Unit A Mobile, AL | 3.0 | 2.5 | 1600 | $1,295 | $0.81 | 46d | 1 | 0.37mi |
| 107 Michael Donald Ave Unit 1043461P Mobile, AL | 4.0 | 3.5 | 2195 | $3,962 | $1.81 | 16d | 1 | 0.39mi |
| 1321 SpringHill Ave Unit B Mobile, AL | 2.0 | 1.0 | 2006 | $950 | $0.47 | 46d | 1 | 0.50mi |
| 57 N Ann St Unit 1043453P Mobile, AL | 2.0 | 2.0 | 1065 | $2,015 | $1.89 | 23d | 1 | 0.51mi |
| 1141 Montauk Ave Unit 1043864P Mobile, AL | 3.0 | 2.0 | 1420 | $2,741 | $1.93 | 16d | 1 | 0.72mi |
| 412 Dauphin St Mobile, AL | 2.0 | 1.0–2.5 | 1553 | $2,350 | $1.51 | 16d | 2 | 0.75mi |
| 957 Savannah St Mobile, AL | 2.0 | 1.5 | 1054 | $1,400 | $1.33 | 23d | 1 | 0.96mi |
| 1566 Dauphin St Unit Back Carriage House Mobile, AL | 3.0 | 1.0 | 1300 | $1,200 | $0.92 | 46d | 1 | 1.06mi |
| 500 Palmetto St Mobile, AL | 3.0 | 2.0 | 1786 | $1,450 | $0.81 | 46d | 1 | 1.11mi |
| 84 S Lafayette St Unit 1043577P Mobile, AL | 3.0 | 2.0 | 1496 | $3,116 | $2.08 | 16d | 1 | 1.14mi |
| 1417 Monroe St Mobile, AL | 2.0 | 1.0 | 1064 | $1,350 | $1.27 | 46d | 1 | 1.22mi |
| 107 Macy Pl Mobile, AL | 3.0 | 2.0 | 1800 | $2,250 | $1.25 | 46d | 1 | 1.24mi |
| 1704 McGill Ave Unit B Mobile, AL | 3.0 | 2.5 | 1500 | $1,750 | $1.17 | 46d | 1 | 1.34mi |
| 1660 Laurel St Mobile, AL | 3.0 | 2.0 | 1768 | $2,200 | $1.24 | 16d | 1 | 1.42mi |
| 305 Indian Creek Dr E Unit 1043809P Mobile, AL | 3.0 | 2.5 | 1496 | $3,985 | $2.66 | 16d | 1 | 1.43mi |
| 129 Shell Road Pl Unit 1043713P Mobile, AL | 4.0 | 2.0 | 1496 | $3,389 | $2.27 | 23d | 1 | 1.45mi |
| 711 Marine St Mobile, AL | 2.0 | 1.0 | 1100 | $1,150 | $1.05 | 46d | 1 | 1.48mi |
Listing history 35 events
-
2026-06-23days on market $80,000 Active 175 DOM
-
2026-06-21days on market $80,000 Active 174 DOM
-
2026-06-18days on market $80,000 Active 171 DOM
-
2026-06-17days on market $80,000 Active 170 DOM
-
2026-06-16days on market $80,000 Active 169 DOM
-
2026-06-15price $80,000 Active 168 DOM
-
2026-06-15days on market $84,900 Active 168 DOM
-
2026-06-14days on market $84,900 Active 166 DOM
-
2026-06-13days on market $84,900 Active 165 DOM
-
2026-06-10days on market $84,900 Active 163 DOM
-
2026-06-09days on market $84,900 Active 162 DOM
-
2026-06-08days on market $84,900 Active 161 DOM
-
2026-06-07days on market $84,900 Active 160 DOM
-
2026-06-05days on market $84,900 Active 157 DOM
-
2026-06-03days on market $84,900 Active 156 DOM
-
2026-06-02days on market $84,900 Active 155 DOM
-
2026-06-01days on market $84,900 Active 154 DOM
-
2026-05-31days on market $84,900 Active 153 DOM
-
2026-05-30days on market $84,900 Active 152 DOM
-
2026-05-21status Active
-
2026-04-20historical Contingent
-
2026-02-07price $84,900
-
2026-02-06status Active
-
2026-01-28historical Contingent
-
2025-12-29$89,000 Active
-
2024-12-09status Active
-
2024-12-02status Pending
-
2024-09-16status Active
-
2024-08-29historical Active Under Contract
-
2024-08-19status Pending
-
2024-07-08status Active
-
2024-06-19status Pending
-
2024-05-13$115,000 Active
-
2020-06-12soldstatus $39,500 396-char remark
Show marketing remark (396 chars)
single-family home located at 256 N Pine St, Mobile, AL. 256 N Pine St is in the Owens neighborhood in Mobile. This property has 3 large bedrooms and 2 bathrooms and approximately 1,605 sqft of floor space, that contains a large and spacious living room and den. This property was built in 1984. All measurements are appropriate and are to be verified by the buyer. Property is being sold as-is.
-
2020-05-07$39,500 396-char remark
Show marketing remark (396 chars)
single-family home located at 256 N Pine St, Mobile, AL. 256 N Pine St is in the Owens neighborhood in Mobile. This property has 3 large bedrooms and 2 bathrooms and approximately 1,605 sqft of floor space, that contains a large and spacious living room and den. This property was built in 1984. All measurements are appropriate and are to be verified by the buyer. Property is being sold as-is.
ⓘ Source: listings_history table (triggers on properties + properties_extension) + one-shot
backfill from property_details.listing_events for pre-trigger history.
Tax reassessment forecast AL · Resets to sale price
- Current annual tax
- $544 · $45/mo
- Projected year-2 tax
- $544 · $45/mo
- Expected delta
- $0/yr ($0/mo · 0.0%)
ⓘ Screening estimate from a state-policy table — verify with the county assessor before closing.
Climate risk First Street
- Flood 5/10 Major FEMA zone X (unshaded) · 24% chance over 30 yrs
- Wildfire 1/10 Low
- Heat 9/10 Extreme 7 d/yr ≥104°F today · 22 d/yr by 30 yrs out
- Wind 9/10 Extreme 99% chance of damaging wind over 30 yrs
- Air quality 2/10 Low 1 unhealthy d/yr today · 1 by 30 yrs out
Nearby sold comps map
Loading sold comps map…
Walkable amenities ~0.75 mi
Loading nearby amenities…
Taxation est. · year 1
- Rental income
- $26,320
- − Mortgage interest
- −$4,481
- − Property taxes
- −$544
- − Insurance
- −$400
- − Repairs & maintenance
- −$2,106
- − Management
- −$2,106
- − Depreciation
- −$2,327
- Taxable income
- $14,356
- Est. tax owed @ 24.0%
- −$3,446
- After-tax cash flow
- $11,369/yr
For passive investors: Depreciation is non-cash, so a rental often shows a tax loss while cash-flowing — sheltering income. Rental losses are passive: they offset passive income freely, and up to $25,000/yr can offset ordinary (W-2) income if you actively participate and your MAGI is under $100k (phasing out to $0 by $150k); unused losses carry forward. On sale, claimed depreciation is recaptured at up to 25%, and gains may owe capital-gains tax (a 1031 exchange can defer both). Figures are a year-1 estimate at your 24.0% rate — not tax advice; consult a CPA.
Schools (NCES district)
- District
- Mobile County
- NCES district ID
- 0102370
- Math proficiency
- 15% ▼ -28.00%
- Reading proficiency
- 39% ▬ 0.00%
- Median HH income
- $42,455
- Composite
- 22.9/100
- National rank
- #8002
- State rank
- #81 of 129 in AL
Livability — Mobile
- Score
- 75/100
- State rank
- #20
- US rank
- #4262
Category grades
Schools grade is shown separately in the Schools card above.
Census & demographics
- Census place
- Mobile, AL
- City population
- 205,729
- Population (ZIP)
- 7,805
Population outlook (Mobile County) Hauer SSP2
- Today (2025)
- 415,303 people
- By 2030
- 411,755 · -0.9%
- By 2040
- 399,670 · -3.8%
- By 2050
- 382,616 · -7.9%
- By 2075
- 337,353 · -18.8%
- By 2100
- 283,391 · -31.8%
Race, ethnicity, and origin ACS 2023
- Neighborhood character
- Predominantly Black (85%)
- Race & ethnicity
- Black 85% White 12% Two or more races 1% Hispanic / Latino 1%
- Common ancestry
- Lithuanian 1%
- Foreign-born
- 1% · Canada
- Languages at home
- 99% English-only · Spanish 1%
Political lean MEDSL · Mobile
- 2024 margin
- R (+16.4) · D 41.3% · R 57.7%
- 2008→2024 swing
- -7.7pp toward R · 2008: -8.7pp · 2024: -16.4pp
- All cycles
- 2024: R+16.4 2020: R+11.9 2016: R+13.9 2012: R+9.3 2008: R+8.7
Not yet ingested
- Civics
- —
Market trends
- HPI YoY
- ▲ 1.32%
- Current HPI
- 48.9551
- Rent YoY
- —
- Metro
- —
- State GDP YoY
- ▲ 2.94%
- F500 in state
- 4
Industry mix (Fortune 500 HQ in AL)
| Industry | F500 HQs | Revenue |
|---|---|---|
| Financial Services | 1 | $8B |
|
||
| Healthcare | 1 | $5B |
|
||
Price history
+114.9% since first listed16 events — show timeline
- 2026-05-21 Relisted — Greater Alabama MLS
- 2026-04-20 Contingent — Greater Alabama MLS
- 2026-02-07 Price Changed $84,900 Greater Alabama MLS
- 2026-02-06 Relisted — Greater Alabama MLS
- 2026-01-28 Contingent — Greater Alabama MLS
- 2025-12-29 Listed $89,000 Greater Alabama MLS
- 2024-12-09 Relisted — BCAR
- 2024-12-02 Pending — BCAR
- 2024-09-16 Relisted — BCAR
- 2024-08-29 Contingent — BCAR
- 2024-08-19 Pending — BCAR
- 2024-07-08 Relisted — BCAR
- 2024-06-19 Pending — BCAR
- 2024-05-13 Listed $115,000 BCAR
- 2020-06-12 Sold (MLS) $39,500 BCAR
- 2020-05-07 Listed $39,500 BCAR
Property tax history
+2.4%/yrLatest (2025): $544 · +7.0% YoY. Source: county tax records.
Cash-flow waterfall
monthlySold comps — $/sqft
last 12 mo · ≤1 miLoading sold comps…