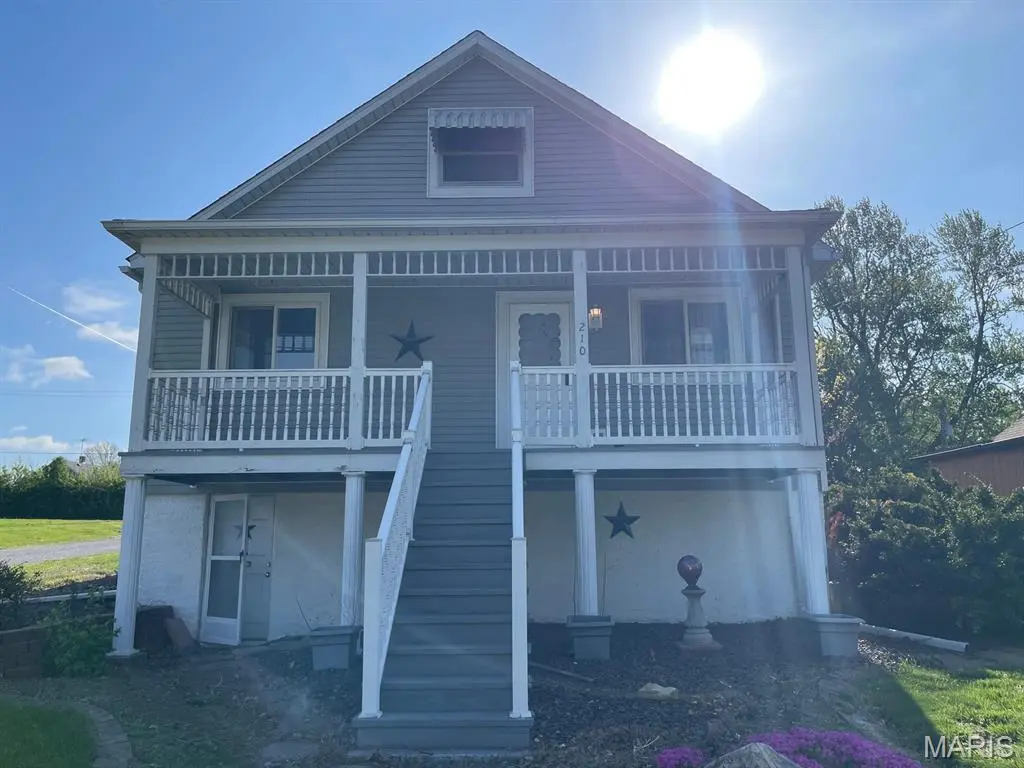
210 N 4th St · Benld, IL
Flood risk 1/10 · Minimal
- FEMA flood zone
- —
- Chance of flooding over 30 yrs
- 0.0%
- Est. flood insurance / yr
- —
Fire risk 1/10 · Minimal
- Est. fire insurance / yr
- $804 – $1,492
Heat risk 4/10 · Minor
- Hot days now (above 107°F)
- 7 days/yr
- Hot days in 30 yrs
- 20 days/yr
Wind risk 2/10 · Minimal
- Chance of severe wind over 30 yrs
- 1.0%
Air-quality risk 4/10 · Minor
- Unhealthy air days now
- 3 days/yr
- Unhealthy air days in 30 yrs
- 6 days/yr
Risk factors via First Street. Map © Google.
Why this score? — see what drove the C grade
The composite is a weighted blend of 9 inputs, each scored 0–100. Each bar is that input's sub-score; the figure is the points it added to the 100-point composite (weight × sub-score).
- Cash flow +22.0/30.0
- ARV discount +15.0/15.0
- DSCR +7.1/10.0
- 1% rule +4.9/10.0
- Livability +3.2/5.0
- Rent growth +2.5/5.0
- Condition / age +2.5/5.0
- Schools +1.5/10.0
- Appreciation +0.0/10.0
$107,000
🖨 Deal sheet 📄 Offer letter ✓ Due diligence
Listing remarks
Welcome to 210 N 4th Street in Benld! This charming raised-ranch home offers a functional layout with plenty of potential. Enter through the rear entrance into a convenient mudroom featuring laundry hookups tucked neatly into a closet. The main level includes a spacious kitchen, comfortable living room, dining room, one bedroom, and a full bathroom. Upstairs, you'll find an additional bedroom along with a versatile bonus room that can serve as a home office, playroom, hobby space, or guest area. The full unfinished basement provides abundant storage and additional utility space, complete with a walkout door leading to the front yard. Outside, enjoy a fenced backyard ideal for pets, gardenin
Key facts
- Spacious kitchen
- Living room
- Bonus room
Tags
Property features AI
Finance
- Other: Living area reported as 1,550 (source: public records)
- Financial info: Lease considered
- HOA & community: No HOA information provided
Exterior
- Parking: Detached or attached garage not specified, 1 garage space
- Security: No security features provided
- Utilities: Public water; Public sewer; Electric service: Ameren; Natural gas available
- Home design: Single-family residence; Residential property; Bank-owned; Entry level and facing direction not provided
- Construction: Vinyl siding; Year built not provided; Basement present
- Exterior features: Covered patio; Patio; Fenced backyard
Interior
- Kitchen: No kitchen appliance details provided
- Bedrooms: 2 bedrooms total; 1 bedroom on the main level; 1 bedroom on the upper level
- Flooring: No flooring details provided
- Bathrooms: 1 full bathroom
- Heating & cooling: Radiant heating; Window air conditioning units
- Interior features: Full basement; Two levels
- Laundry & utility: No laundry details provided
Neighborhood map
What this means for you Summary
Snapshot
- This is a 2-bed/1.0-bath single-family listed at $107k.
Deal economics
- At list price, monthly cash flow is $171 ($2k/yr) — positive.
- The deal already cash-flows at list — no discount required.
- To meet the 1% rule (rent ≥ 1% of price), the offer needs to be $106k (0.8% below list).
- Recommended offer: $106k (0.8% below list) — sets the bar for 1% rule.
Location & tenants
- Location reads 64/100 on livability (#712 in IL) — a middle-class / working-renter tenant base. Strengths: cost of living A+, housing A+, crime A; Watch: amenities F, commute F, employment F.
- Gillespie CUSD 7 (town): math 14% / reading 20% proficiency, ranked #485 of 620 in IL (top 78%) — low school quality limits family demand, transient renter base, plan for 1-2y turnover.
- Zoned schools: Gillespie High School (math 27% / reading 32%, grade F, #187 of 693 statewide, top 30%, 340 students, 0% FRL) — zoned schools average 0% FRL vs 57% district-wide (57 pts lower); this property's tenant base skews higher-income than the district average.
- Zoned-school proficiency averages 30% at this address vs 17% district-wide (+12 pts) — the actual schools serving this property are materially stronger than the Gillespie CUSD 7 average implies; a family-tenant draw the district grade alone would hide.
- Market conditions: 4 active listings in the ZIP; 70 units permitted in Macoupin County in 2024 (0 in 5+ unit buildings).
Forward outlook
- Local home prices are declining (-3.0%/yr); year-one equity from $740 of loan paydown is wiped out by about $3k of value loss. Plan a longer hold.
- Macoupin County population projected at -27% by 2050 — secular population decline; favor cash flow + early exit over multi-decade hold.
Negotiation context
- Only 14 days on market — expect competitive offers; lowballing is unlikely to land.
- Current owner paid $54k; list at $107k implies a 98% gain — meaningful room to come down on a strong offer.
Risks & watch-outs
- Watch-outs: built in 1920 — expect roof / HVAC / electrical / plumbing capex.
Questions for the listing agent
- Built in 1920 — when were the roof, HVAC, electrical panel, plumbing, and water heater last replaced?
- Is there a deadline driving the sale (1031 exchange, divorce, estate, relocation)? That informs how much negotiation room exists.
- Schools are F-rated, which usually means shorter tenancies and higher turnover. Who's the typical renter profile here, and what's been the actual vacancy rate?
- What's the average days-on-market for RENTAL listings here right now (not sales)? A rising rental-DOM trend means longer vacancies and softer asking-rent achievability than the comps imply.
- What's the recent tenant-quality profile in this submarket — average credit score on applications, eviction rate, late-payment / NSF rate, and stable-employment percentage? A property-management company in the area should have these aggregated.
- How much new for-sale + rental construction is in the pipeline within 1–3 miles? Heavy new supply typically softens prices + rents 12–24 months out; constrained supply supports both.
Investment metrics
- 1% rule
- 0.99% ✗
- Cap rate
- 8.21%
- Cash-on-cash
- 6.86%
- DSCR
- 1.31
- GRM
- 8.4
CMA / ARV
- ARV (on-the-fly)
- $164,300
- Comps found
- 3
Show comp detail 3 sales within ~0.75 mi
| Address | Dist | Beds/Ba | Sqft | Sold | Price | $/sf | Match |
|---|---|---|---|---|---|---|---|
| 311 S 7th St | 0.38mi | 2/1.0 | 1,400 (-10%) | 20mo | $96,000 | $69 | 50 |
| 807 E Central Ave | 0.34mi | 3/2.5 (+1) | 1,725 (+11%) | 13mo | $270,000 | $157 | 44 |
| 507 N Main St | 0.21mi | 3/2.0 (+1) | 1,361 (-12%) | 21mo | $144,900 | $106 | 44 |
Match score weights: distance 35% · size 25% · config 20% · recency 20%. Top-matched comps best support the ARV.
Projected returns pro-forma
-3.0% appreciation · 3.0% rent growth · sell at horizon
- IRR
- -5.8%
- Equity multiple
- 0.78×
- Total profit
- $-6,462
- Equity at exit
- $15,954
- IRR
- 3.8%
- Equity multiple
- 1.28×
- Total profit
- $8,299
- Equity at exit
- $9,251
Cash invested: $29,960 (down + closing). Projections, not guarantees.
Landlord ↔ Tenant lean methodology
- Overall (STATE)
- 43 Moderately Tenant-Leaning
- State Illinois
- 43 Moderately Tenant-Leaning · D+7
- County
- — inherits STATE
- City
- — inherits STATE
ZIP-level market 62009
- Home prices YoY
- -13.1%
- Active inventory
- 4
- Price-to-rent
- 8.4×
Monthly cashflow live
- Estimated rent
- $1,062 medium interval (Pro) →
- Mortgage (P&I)
- −$561
- Tax from tax record
- −$62 /mo · $741/yr
- Insurance
- −$45
- HOA
- −$0
- Vacancy / Maint / Mgmt
- −$223
- Net cashflow
- $171
Break-even live
UW: 25.0% down · 7.5% · 30yr · 1.5% tax · 5.0% vac · 8.0% maint · 8.0% mgmt
Financing live
Cash to close
- Down payment
- $26,750
- Closing costs
- $3,210
- Reserves months
- —
- Total cash needed
- —
Loan-product check · same deal, 3 products live
Conventional
25% down · 7.5% · 30yr
- Down + closing
- —
- Monthly P&I
- —
- Monthly cashflow
- —
- DSCR
- —
- Eligible?
- —
Personal DTI + credit; lowest rate.
DSCR
20% down · 8.5% · 30yr
- Down + closing
- —
- Monthly P&I
- —
- Monthly cashflow
- —
- DSCR
- —
- Eligible?
- —
No personal income docs; deal must DSCR.
Hard money
10% down · 12.0% · 12mo
- Down + closing
- —
- Monthly P&I
- —
- Monthly cashflow
- —
- DSCR
- —
- Eligible?
- —
Short-term bridge; refi at stabilization.
Listing history 11 events
-
2026-06-18days on market $107,000 Active 14 DOM
-
2026-06-17days on market $107,000 Active 13 DOM
-
2026-06-16days on market $107,000 Active 12 DOM
-
2026-06-15days on market $107,000 Active 11 DOM
-
2026-06-13days on market $107,000 Active 9 DOM
-
2026-06-12days on market $107,000 Active 8 DOM
-
2026-06-09days on market $107,000 Active 5 DOM
-
2026-06-08days on market $107,000 Active 4 DOM
-
2026-06-07days on market $107,000 Active 3 DOM
-
2026-06-05remarks 699-char remark
-
2026-06-05$107,000 Active 1 DOM
ⓘ Source: listings_history table (triggers on properties + properties_extension) + one-shot
backfill from property_details.listing_events for pre-trigger history.
Tax reassessment forecast IL · Partial reset (capped growth)
- Current annual tax
- $741 · $62/mo
- Projected year-2 tax
- $1,585 · $132/mo
- Expected delta
- +$844/yr (+$70/mo · 113.8%)
ⓘ Screening estimate from a state-policy table — verify with the county assessor before closing.
Climate risk First Street
- Flood 1/10 Low 0% chance over 30 yrs
- Wildfire 1/10 Low
- Heat 4/10 Moderate 7 d/yr ≥107°F today · 20 d/yr by 30 yrs out
- Wind 2/10 Low 100% chance of damaging wind over 30 yrs
- Air quality 4/10 Moderate 3 unhealthy d/yr today · 6 by 30 yrs out
Nearby sold comps map
Loading sold comps map…
Walkable amenities ~0.75 mi
Loading nearby amenities…
Taxation est. · year 1
- Rental income
- $12,740
- − Mortgage interest
- −$5,994
- − Property taxes
- −$741
- − Insurance
- −$535
- − Repairs & maintenance
- −$1,019
- − Management
- −$1,019
- − Depreciation
- −$3,113
- Taxable income
- $319
- Est. tax owed @ 24.0%
- −$76
- After-tax cash flow
- $1,978/yr
For passive investors: Depreciation is non-cash, so a rental often shows a tax loss while cash-flowing — sheltering income. Rental losses are passive: they offset passive income freely, and up to $25,000/yr can offset ordinary (W-2) income if you actively participate and your MAGI is under $100k (phasing out to $0 by $150k); unused losses carry forward. On sale, claimed depreciation is recaptured at up to 25%, and gains may owe capital-gains tax (a 1031 exchange can defer both). Figures are a year-1 estimate at your 24.0% rate — not tax advice; consult a CPA.
Schools (NCES district)
- District
- Gillespie CUSD 7
- NCES district ID
- 1716680
- Math proficiency
- 14% ▼ -12.00%
- Reading proficiency
- 20% ▼ -19.00%
- Median HH income
- $41,399
- Composite
- 14.59/100
- National rank
- #9413
- State rank
- #485 of 620 in IL
Livability — Benld
- Score
- 64/100
- State rank
- #712
- US rank
- #14478
Category grades
Schools grade is shown separately in the Schools card above.
Census & demographics
- Census place
- Benld, IL
- City population
- 1,746
- Population (ZIP)
- 1,746
Population outlook (Macoupin County) Hauer SSP2
- Today (2025)
- 42,867 people
- By 2030
- 40,796 · -4.8%
- By 2040
- 36,135 · -15.7%
- By 2050
- 31,469 · -26.6%
- By 2075
- 22,102 · -48.4%
- By 2100
- 15,380 · -64.1%
Race, ethnicity, and origin ACS 2023
- Neighborhood character
- Predominantly White (93%)
- Race & ethnicity
- White 93% Two or more races 3% Black 1%
- Common ancestry
- Slovak 3% Romanian 1% Scotch-Irish 1%
- Foreign-born
- 2%
- Languages at home
- 97% English-only · German/W. Germanic 2%
Political lean MEDSL · Macoupin
- 2024 margin
- Solid R (+39.2) · D 29.4% · R 68.7% · Other 1.9%
- 2008→2024 swing
- -49.0pp toward R · 2008: 9.8pp · 2024: -39.2pp
- All cycles
- 2024: R+39.2 2020: R+36.5 2016: R+35.0 2012: R+7.0 2008: D+9.8
Not yet ingested
- Civics
- —
Market trends
- HPI YoY
- ▼ -19.11%
- Current HPI
- 127.2489
- Rent YoY
- —
- Metro
- —
- State GDP YoY
- ▲ 1.59%
- F500 in state
- 60
Industry mix (Fortune 500 HQ in IL)
| Industry | F500 HQs | Revenue |
|---|---|---|
| Insurance | 4 | $201B |
|
||
| Consumer Goods | 4 | $87B |
|
||
| Industrial Machinery | 3 | $64B |
|
||
| Healthcare | 2 | $55B |
|
||
| Retail / Pharmacy | 1 | $148B |
|
||
| Agriculture / Food | 1 | $86B |
|
||
Price history
+98.1% since first listed2 events — show timeline
- 2026-06-04 Listed $107,000 MARIS as Distributed by MLS Grid
- 2020-03-16 Sold (Public Records) $54,000 Public Records
Property tax history
+15.3%/yrLatest (2024): $741 · -32.0% YoY. Source: county tax records.
Cash-flow waterfall
monthlySold comps — $/sqft
last 12 mo · ≤1 miLoading sold comps…