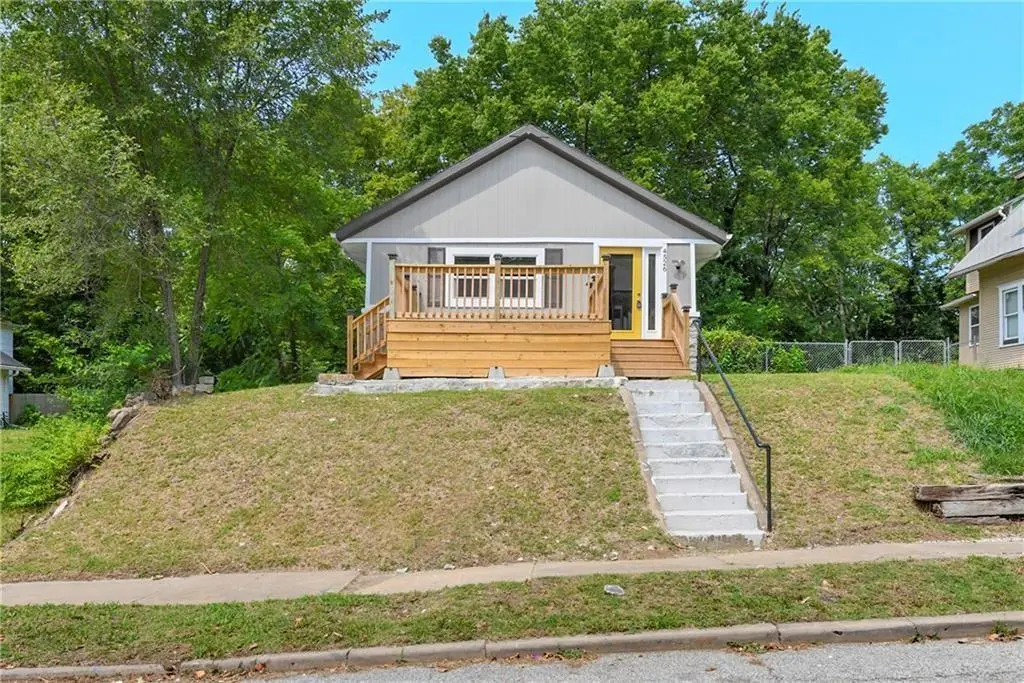
4526 Park Ave · Kansas City, MO
Flood risk 1/10 · Minimal
- FEMA flood zone
- X (unshaded)
- Chance of flooding over 30 yrs
- 0.0%
- Est. flood insurance / yr
- $473 – $860
Fire risk 1/10 · Minimal
- Est. fire insurance / yr
- $1,054 – $1,958
Heat risk 4/10 · Minor
- Hot days now (above 107°F)
- 7 days/yr
- Hot days in 30 yrs
- 16 days/yr
Wind risk 2/10 · Minimal
- Chance of severe wind over 30 yrs
- —
Air-quality risk 3/10 · Minor
- Unhealthy air days now
- 2 days/yr
- Unhealthy air days in 30 yrs
- 4 days/yr
Risk factors via First Street. Map © Google.
Why this score? — see what drove the C+ grade
The composite is a weighted blend of 9 inputs, each scored 0–100. Each bar is that input's sub-score; the figure is the points it added to the 100-point composite (weight × sub-score).
- Cash flow +28.0/30.0
- DSCR +9.9/10.0
- ARV discount +7.5/15.0
- 1% rule +6.5/10.0
- Livability +3.9/5.0
- Rent growth +3.6/5.0
- Condition / age +2.5/5.0
- Schools +1.5/10.0
- Appreciation +0.0/10.0
$115,000
🖨 Deal sheet 📄 Offer letter ✓ Due diligence
Listing remarks MLS
REDUCED for Quick end of year Sale. ! Updated ranch with basement. New roof, furnace and central air, water heather and vinyl windows. There are 2 new decks in front and back of the home. Spacious living room has lots of natural light. Come see this 2 bedroom and 1 bathroom home on the same level. Enjoy inviting front porch and deck where you can relax and enjoy life. Easy access to highway.
Key facts
- Front porch
- Natural light
- Deck
Tags
Neighborhood map
What this means for you Summary
Snapshot
- This is a 3-bed/1.0-bath single-family listed at $115k.
Deal economics
- At list price, monthly cash flow is $356 ($4k/yr) — positive.
- The deal already cash-flows at list — no discount required.
- Meets the 1% rule at list price ($1k rent vs $115k).
- Recommended offer: $101k (12.0% below list) — sets the bar for market timing.
- Cap rate 10.0% vs local median 3.9% in Kansas City — top-decile yield for the area; either an underpriced asset or a hidden risk that comps aren't pricing in. Stress-test before assuming the spread holds.
Location & tenants
- Location reads 78/100 on livability (#28 in MO, #2,671 nationally) — a middle-class / working-renter tenant base. Strengths: amenities A+, commute A+, cost of living A+; Watch: schools C-, crime F.
- Kansas City 33 (urban): math 12% / reading 24% proficiency, ranked #308 of 324 in MO (top 95%) — low school quality limits family demand, transient renter base, plan for 1-2y turnover; 75% free/reduced lunch — lower-income household profile, screen leases tightly.
- Market conditions: Rents rising fast (+4.4%/yr); 187 active listings in the ZIP; 40 comparable units currently listed for rent nearby; rentals at typical pace (median 22d on market — plan ~3-4 weeks tenant-placement turnaround); lower-income renter base — watch delinquency; 4,002 units permitted in Jackson County in 2024 (2,271 in 5+ unit buildings).
- This rent runs 38% of the median local income ($42k/yr) — at the standard rent-burdened threshold; future hikes will face affordability resistance.
Forward outlook
- Local home prices are declining (-3.0%/yr); year-one equity from $795 of loan paydown is wiped out by about $3k of value loss. Plan a longer hold.
- Jackson County population projected at +4% by 2050 — modest demand growth; plan on rents tracking national, not racing it.
- At projected returns (-3.0% appreciation + 4.4% rent growth), your $32k cash investment doubles in ~8 years — after that, you're playing with house money.
Negotiation context
- It's been on market 494 days — a 12% lower offer ($101k) is reasonable based on typical stale-listing flexibility.
- 5 sale attempts since 3y ago; this cycle's ask has dropped $35k (23%) from the opening price — seller is motivated, your offer sets the floor, not the list.
Risks & watch-outs
- Watch-outs: built in 1922 — expect roof / HVAC / electrical / plumbing capex.
Questions for the listing agent
- It's been on market 494 days. Have you received any prior offers? Is the seller open to a 12% concession, seller financing, or rate buy-down credit?
- Built in 1922 — when were the roof, HVAC, electrical panel, plumbing, and water heater last replaced?
- Why hasn't it sold? Are there any deal-killer items the seller is aware of (foundation, flood, title, zoning, code violations)?
- Is there a deadline driving the sale (1031 exchange, divorce, estate, relocation)? That informs how much negotiation room exists.
- Crime grade is F in this area — have there been break-ins, vandalism, or insurance claims at this property in the last 3 years? What carrier currently insures it and at what premium?
- What's the average days-on-market for RENTAL listings here right now (not sales)? A rising rental-DOM trend means longer vacancies and softer asking-rent achievability than the comps imply.
- What's the recent tenant-quality profile in this submarket — average credit score on applications, eviction rate, late-payment / NSF rate, and stable-employment percentage? A property-management company in the area should have these aggregated.
- How much new for-sale + rental construction is in the pipeline within 1–3 miles? Heavy new supply typically softens prices + rents 12–24 months out; constrained supply supports both.
Investment metrics
- 1% rule
- 1.15% ✓
- Cap rate
- 10.01%
- Cash-on-cash
- 13.28%
- DSCR
- 1.59
- GRM
- 7.3
CMA / ARV
- ARV (median comp)
- $72,041
- List price
- $115,000
- Delta
- 59.63%
- Verdict
- OVERPRICED
- Comps
- 20 within 1.0 mi
Show comp detail 12 sales within ~0.75 mi
| Address | Dist | Beds/Ba | Sqft | Sold | Price | $/sf | Match |
|---|---|---|---|---|---|---|---|
| 4428 Garfield Ave | 0.17mi | 3/1.0 | 800 (-4%) | 10mo | $75,000 | $94 | 77 |
| 4909 S Benton Ave | 0.61mi | 2/1.0 (-1) | 821 (-2%) | 5mo | $75,000 | $91 | 59 |
| 1406 E 45th St | 0.52mi | 3/1.0 | 928 (+11%) | 0mo | $129,000 | $139 | 57 |
| 4824 Agnes Ave | 0.60mi | 2/1.0 (-1) | 792 (-5%) | 4mo | $79,000 | $100 | 54 |
| 4144 Flora Ave | 0.68mi | 2/1.0 (-1) | 851 (+2%) | 9mo | $109,000 | $128 | 53 |
| 4308 Paseo Blvd | 0.64mi | 2/1.0 (-1) | 815 (-2%) | 10mo | $100,000 | $123 | 53 |
| 2010 E 48th Ter | 0.39mi | 2/1.0 (-1) | 759 (-9%) | 12mo | $134,000 | $177 | 52 |
| 2303 E 41st St E | 0.56mi | 2/1.0 (-1) | 918 (+10%) | 4mo | $80,000 | $87 | 50 |
| 4314 Paseo Blvd | 0.63mi | 3/2.0 | 908 (+9%) | 7mo | $109,500 | $121 | 47 |
| 4139 Flora Ave | 0.67mi | 2/1.0 (-1) | 894 (+7%) | 8mo | $79,900 | $89 | 46 |
| 1508 E 49th Ter | 0.65mi | 2/1.0 (-1) | 916 (+10%) | 4mo | $90,000 | $98 | 45 |
| 1537 E 50th St | 0.68mi | 2/1.0 (-1) | 910 (+9%) | 7mo | $110,000 | $121 | 43 |
Match score weights: distance 35% · size 25% · config 20% · recency 20%. Top-matched comps best support the ARV.
Projected returns pro-forma
-3.0% appreciation · 4.42% rent growth · sell at horizon
- IRR
- 4.7%
- Equity multiple
- 1.18×
- Total profit
- $5,922
- Equity at exit
- $17,147
- IRR
- 15.3%
- Equity multiple
- 2.31×
- Total profit
- $42,275
- Equity at exit
- $9,943
Cash invested: $32,200 (down + closing). Projections, not guarantees.
Landlord ↔ Tenant lean methodology
- Overall (STATE)
- 81 Strongly Landlord-Friendly
- State Missouri
- 81 Strongly Landlord-Friendly · R+10
- County
- — inherits STATE
- City
- — inherits STATE
ZIP-level market 64130
- Home prices YoY
- -21.5%
- Rents YoY
- 4.4%
- Active inventory
- 187
- Price-to-rent
- 7.3×
Monthly cashflow live
- Estimated rent
- $1,322 high interval (Pro) →
- Mortgage (P&I)
- −$603
- Tax from tax record
- −$37 /mo · $443/yr
- Insurance
- −$48
- HOA
- −$0
- Vacancy / Maint / Mgmt
- −$278
- Net cashflow
- $356
Break-even live
UW: 25.0% down · 7.5% · 30yr · 1.5% tax · 5.0% vac · 8.0% maint · 8.0% mgmt
Financing live
Cash to close
- Down payment
- $28,750
- Closing costs
- $3,450
- Reserves months
- —
- Total cash needed
- —
Loan-product check · same deal, 3 products live
Conventional
25% down · 7.5% · 30yr
- Down + closing
- —
- Monthly P&I
- —
- Monthly cashflow
- —
- DSCR
- —
- Eligible?
- —
Personal DTI + credit; lowest rate.
DSCR
20% down · 8.5% · 30yr
- Down + closing
- —
- Monthly P&I
- —
- Monthly cashflow
- —
- DSCR
- —
- Eligible?
- —
No personal income docs; deal must DSCR.
Hard money
10% down · 12.0% · 12mo
- Down + closing
- —
- Monthly P&I
- —
- Monthly cashflow
- —
- DSCR
- —
- Eligible?
- —
Short-term bridge; refi at stabilization.
Rent comps 40 comps
| Address | Beds | Baths | Sqft | Rent | $/sqft | DOM | Units | Dist |
|---|---|---|---|---|---|---|---|---|
| 4534 S Benton Ave Kansas City, MO | 2.0 | 1.0 | 912 | $1,045 | $1.15 | 16d | 1 | 0.37mi |
| 4401 Wayne Ave Kansas City, MO | 2.0 | 1.5 | 955 | $1,300 | $1.36 | 23d | 1 | 0.44mi |
| 4427 Agnes Ave Kansas City, MO | 3.0 | 1.0 | 1100 | $1,350 | $1.23 | 16d | 1 | 0.48mi |
| 1500 E 46th St Kansas City, MO | 1.0–3.0 | 1.0 | 803 | $1,275 | $1.59 | 43d | 1 | 0.48mi |
| 4930 Park Ave Kansas City, MO | 3.0 | 1.0 | 900 | $1,300 | $1.44 | 16d | 1 | 0.53mi |
| 2305 E 41st St Kansas City, MO | 2.0 | 1.0 | 750 | $1,000 | $1.33 | 7d | 1 | 0.54mi |
| 4209 Flora Ave Kansas City, MO | 2.0 | 1.0 | 778 | $1,200 | $1.54 | 16d | 1 | 0.62mi |
| 4911 S Benton Ave Kansas City, MO | 2.0 | 1.0 | 1000 | $1,100 | $1.10 | 17d | 1 | 0.63mi |
| 4917 S Benton Ave Kansas City, MO | 2.0 | 1.0 | 1000 | $1,100 | $1.10 | 23d | 1 | 0.64mi |
| 1214 Brush Creek Blvd Unit 03 Kansas City, MO | 2.0 | 1.0 | 950 | $1,050 | $1.11 | 17d | 1 | 0.69mi |
| 4309 College Ave Kansas City, MO | 3.0 | 2.0 | 1040 | $1,550 | $1.49 | 16d | 1 | 0.71mi |
| 5013 S Benton Ave Kansas City, MO | 3.0 | 1.0 | 978 | $1,225 | $1.25 | 23d | 1 | 0.73mi |
| 5114 Brooklyn Ave Kansas City, MO | 3.0 | 1.5 | 1116 | $1,300 | $1.16 | 7d | 1 | 0.74mi |
| 4144 College Ave Kansas City, MO | 3.0 | 1.0 | 1108 | $1,095 | $0.99 | 23d | 1 | 0.76mi |
| 3841 Olive St Kansas City, MO | 2.0 | 1.0 | 792 | $985 | $1.24 | 14d | 1 | 0.83mi |
| 4925 Tracy Ave Unit 1 Kansas City, MO | 2.0 | 1.0 | 1000 | $1,400 | $1.40 | 43d | 1 | 0.83mi |
| 3017 E 51st St Kansas City, MO | 2.0 | 1.0 | 621 | $1,303 | $2.10 | 7d | 1 | 0.87mi |
| 4119 Forest Ave Kansas City, MO | 2.0 | 1.0 | 950 | $1,400 | $1.47 | 12d | 1 | 0.87mi |
| 4154 Harrison St Kansas City, MO | 2.0 | 1.0 | 1100 | $1,395 | $1.27 | 43d | 1 | 0.98mi |
| 820 E 43rd St Kansas City, MO | 2.0 | 1.0 | 900 | $985 | $1.09 | 17d | 1 | 0.98mi |
| 4216 Cleveland Ave Kansas City, MO | 2.0 | 1.0 | 780 | $1,125 | $1.44 | 16d | 1 | 1.01mi |
| 4005 Bales Ave Kansas City, MO | 2.0 | 1.0 | 792 | $1,050 | $1.33 | 43d | 1 | 1.02mi |
| 4023 Harrison St Unit 40232-S Kansas City, MO | 2.0 | 1.0 | 850 | $1,250 | $1.47 | 23d | 1 | 1.05mi |
| 4023 Harrison St Unit 4021-2N Kansas City, MO | 2.0 | 1.0 | 850 | $1,295 | $1.52 | 23d | 1 | 1.05mi |
| 3710 Wabash Ave Unit 2S Kansas City, MO | 2.0 | 1.0 | 875 | $850 | $0.97 | 23d | 1 | 1.06mi |
| 3315 E 52nd St Kansas City, MO | 2.0 | 1.0 | 662 | $1,125 | $1.70 | 23d | 1 | 1.09mi |
| 5332 Highland Ave Kansas City, MO | 3.0 | 1.0 | 1022 | $1,350 | $1.32 | 7d | 1 | 1.09mi |
| 5410 Euclid Ave Kansas City, MO | 3.0 | 2.0 | 1119 | $1,395 | $1.25 | 43d | 1 | 1.12mi |
| 4013 Charlotte St Unit 1N Kansas City, MO | 2.0 | 1.0 | 900 | $1,200 | $1.33 | 23d | 1 | 1.16mi |
| 607 E 42nd St Kansas City, MO | 1.0–2.0 | 1.0 | 625 | $1,150 | $1.84 | 4d | 3 | 1.16mi |
| 4201 Kenwood Ave Kansas City, MO | 2.0 | 1.0 | 750 | $919 | $1.23 | 21d | 2 | 1.17mi |
| 918 E 39th St Kansas City, MO | 2.0 | 1.0 | 1050 | $1,175 | $1.12 | 43d | 1 | 1.19mi |
| 3609 Wayne Ave Kansas City, MO | 3.0 | 1.5 | 1118 | $1,900 | $1.70 | 23d | 1 | 1.21mi |
| 4028 Myrtle Ave Kansas City, MO | 3.0 | 1.0 | 1100 | $1,490 | $1.35 | 43d | 1 | 1.22mi |
| 3949 Doctor Martin Luther King Junior Blvd Kansas City, MO | 1.0–2.0 | 1.0–2.0 | 945 | $1,565 | $1.66 | 2d | 3 | 1.23mi |
| 5529 Michigan Ave Kansas City, MO | 2.0 | 1.0 | 847 | $995 | $1.17 | 43d | 1 | 1.29mi |
| 3933 Kenwood Ave Kansas City, MO | 2.0 | 2.0 | 1050 | $2,295 | $2.19 | 4d | 1 | 1.31mi |
| 406 E 43rd St Unit 3E Kansas City, MO | 2.0 | 1.0 | 1100 | $1,675 | $1.52 | 43d | 1 | 1.33mi |
| 3909 Kenwood Ave #1 Kansas City, MO | 2.0 | 1.0 | 875 | $1,295 | $1.48 | 7d | 1 | 1.34mi |
| 4308 Oak St Kansas City, MO | 2.0 | 1.0 | 531 | $1,600 | $3.01 | 3d | 1 | 1.34mi |
Listing history 36 events
-
2026-06-17days on market $115,000 Active 494 DOM
-
2026-06-16days on market $115,000 Active 493 DOM
-
2026-06-15days on market $115,000 Active 492 DOM
-
2026-06-13days on market $115,000 Active 490 DOM
-
2026-06-09days on market $115,000 Active 486 DOM
-
2026-06-08days on market $115,000 Active 485 DOM
-
2026-06-07days on market $115,000 Active 484 DOM
-
2026-06-05days on market $115,000 Active 481 DOM
-
2026-06-03days on market $115,000 Active 480 DOM
-
2026-06-02days on market $115,000 Active 479 DOM
-
2026-06-01days on market $115,000 Active 478 DOM
-
2026-05-31days on market $115,000 Active 477 DOM
-
2025-11-13price $115,000 396-char remark
Show marketing remark (396 chars)
REDUCED for Quick end of year Sale. ! Updated ranch with basement. New roof, furnace and central air, water heather and vinyl windows. There are 2 new decks in front and back of the home. Spacious living room has lots of natural light. Come see this 2 bedroom and 1 bathroom home on the same level. Enjoy inviting front porch and deck where you can relax and enjoy life. Easy access to highway.
-
2025-07-16price $129,900 396-char remark
Show marketing remark (396 chars)
REDUCED for Quick end of year Sale. ! Updated ranch with basement. New roof, furnace and central air, water heather and vinyl windows. There are 2 new decks in front and back of the home. Spacious living room has lots of natural light. Come see this 2 bedroom and 1 bathroom home on the same level. Enjoy inviting front porch and deck where you can relax and enjoy life. Easy access to highway.
-
2025-03-25price $139,900 396-char remark
Show marketing remark (396 chars)
REDUCED for Quick end of year Sale. ! Updated ranch with basement. New roof, furnace and central air, water heather and vinyl windows. There are 2 new decks in front and back of the home. Spacious living room has lots of natural light. Come see this 2 bedroom and 1 bathroom home on the same level. Enjoy inviting front porch and deck where you can relax and enjoy life. Easy access to highway.
-
2025-02-08$149,999 Active 396-char remark
Show marketing remark (396 chars)
REDUCED for Quick end of year Sale. ! Updated ranch with basement. New roof, furnace and central air, water heather and vinyl windows. There are 2 new decks in front and back of the home. Spacious living room has lots of natural light. Come see this 2 bedroom and 1 bathroom home on the same level. Enjoy inviting front porch and deck where you can relax and enjoy life. Easy access to highway.
-
2024-12-12historical
-
2024-10-29price $130,000
-
2024-09-05status Active
-
2024-08-17historical Active Under Contract
-
2024-08-16status Active
-
2024-08-14historical
-
2024-07-18price $144,900
-
2024-07-17$149,000 Active
-
2024-07-11historical
-
2024-06-16price $149,900
-
2024-05-13price $156,500
-
2024-03-22price $161,500
-
2024-01-31price $165,000
-
2024-01-24price $168,900
-
2023-10-20price $169,900
-
2023-09-29price $174,900
-
2023-09-08$179,900 Active
-
2023-07-31soldstatus
-
2007-06-15soldstatus
-
1986-11-17soldstatus
ⓘ Source: listings_history table (triggers on properties + properties_extension) + one-shot
backfill from property_details.listing_events for pre-trigger history.
Tax reassessment forecast MO · Resets to sale price
- Current annual tax
- $443 · $37/mo
- Projected year-2 tax
- $1,116 · $93/mo
- Expected delta
- +$673/yr (+$56/mo · 152.1%)
ⓘ Screening estimate from a state-policy table — verify with the county assessor before closing.
Climate risk First Street
- Flood 1/10 Low FEMA zone X (unshaded) · 0% chance over 30 yrs
- Wildfire 1/10 Low
- Heat 4/10 Moderate 7 d/yr ≥107°F today · 16 d/yr by 30 yrs out
- Wind 2/10 Low
- Air quality 3/10 Moderate 2 unhealthy d/yr today · 4 by 30 yrs out
Nearby sold comps map
Loading sold comps map…
Walkable amenities ~0.75 mi
Loading nearby amenities…
Taxation est. · year 1
- Rental income
- $15,860
- − Mortgage interest
- −$6,442
- − Property taxes
- −$443
- − Insurance
- −$575
- − Repairs & maintenance
- −$1,269
- − Management
- −$1,269
- − Depreciation
- −$3,345
- Taxable income
- $2,517
- Est. tax owed @ 24.0%
- −$604
- After-tax cash flow
- $3,671/yr
For passive investors: Depreciation is non-cash, so a rental often shows a tax loss while cash-flowing — sheltering income. Rental losses are passive: they offset passive income freely, and up to $25,000/yr can offset ordinary (W-2) income if you actively participate and your MAGI is under $100k (phasing out to $0 by $150k); unused losses carry forward. On sale, claimed depreciation is recaptured at up to 25%, and gains may owe capital-gains tax (a 1031 exchange can defer both). Figures are a year-1 estimate at your 24.0% rate — not tax advice; consult a CPA.
Schools (NCES district)
- District
- Kansas City 33
- NCES district ID
- 2916400
- Math proficiency
- 12% ▼ -8.00%
- Reading proficiency
- 24% ▬ 0.00%
- Median HH income
- $35,227
- Composite
- 14.8/100
- National rank
- #9387
- State rank
- #308 of 324 in MO
Livability — Kansas City
- Score
- 78/100
- State rank
- #28
- US rank
- #2671
Category grades
Schools grade is shown separately in the Schools card above.
Census & demographics
- Census place
- Kansas City, MO
- County
- Jackson County · 687,798 people
- City population
- 439,467
- Metro
- Kansas City, MO-KS
- Population (ZIP)
- 19,644
- Household income
- $42,221
- Rent vs Own
- Severe rent burden
- 1132.0
Population outlook (Jackson County) Hauer SSP2
- Today (2025)
- 719,589 people
- By 2030
- 731,456 · +1.6%
- By 2040
- 746,689 · +3.8%
- By 2050
- 749,289 · +4.1%
- By 2075
- 736,227 · +2.3%
- By 2100
- 668,210 · -7.1%
Race, ethnicity, and origin ACS 2023
- Neighborhood character
- Predominantly Black (80%)
- Race & ethnicity
- Black 80% White 9% Hispanic / Latino 8% Two or more races 6%
- Hispanic origin (detail)
- Mexican 5%
- Common ancestry
- Lithuanian 1% Swedish 0%
- Foreign-born
- 6% · Canada
- Languages at home
- 92% English-only · Spanish 7%
Political lean MEDSL · Jackson
- 2024 margin
- D (+19.3) · D 58.9% · R 39.5% · Other 1.6%
- 2008→2024 swing
- -6.1pp toward R · 2008: 25.4pp · 2024: 19.3pp
- All cycles
- 2024: D+19.3 2020: D+22.0 2016: D+16.6 2012: D+19.0 2008: D+25.4
Not yet ingested
- Civics
- —
Market trends
- HPI YoY
- ▼ -73.32%
- Current HPI
- 267.491
- Rent YoY
- ▲ 4.42%
- Metro
- Kansas City, MO-KS
- State GDP YoY
- ▲ 1.84%
- F500 in state
- 20
Industry mix (Fortune 500 HQ in MO)
| Industry | F500 HQs | Revenue |
|---|---|---|
| Healthcare | 1 | $163B |
|
||
| Insurance | 1 | $21B |
|
||
| Industrial Technology | 1 | $17B |
|
||
| Retail | 1 | $16B |
|
||
| Industrial Distribution | 1 | $10B |
|
||
| Utilities | 1 | $9B |
|
||
Price history
-36.1% since first listed24 events — show timeline
- 2025-11-13 Price Changed $115,000 Heartland MLS as Distributed by MLS Grid
- 2025-07-16 Price Changed $129,900 Heartland MLS as Distributed by MLS Grid
- 2025-03-25 Price Changed $139,900 Heartland MLS as Distributed by MLS Grid
- 2025-02-08 Listed $149,999 Heartland MLS as Distributed by MLS Grid
- 2024-12-12 Listing Removed — Heartland MLS as Distributed by MLS Grid
- 2024-10-29 Price Changed $130,000 Heartland MLS as Distributed by MLS Grid
- 2024-09-05 Relisted — Heartland MLS as Distributed by MLS Grid
- 2024-08-17 Contingent — Heartland MLS as Distributed by MLS Grid
- 2024-08-16 Relisted — Heartland MLS as Distributed by MLS Grid
- 2024-08-14 Listing Removed — Heartland MLS as Distributed by MLS Grid
- 2024-07-18 Price Changed $144,900 Heartland MLS as Distributed by MLS Grid
- 2024-07-17 Listed $149,000 Heartland MLS as Distributed by MLS Grid
- 2024-07-11 Listing Removed — Heartland MLS as Distributed by MLS Grid
- 2024-06-16 Price Changed $149,900 Heartland MLS as Distributed by MLS Grid
- 2024-05-13 Price Changed $156,500 Heartland MLS as Distributed by MLS Grid
- 2024-03-22 Price Changed $161,500 Heartland MLS as Distributed by MLS Grid
- 2024-01-31 Price Changed $165,000 Heartland MLS as Distributed by MLS Grid
- 2024-01-24 Price Changed $168,900 Heartland MLS as Distributed by MLS Grid
- 2023-10-20 Price Changed $169,900 Heartland MLS as Distributed by MLS Grid
- 2023-09-29 Price Changed $174,900 Heartland MLS as Distributed by MLS Grid
- 2023-09-08 Listed $179,900 Heartland MLS as Distributed by MLS Grid
- 2023-07-31 Sold (Public Records) — Public Records
- 2007-06-15 Sold (Public Records) — Public Records
- 1986-11-17 Sold (Public Records) — Public Records
Property tax history
+6.3%/yrLatest (2025): $443 · -42.2% YoY. Source: county tax records.
Cash-flow waterfall
monthlySold comps — $/sqft
last 12 mo · ≤1 miLoading sold comps…