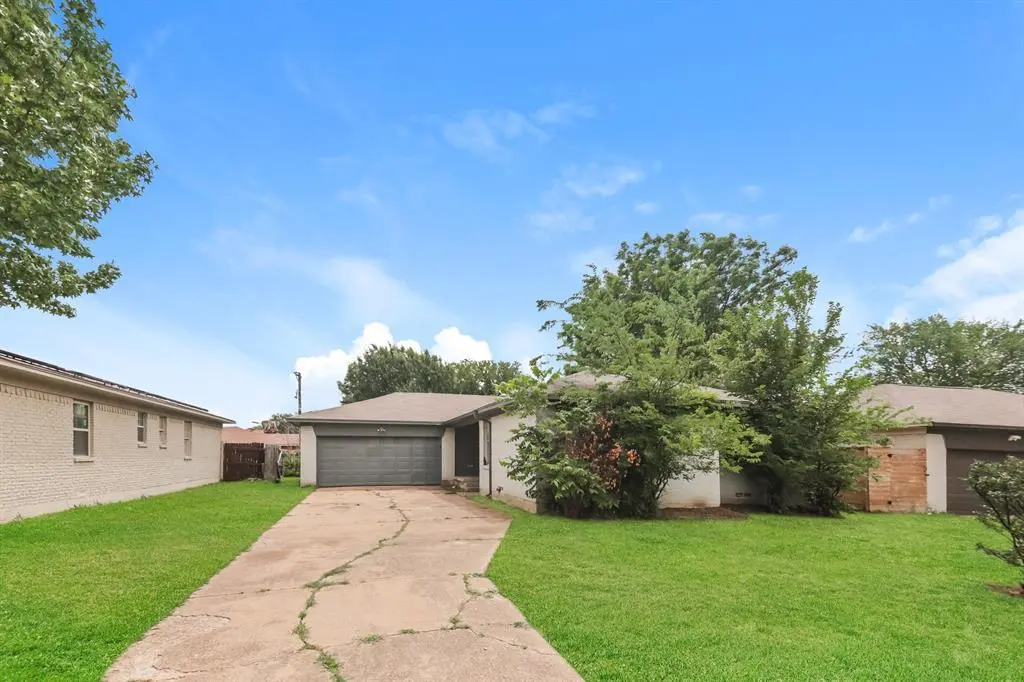
1718 Joan Dr · Dallas, TX
Flood risk 1/10 · Minimal
- FEMA flood zone
- X (unshaded)
- Chance of flooding over 30 yrs
- 0.0%
- Est. flood insurance / yr
- $507 – $1,088
Fire risk 3/10 · Minor
- Est. fire insurance / yr
- $1,222 – $2,270
Heat risk 7/10 · Major
- Hot days now (above 109°F)
- 7 days/yr
- Hot days in 30 yrs
- 25 days/yr
Wind risk 6/10 · Moderate
- Chance of severe wind over 30 yrs
- 27.0%
Air-quality risk 2/10 · Minimal
- Unhealthy air days now
- 1 days/yr
- Unhealthy air days in 30 yrs
- 2 days/yr
Risk factors via First Street. Map © Google.
Why this score? — see what drove the D- grade
The composite is a weighted blend of 9 inputs, each scored 0–100. Each bar is that input's sub-score; the figure is the points it added to the 100-point composite (weight × sub-score).
- ARV discount +10.7/15.0
- Cash flow +7.9/30.0
- Livability +4.0/5.0
- 1% rule +3.3/10.0
- Rent growth +2.8/5.0
- Schools +2.8/10.0
- Condition / age +2.5/5.0
- DSCR +1.9/10.0
- Appreciation +0.0/10.0
$222,200
🖨 Deal sheet 📄 Offer letter ✓ Due diligence
Listing remarks MLS
Investor special!! Currently leased for $895 through December 2011.Nice 3 bedroom, 2 bath with 2 car garage located near Jim Miller and Lake June Rd. with easy access to C F Hawn within walking distance of elementary school and about a mile to Lake June DART station has been freshly painted features a large den plus formal living and dining areas, spacious kitchen with gas stove, wood floors throughout, ceiling fans and fenced, tree shaded yard.
Key facts
- Fenced yard
- Tree shaded yard
- Spacious kitchen
Tags
Property features AI
Finance
- Other: Possession at closing/funding; Listing status: Active
- Financial info: Listing accepts Cash, Conventional, FHA, and VA financing
- HOA & community: No association
Exterior
- Parking: Attached garage; 2 covered garage spaces
- Security: Not specified
- Utilities: City water; City sewer; Electricity connected; Natural gas available; Sewer available
- Home design: Single-family residence; Residential property; One story
- Construction: Built in 1957
- Exterior features: Lot less than 0.5 acre; Lot approximately 0.171 acre; Subdivision: Hillburn Park 04; Directions: North on Jim Miller from Lake June, right on Umphress, left on Joan
Interior
- Kitchen: Dishwasher; Electric cooktop; Electric oven; Microwave; Refrigerator
- Bedrooms: Primary bedroom (1st level) — approx. 16 x 13; Bedroom (1st level) — approx. 12 x 10
- Flooring: Not specified
- Bathrooms: 2 full bathrooms
- Heating & cooling: Not specified
- Interior features: Open living area; One living area and one dining area; Other interior features
- Laundry & utility: No specific laundry appliances listed
Neighborhood map
What this means for you Summary
Snapshot
- This is a 3-bed/2.0-bath single-family listed at $222k.
Deal economics
- At list price, monthly cash flow is $-241 ($-3k/yr) — negative.
- To cash-flow at today's rent, offer at most $180k (19.2% below list).
- To meet the 1% rule (rent ≥ 1% of price), the offer needs to be $184k (17.3% below list).
- Recommended offer: $180k (19.2% below list) — sets the bar for cash-flow.
- Cap rate 5.0% vs local median 2.3% in Dallas — top-decile yield for the area; either an underpriced asset or a hidden risk that comps aren't pricing in. Stress-test before assuming the spread holds.
Location & tenants
- Location reads 81/100 on livability (#24 in TX, #1,380 nationally) — a professional / high-income tenant draw. Strengths: amenities A+, commute A+, housing A+; Watch: schools C-, crime F.
- Dallas ISD (urban): math 31% / reading 36% proficiency, ranked #559 of 826 in TX (top 68%) — families likely to look elsewhere, expect single-tenant / working-renter base with shorter leases; 83% free/reduced lunch — lower-income household profile, screen leases tightly.
- Market conditions: Rents rising (+1.0%/yr); 198 active listings in the ZIP; 12 comparable units currently listed for rent nearby; rentals at typical pace (median 21d on market — plan ~3-4 weeks tenant-placement turnaround); 12,577 units permitted in Dallas County in 2024 (6,829 in 5+ unit buildings).
- This rent runs 40% of the median local income ($56k/yr) — at the standard rent-burdened threshold; future hikes will face affordability resistance.
Forward outlook
- Local home prices are declining (-3.0%/yr); year-one equity from $2k of loan paydown is wiped out by about $7k of value loss. Plan a longer hold.
- Dallas County population projected at +35% by 2050 — long-run rental-demand tailwind backs the buy-and-hold thesis.
Negotiation context
- It's been on market 45 days — a 3% lower offer ($216k) is reasonable based on typical stale-listing flexibility.
- 2 sale attempts since 16y ago with the ask held roughly flat each time — persistent listings suggest the price (not the market) is what's stuck; bring a comps-based counter.
Risks & watch-outs
- Watch-outs: built in 1957 — expect roof / HVAC / electrical / plumbing capex.
- Climate carrying-cost: major wind risk, 27% chance of damaging wind over 30y; extreme-heat days projected 7→25/yr by 2055 (HVAC capex compounding) — expect insurance premiums to compound above CPI over the hold.
Questions for the listing agent
- What do current leases actually rent for vs. the listed asking? Can we see a recent rent roll and the last 12 months of T-12 income?
- It's been on market 45 days. Have you received any prior offers? Is the seller open to a 19% concession, seller financing, or rate buy-down credit?
- Built in 1957 — when were the roof, HVAC, electrical panel, plumbing, and water heater last replaced?
- Is there a deadline driving the sale (1031 exchange, divorce, estate, relocation)? That informs how much negotiation room exists.
- Crime grade is F in this area — have there been break-ins, vandalism, or insurance claims at this property in the last 3 years? What carrier currently insures it and at what premium?
- The area grade is low — what's the realistic commute time and amenity access for the typical tenant pool here? Any planned neighborhood developments (good or bad) we should know about?
- What's the average days-on-market for RENTAL listings here right now (not sales)? A rising rental-DOM trend means longer vacancies and softer asking-rent achievability than the comps imply.
- What's the recent tenant-quality profile in this submarket — average credit score on applications, eviction rate, late-payment / NSF rate, and stable-employment percentage? A property-management company in the area should have these aggregated.
- How much new for-sale + rental construction is in the pipeline within 1–3 miles? Heavy new supply typically softens prices + rents 12–24 months out; constrained supply supports both.
Investment metrics
- 1% rule
- 0.83% ✗
- Cap rate
- 4.99%
- Cash-on-cash
- -4.65%
- DSCR
- 0.79
- GRM
- 10.1
CMA / ARV
- ARV (median comp)
- $239,419
- List price
- $222,200
- Delta
- -7.19%
- Verdict
- FAIR
- Comps
- 20 within 1.0 mi
Show comp detail 12 sales within ~0.75 mi
| Address | Dist | Beds/Ba | Sqft | Sold | Price | $/sf | Match |
|---|---|---|---|---|---|---|---|
| 1905 Houghton Rd | 0.23mi | 3/2.0 | 1,322 (-7%) | 0mo | $249,000 | $188 | 76 |
| 2036 Gaylord Dr | 0.53mi | 3/2.0 | 1,446 (+1%) | 3mo | $265,000 | $183 | 71 |
| 1445 Templecliff Dr | 0.47mi | 3/2.0 | 1,360 (-5%) | 1mo | $240,000 | $176 | 70 |
| 1937 Earnhardt Way | 0.39mi | 3/2.0 | 1,544 (+8%) | 2mo | $265,000 | $172 | 67 |
| 1925 Bodine Ln | 0.45mi | 3/2.0 | 1,540 (+8%) | 1mo | $242,500 | $157 | 65 |
| 1332 Gaylord Dr | 0.49mi | 4/2.0 (+1) | 1,488 (+4%) | 2mo | $239,998 | $161 | 63 |
| 7220 Amy St | 0.23mi | 4/2.0 (+1) | 1,564 (+10%) | 8mo | $265,000 | $169 | 61 |
| 2215 Mack Ln | 0.68mi | 3/2.0 | 1,480 (+4%) | 2mo | $285,000 | $193 | 60 |
| 7328 Ravehill Ln | 0.75mi | 2/1.5 (-1) | 1,432 (+0%) | 2mo | $159,000 | $111 | 56 |
| 7810 Dugan St | 0.60mi | 2/2.0 (-1) | 1,308 (-8%) | 6mo | $199,990 | $153 | 48 |
| 6702 Umphress Rd | 0.54mi | 4/2.0 (+1) | 1,629 (+14%) | 1mo | $275,000 | $169 | 45 |
| 2210 Gaylord Dr | 0.74mi | 4/3.0 (+1) | 1,221 (-14%) | 3mo | $285,000 | $233 | 30 |
Match score weights: distance 35% · size 25% · config 20% · recency 20%. Top-matched comps best support the ARV.
Projected returns pro-forma
-3.0% appreciation · 1.02% rent growth · sell at horizon
- IRR
- -26.6%
- Equity multiple
- 0.12×
- Total profit
- $-54,814
- Equity at exit
- $33,131
- IRR
- -33.3%
- Equity multiple
- -0.30×
- Total profit
- $-81,137
- Equity at exit
- $19,212
Cash invested: $62,216 (down + closing). Projections, not guarantees.
Landlord ↔ Tenant lean methodology
- Overall (STATE)
- 87 Strongly Landlord-Friendly
- State Texas
- 87 Strongly Landlord-Friendly · R+5
- County
- — inherits STATE
- City
- — inherits STATE
ZIP-level market 75217
- Home prices YoY
- -4.3%
- Rents YoY
- 1.0%
- Active inventory
- 198
- Price-to-rent
- 10.1×
Monthly cashflow live
- Estimated rent
- $1,837 high interval (Pro) →
- Mortgage (P&I)
- −$1,165
- Tax from tax record
- −$435 /mo · $5,214/yr
- Insurance
- −$93
- HOA
- −$0
- Vacancy / Maint / Mgmt
- −$386
- Net cashflow
- $-241
Break-even live
UW: 25.0% down · 7.5% · 30yr · 1.5% tax · 5.0% vac · 8.0% maint · 8.0% mgmt
Financing live
Cash to close
- Down payment
- $55,550
- Closing costs
- $6,666
- Reserves months
- —
- Total cash needed
- —
Loan-product check · same deal, 3 products live
Conventional
25% down · 7.5% · 30yr
- Down + closing
- —
- Monthly P&I
- —
- Monthly cashflow
- —
- DSCR
- —
- Eligible?
- —
Personal DTI + credit; lowest rate.
DSCR
20% down · 8.5% · 30yr
- Down + closing
- —
- Monthly P&I
- —
- Monthly cashflow
- —
- DSCR
- —
- Eligible?
- —
No personal income docs; deal must DSCR.
Hard money
10% down · 12.0% · 12mo
- Down + closing
- —
- Monthly P&I
- —
- Monthly cashflow
- —
- DSCR
- —
- Eligible?
- —
Short-term bridge; refi at stabilization.
Rent comps 12 comps
| Address | Beds | Baths | Sqft | Rent | $/sqft | DOM | Units | Dist |
|---|---|---|---|---|---|---|---|---|
| 1959 Hillburn Dr Dallas, TX | 3.0 | 1.0 | 912 | $1,700 | $1.86 | 6d | 1 | 0.42mi |
| 1355 N Jim Miller Rd Unit 23 Dallas, TX | 2.0 | 1.5 | 953 | $1,100 | $1.15 | 3d | 1 | 0.52mi |
| 1355 N Jim Miller Rd Unit 121 Dallas, TX | 3.0 | 1.5 | 1169 | $1,250 | $1.07 | 3d | 1 | 0.52mi |
| 1315 Whitley Dr Unit 1 Dallas, TX | 2.0 | 1.0 | 1050 | $1,600 | $1.52 | 43d | 1 | 0.55mi |
| 2104 Hillburn Dr Dallas, TX | 3.0 | 1.5 | 1324 | $1,850 | $1.40 | 15d | 1 | 0.59mi |
| 1246 Lonsdale Ave Dallas, TX | 3.0 | 2.5 | 1501 | $2,050 | $1.37 | 20d | 1 | 0.73mi |
| 1244 Lonsdale Ave Dallas, TX | 3.0 | 2.5 | 1501 | $2,120 | $1.41 | 20d | 1 | 0.74mi |
| 1201 Rose Garden Ave Dallas, TX | 3.0 | 2.0 | 1472 | $1,750 | $1.19 | 43d | 1 | 0.88mi |
| 8127 Stonehurst St #5 Dallas, TX | 2.0 | 1.0 | 1050 | $1,250 | $1.19 | 43d | 1 | 0.89mi |
| 7632 Livvie Meador Ln Dallas, TX | 4.0 | 2.0 | 1719 | $2,300 | $1.34 | 43d | 1 | 0.97mi |
| 2423 Lolita Dr Dallas, TX | 3.0 | 2.0 | 1040 | $1,650 | $1.59 | 3d | 1 | 1.30mi |
| 758 Bethpage Ave Dallas, TX | 4.0 | 2.0 | 1484 | $1,975 | $1.33 | 7d | 1 | 1.33mi |
Listing history 21 events
-
2026-06-18days on market $222,200 Active 45 DOM
-
2026-06-17days on market $222,200 Active 44 DOM
-
2026-06-16days on market $222,200 Active 43 DOM
-
2026-06-15days on market $222,200 Active 42 DOM
-
2026-06-13days on market $222,200 Active 40 DOM
-
2026-06-09days on market $222,200 Active 36 DOM
-
2026-06-08days on market $222,200 Active 35 DOM
-
2026-06-07days on market $222,200 Active 34 DOM
-
2026-06-04days on market $222,200 Active 31 DOM
-
2026-06-03days on market $222,200 Active 30 DOM
-
2026-06-02pricedays on market $222,200 Active 29 DOM
-
2026-06-01days on market $225,600 Active 28 DOM
-
2026-05-31days on market $225,600 Active 27 DOM
-
2026-05-04$229,000 Active 349-char remark
-
2022-11-09historical
-
2021-10-25soldstatus
-
2011-04-27soldstatus
-
2011-04-25soldstatus Closed 449-char remark
Show marketing remark (449 chars)
Investor special!! Currently leased for $895 through December 2011.Nice 3 bedroom, 2 bath with 2 car garage located near Jim Miller and Lake June Rd. with easy access to C F Hawn within walking distance of elementary school and about a mile to Lake June DART station has been freshly painted features a large den plus formal living and dining areas, spacious kitchen with gas stove, wood floors throughout, ceiling fans and fenced, tree shaded yard.
-
2011-04-14status Pending 449-char remark
Show marketing remark (449 chars)
Investor special!! Currently leased for $895 through December 2011.Nice 3 bedroom, 2 bath with 2 car garage located near Jim Miller and Lake June Rd. with easy access to C F Hawn within walking distance of elementary school and about a mile to Lake June DART station has been freshly painted features a large den plus formal living and dining areas, spacious kitchen with gas stove, wood floors throughout, ceiling fans and fenced, tree shaded yard.
-
2010-11-09$57,000 Active 449-char remark
Show marketing remark (449 chars)
Investor special!! Currently leased for $895 through December 2011.Nice 3 bedroom, 2 bath with 2 car garage located near Jim Miller and Lake June Rd. with easy access to C F Hawn within walking distance of elementary school and about a mile to Lake June DART station has been freshly painted features a large den plus formal living and dining areas, spacious kitchen with gas stove, wood floors throughout, ceiling fans and fenced, tree shaded yard.
-
2007-06-13soldstatus
ⓘ Source: listings_history table (triggers on properties + properties_extension) + one-shot
backfill from property_details.listing_events for pre-trigger history.
Tax reassessment forecast TX · Resets to sale price
- Current annual tax
- $5,214 · $435/mo
- Projected year-2 tax
- $5,214 · $435/mo
- Expected delta
- $0/yr ($0/mo · 0.0%)
ⓘ Screening estimate from a state-policy table — verify with the county assessor before closing.
Climate risk First Street
- Flood 1/10 Low FEMA zone X (unshaded) · 0% chance over 30 yrs
- Wildfire 3/10 Moderate
- Heat 7/10 Severe 7 d/yr ≥109°F today · 25 d/yr by 30 yrs out
- Wind 6/10 Major 27% chance of damaging wind over 30 yrs
- Air quality 2/10 Low 1 unhealthy d/yr today · 2 by 30 yrs out
Nearby sold comps map
Loading sold comps map…
Walkable amenities ~0.75 mi
Loading nearby amenities…
Taxation est. · year 1
- Rental income
- $22,047
- − Mortgage interest
- −$12,447
- − Property taxes
- −$5,214
- − Insurance
- −$1,111
- − Repairs & maintenance
- −$1,764
- − Management
- −$1,764
- − Depreciation
- −$6,464
- Taxable loss
- −$6,716
- Est. tax savings @ 24.0%
- +$1,612
- After-tax cash flow
- $-1,279/yr
For passive investors: Depreciation is non-cash, so a rental often shows a tax loss while cash-flowing — sheltering income. Rental losses are passive: they offset passive income freely, and up to $25,000/yr can offset ordinary (W-2) income if you actively participate and your MAGI is under $100k (phasing out to $0 by $150k); unused losses carry forward. On sale, claimed depreciation is recaptured at up to 25%, and gains may owe capital-gains tax (a 1031 exchange can defer both). Figures are a year-1 estimate at your 24.0% rate — not tax advice; consult a CPA.
Schools (NCES district)
- District
- Dallas ISD
- NCES district ID
- 4816230
- Math proficiency
- 31% ▼ -16.00%
- Reading proficiency
- 36% ▼ -4.00%
- Median HH income
- $42,881
- Composite
- 28.41/100
- National rank
- #6763
- State rank
- #559 of 826 in TX
Livability — Dallas
- Score
- 81/100
- State rank
- #24
- US rank
- #1380
Category grades
Schools grade is shown separately in the Schools card above.
Census & demographics
- Census place
- Dallas, TX
- County
- Dallas County · 2,612,404 people
- City population
- 1,168,437
- Metro
- Dallas-Fort Worth-Arlington, TX
- Population (ZIP)
- 85,028
- Household income
- $55,723
- Rent vs Own
- Severe rent burden
- 2649.0
Population outlook (Dallas County) Hauer SSP2
- Today (2025)
- 2,979,839 people
- By 2030
- 3,191,823 · +7.1%
- By 2040
- 3,619,611 · +21.5%
- By 2050
- 4,026,915 · +35.1%
- By 2075
- 4,957,073 · +66.4%
- By 2100
- 5,508,725 · +84.9%
Race, ethnicity, and origin ACS 2023
- Neighborhood character
- Predominantly Hispanic (73%)
- Race & ethnicity
- Hispanic / Latino 73% Two or more races 34% Black 20% White 6%
- Hispanic origin (detail)
- Mexican 68%
- Foreign-born
- 30% · Canada, Philippines
- Languages at home
- 34% English-only · Spanish 65% Other Asian/Pacific 1%
Political lean MEDSL · Dallas
- 2024 margin
- Strong D (+22.2) · D 60.2% · R 38.0% · Other 1.8%
- 2008→2024 swing
- +6.9pp toward D · 2008: 15.3pp · 2024: 22.2pp
- All cycles
- 2024: D+22.2 2020: D+31.6 2016: D+26.2 2012: D+15.4 2008: D+15.3
Not yet ingested
- Civics
- —
Market trends
- HPI YoY
- ▼ -17.04%
- Current HPI
- 382.5527
- Rent YoY
- ▲ 1.02%
- Metro
- Dallas-Fort Worth-Arlington, TX
- State GDP YoY
- ▲ 3.95%
- F500 in state
- 110
Industry mix (Fortune 500 HQ in TX)
| Industry | F500 HQs | Revenue |
|---|---|---|
| Energy | 16 | $1,198B |
|
||
| Technology | 5 | $198B |
|
||
| Engineering / Construction | 4 | $72B |
|
||
| Energy Services | 3 | $60B |
|
||
| Utilities | 3 | $41B |
|
||
| Healthcare | 2 | $330B |
|
||
Price history
+289.8% since first listed10 events — show timeline
- 2026-06-02 Price Changed $222,200 NTREIS
- 2026-05-22 Price Changed $225,600 NTREIS
- 2026-05-04 Listed $229,000 NTREIS
- 2022-11-09 Rental Removed — RENT.
- 2021-10-25 Sold (Public Records) — Public Records
- 2011-04-27 Sold (Public Records) — Public Records
- 2011-04-25 Sold (MLS) — NTREIS
- 2011-04-14 Pending — NTREIS
- 2010-11-09 Listed $57,000 NTREIS
- 2007-06-13 Sold (Public Records) — Public Records
Property tax history
+9.6%/yrLatest (2025): $5,214 · -0.4% YoY. Source: county tax records.
Cash-flow waterfall
monthlySold comps — $/sqft
last 12 mo · ≤1 miLoading sold comps…