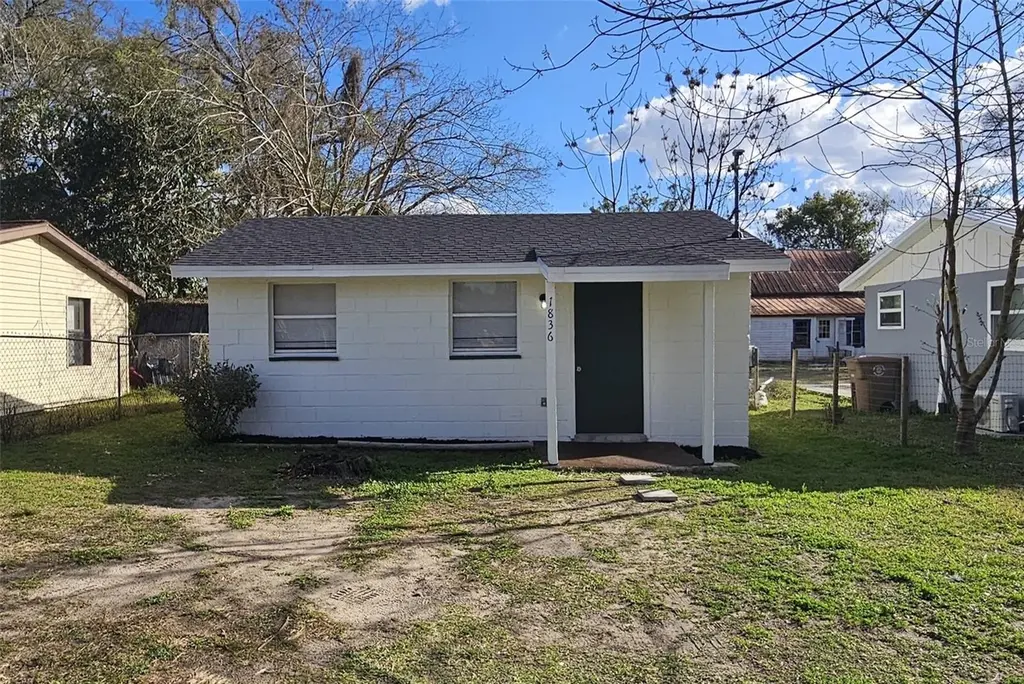
1836 NW 2nd St · Ocala, FL
Flood risk 1/10 · Minimal
- FEMA flood zone
- X (unshaded)
- Chance of flooding over 30 yrs
- 0.0%
- Est. flood insurance / yr
- $507 – $1,088
Fire risk 1/10 · Minimal
- Est. fire insurance / yr
- $947 – $1,759
Heat risk 8/10 · Major
- Hot days now (above 107°F)
- 7 days/yr
- Hot days in 30 yrs
- 22 days/yr
Wind risk 9/10 · Severe
- Chance of severe wind over 30 yrs
- 99.0%
Air-quality risk 3/10 · Minor
- Unhealthy air days now
- 3 days/yr
- Unhealthy air days in 30 yrs
- 3 days/yr
Risk factors via First Street. Map © Google.
Why this score? — see what drove the C grade
The composite is a weighted blend of 9 inputs, each scored 0–100. Each bar is that input's sub-score; the figure is the points it added to the 100-point composite (weight × sub-score).
- Cash flow +25.3/30.0
- DSCR +8.3/10.0
- ARV discount +7.5/15.0
- 1% rule +5.9/10.0
- Schools +3.6/10.0
- Livability +3.5/5.0
- Rent growth +2.5/5.0
- Condition / age +2.5/5.0
- Appreciation +0.0/10.0
$99,000
🖨 Deal sheet 📄 Offer letter ✓ Due diligence
Listing remarks MLS
YOU'VE FOUND YOUR NEXT INVESTMENT - OR THE PERFECT DOWNSIZE! This efficient 2-bedrooms, 1-bath, home offers functional living with major updates already done (roof, kitchen, water heater, and more) - meaning less worry and more return, or more enjoyment. The 40x100 lot gives you room to expand, entertain, or increase value over time. Opportunities in this highly active part of Downtown Ocala don't sit long - keep expenses low while positioning yourself in a growing area. And yes - No HOA. Schedule your showing before someone else does.
Key facts
- Major updates
- 40x100 lot
- No hoa
Tags
Neighborhood map
What this means for you Summary
Snapshot
- This is a 2-bed/1.0-bath single-family listed at $99k.
Deal economics
- At list price, monthly cash flow is $225 ($3k/yr) — positive.
- The deal already cash-flows at list — no discount required.
- Meets the 1% rule at list price ($1k rent vs $99k).
- Recommended offer: $93k (6.0% below list) — sets the bar for market timing.
- Cap rate 9.0% vs local median 4.2% in Ocala — top-decile yield for the area; either an underpriced asset or a hidden risk that comps aren't pricing in. Stress-test before assuming the spread holds.
Location & tenants
- Location reads 69/100 on livability (#476 in FL) — a middle-class / working-renter tenant base. Strengths: cost of living A+, housing A+, health & safety A+; Watch: crime F, amenities F, commute F.
- Marion (rural): math 42% / reading 43% proficiency, ranked #61 of 73 in FL (top 84%) — families likely to look elsewhere, expect single-tenant / working-renter base with shorter leases; 61% free/reduced lunch — lower-income household profile, screen leases tightly.
- Market conditions: 199 active listings in the ZIP; lower-income renter base — watch delinquency; 7,071 units permitted in Marion County in 2024 (534 in 5+ unit buildings).
- This rent runs 43% of the median local income ($30k/yr) — at the standard rent-burdened threshold; future hikes will face affordability resistance.
Forward outlook
- Local home prices are declining (-3.0%/yr); year-one equity from $684 of loan paydown is wiped out by about $3k of value loss. Plan a longer hold.
- Marion County population projected at +13% by 2050 — modest demand growth; plan on rents tracking national, not racing it.
Negotiation context
- It's been on market 83 days — a 6% lower offer ($93k) is reasonable based on typical stale-listing flexibility.
- 6 sale attempts since 22y ago; this cycle's ask has dropped $26k (21%) from the opening price — seller is motivated, your offer sets the floor, not the list.
- Current owner paid $63k; list at $99k implies a 57% gain — meaningful room to come down on a strong offer.
Risks & watch-outs
- Watch-outs: built in 1958 — expect roof / HVAC / electrical / plumbing capex.
- Climate carrying-cost: severe wind risk, 99% chance of damaging wind over 30y; extreme-heat days projected 7→22/yr by 2055 (HVAC capex compounding) — expect insurance premiums to compound above CPI over the hold.
Questions for the listing agent
- It's been on market 83 days. Have you received any prior offers? Is the seller open to a 6% concession, seller financing, or rate buy-down credit?
- Built in 1958 — when were the roof, HVAC, electrical panel, plumbing, and water heater last replaced?
- Why hasn't it sold? Are there any deal-killer items the seller is aware of (foundation, flood, title, zoning, code violations)?
- Is there a deadline driving the sale (1031 exchange, divorce, estate, relocation)? That informs how much negotiation room exists.
- Crime grade is F in this area — have there been break-ins, vandalism, or insurance claims at this property in the last 3 years? What carrier currently insures it and at what premium?
- What's the average days-on-market for RENTAL listings here right now (not sales)? A rising rental-DOM trend means longer vacancies and softer asking-rent achievability than the comps imply.
- What's the recent tenant-quality profile in this submarket — average credit score on applications, eviction rate, late-payment / NSF rate, and stable-employment percentage? A property-management company in the area should have these aggregated.
- How much new for-sale + rental construction is in the pipeline within 1–3 miles? Heavy new supply typically softens prices + rents 12–24 months out; constrained supply supports both.
Investment metrics
- 1% rule
- 1.09% ✓
- Cap rate
- 9.02%
- Cash-on-cash
- 9.75%
- DSCR
- 1.43
- GRM
- 7.6
CMA / ARV
- ARV (median comp)
- $54,285
- List price
- $99,000
- Delta
- 82.37%
- Verdict
- OVERPRICED
- Comps
- 3 within 1.0 mi
Projected returns pro-forma
-3.0% appreciation · 3.0% rent growth · sell at horizon
- IRR
- -1.6%
- Equity multiple
- 0.94×
- Total profit
- $-1,714
- Equity at exit
- $14,761
- IRR
- 8.0%
- Equity multiple
- 1.61×
- Total profit
- $16,908
- Equity at exit
- $8,560
Cash invested: $27,720 (down + closing). Projections, not guarantees.
Landlord ↔ Tenant lean methodology
- Overall (STATE)
- 87 Strongly Landlord-Friendly
- State Florida
- 87 Strongly Landlord-Friendly · R+3
- County
- — inherits STATE
- City
- — inherits STATE
ZIP-level market 34475
- Home prices YoY
- -8.0%
- Active inventory
- 199
- Price-to-rent
- 7.6×
Monthly cashflow live
- Estimated rent
- $1,081 medium interval (Pro) →
- Mortgage (P&I)
- −$519
- Tax from tax record
- −$68 /mo · $822/yr
- Insurance
- −$41
- HOA
- −$0
- Vacancy / Maint / Mgmt
- −$227
- Net cashflow
- $225
Break-even live
UW: 25.0% down · 7.5% · 30yr · 1.5% tax · 5.0% vac · 8.0% maint · 8.0% mgmt
Financing live
Cash to close
- Down payment
- $24,750
- Closing costs
- $2,970
- Reserves months
- —
- Total cash needed
- —
Loan-product check · same deal, 3 products live
Conventional
25% down · 7.5% · 30yr
- Down + closing
- —
- Monthly P&I
- —
- Monthly cashflow
- —
- DSCR
- —
- Eligible?
- —
Personal DTI + credit; lowest rate.
DSCR
20% down · 8.5% · 30yr
- Down + closing
- —
- Monthly P&I
- —
- Monthly cashflow
- —
- DSCR
- —
- Eligible?
- —
No personal income docs; deal must DSCR.
Hard money
10% down · 12.0% · 12mo
- Down + closing
- —
- Monthly P&I
- —
- Monthly cashflow
- —
- DSCR
- —
- Eligible?
- —
Short-term bridge; refi at stabilization.
Listing history 34 events
-
2026-06-18days on market $99,000 Active 83 DOM
-
2026-06-17days on market $99,000 Active 82 DOM
-
2026-06-16days on market $99,000 Active 81 DOM
-
2026-06-15days on market $99,000 Active 80 DOM
-
2026-06-14days on market $99,000 Active 78 DOM
-
2026-06-13pricestatusdays on market $99,000 Active 77 DOM
-
2026-05-18status Pending 542-char remark
Show marketing remark (542 chars)
YOU'VE FOUND YOUR NEXT INVESTMENT - OR THE PERFECT DOWNSIZE! This efficient 2-bedrooms, 1-bath, home offers functional living with major updates already done (roof, kitchen, water heater, and more) - meaning less worry and more return, or more enjoyment. The 40x100 lot gives you room to expand, entertain, or increase value over time. Opportunities in this highly active part of Downtown Ocala don't sit long - keep expenses low while positioning yourself in a growing area. And yes - No HOA. Schedule your showing before someone else does.
-
2026-05-11price $90,000 542-char remark
Show marketing remark (542 chars)
YOU'VE FOUND YOUR NEXT INVESTMENT - OR THE PERFECT DOWNSIZE! This efficient 2-bedrooms, 1-bath, home offers functional living with major updates already done (roof, kitchen, water heater, and more) - meaning less worry and more return, or more enjoyment. The 40x100 lot gives you room to expand, entertain, or increase value over time. Opportunities in this highly active part of Downtown Ocala don't sit long - keep expenses low while positioning yourself in a growing area. And yes - No HOA. Schedule your showing before someone else does.
-
2026-03-03$125,000 Active 542-char remark
Show marketing remark (542 chars)
YOU'VE FOUND YOUR NEXT INVESTMENT - OR THE PERFECT DOWNSIZE! This efficient 2-bedrooms, 1-bath, home offers functional living with major updates already done (roof, kitchen, water heater, and more) - meaning less worry and more return, or more enjoyment. The 40x100 lot gives you room to expand, entertain, or increase value over time. Opportunities in this highly active part of Downtown Ocala don't sit long - keep expenses low while positioning yourself in a growing area. And yes - No HOA. Schedule your showing before someone else does.
-
2023-11-09historical $900
-
2023-10-31$900
-
2023-08-21soldstatus $63,000 Closed 135-char remark
Show marketing remark (135 chars)
Under contract-accepting backup offers. Handyman special. 2 bed 1 bath house near downtown Ocala. Nearby plazas, restaurants, and more.
-
2023-08-16soldstatus $63,000
-
2023-06-28status Pending 135-char remark
Show marketing remark (135 chars)
Under contract-accepting backup offers. Handyman special. 2 bed 1 bath house near downtown Ocala. Nearby plazas, restaurants, and more.
-
2023-05-30price $75,900 135-char remark
Show marketing remark (135 chars)
Under contract-accepting backup offers. Handyman special. 2 bed 1 bath house near downtown Ocala. Nearby plazas, restaurants, and more.
-
2023-04-11$85,000 Active 135-char remark
Show marketing remark (135 chars)
Under contract-accepting backup offers. Handyman special. 2 bed 1 bath house near downtown Ocala. Nearby plazas, restaurants, and more.
-
2023-03-29historical
-
2023-03-07price $87,000
-
2023-03-07price $97,000
-
2023-02-17price $92,000
-
2023-01-25price $93,000
-
2023-01-25price $95,000
-
2022-12-15price $97,500
-
2022-11-30price $95,000
-
2022-10-19price $99,000
-
2022-09-20price $110,000
-
2022-09-20price $119,999
-
2022-08-25price $120,000
-
2022-08-09$100,000 Active
-
2021-07-02soldstatus $32,000 Closed
-
2021-06-24status Pending
-
2021-06-02$30,000 Active
-
2005-03-07soldstatus $25,500
-
2004-05-24$29,900
ⓘ Source: listings_history table (triggers on properties + properties_extension) + one-shot
backfill from property_details.listing_events for pre-trigger history.
Tax reassessment forecast FL · Resets to sale price
- Current annual tax
- $822 · $68/mo
- Projected year-2 tax
- $822 · $68/mo
- Expected delta
- $0/yr ($0/mo · 0.0%)
ⓘ Screening estimate from a state-policy table — verify with the county assessor before closing.
Climate risk First Street
- Flood 1/10 Low FEMA zone X (unshaded) · 0% chance over 30 yrs
- Wildfire 1/10 Low
- Heat 8/10 Severe 7 d/yr ≥107°F today · 22 d/yr by 30 yrs out
- Wind 9/10 Extreme 99% chance of damaging wind over 30 yrs
- Air quality 3/10 Moderate 3 unhealthy d/yr today · 3 by 30 yrs out
Nearby sold comps map
Loading sold comps map…
Walkable amenities ~0.75 mi
Loading nearby amenities…
Taxation est. · year 1
- Rental income
- $12,974
- − Mortgage interest
- −$5,546
- − Property taxes
- −$822
- − Insurance
- −$495
- − Repairs & maintenance
- −$1,038
- − Management
- −$1,038
- − Depreciation
- −$2,880
- Taxable income
- $1,156
- Est. tax owed @ 24.0%
- −$277
- After-tax cash flow
- $2,425/yr
For passive investors: Depreciation is non-cash, so a rental often shows a tax loss while cash-flowing — sheltering income. Rental losses are passive: they offset passive income freely, and up to $25,000/yr can offset ordinary (W-2) income if you actively participate and your MAGI is under $100k (phasing out to $0 by $150k); unused losses carry forward. On sale, claimed depreciation is recaptured at up to 25%, and gains may owe capital-gains tax (a 1031 exchange can defer both). Figures are a year-1 estimate at your 24.0% rate — not tax advice; consult a CPA.
Schools (NCES district)
- District
- Marion
- NCES district ID
- 1201260
- Math proficiency
- 42% ▼ -7.00%
- Reading proficiency
- 43% ▼ -4.00%
- Median HH income
- $40,015
- Composite
- 35.61/100
- National rank
- #4890
- State rank
- #61 of 73 in FL
Livability — Ocala
- Score
- 69/100
- State rank
- #476
- US rank
- #8461
Category grades
Schools grade is shown separately in the Schools card above.
Census & demographics
- Census place
- Ocala, FL
- County
- Marion County · 315,796 people
- City population
- 263,375
- Metro
- Ocala, FL
- Population (ZIP)
- 14,301
- Household income
- $30,174
- Rent vs Own
- Severe rent burden
- 923.0
Population outlook (Marion County) Hauer SSP2
- Today (2025)
- 365,905 people
- By 2030
- 376,768 · +3.0%
- By 2040
- 396,555 · +8.4%
- By 2050
- 412,723 · +12.8%
- By 2075
- 446,090 · +21.9%
- By 2100
- 436,193 · +19.2%
Race, ethnicity, and origin ACS 2023
- Neighborhood character
- Diverse neighborhood (Simpson 0.68)
- Race & ethnicity
- Black 44% White 30% Hispanic / Latino 19% Two or more races 11%
- Hispanic origin (detail)
- Mexican 1% Puerto Rican 8% Cuban 3%
- Common ancestry
- Serbian 2% Hispanic 1% Lithuanian 1%
- Foreign-born
- 8% · Canada, China, Jamaica
- Languages at home
- 84% English-only · Spanish 13% French/Haitian/Cajun 2%
Political lean MEDSL · Marion
- 2024 margin
- Solid R (+31.6) · D 33.8% · R 65.5%
- 2008→2024 swing
- -20.0pp toward R · 2008: -11.6pp · 2024: -31.6pp
- All cycles
- 2024: R+31.6 2020: R+25.9 2016: R+26.2 2012: R+16.2 2008: R+11.6
Not yet ingested
- Civics
- —
Market trends
- HPI YoY
- ▼ -22.26%
- Current HPI
- 254.6319
- Rent YoY
- —
- Metro
- Ocala, FL
- State GDP YoY
- ▲ 3.28%
- F500 in state
- 36
Industry mix (Fortune 500 HQ in FL)
| Industry | F500 HQs | Revenue |
|---|---|---|
| Industrial Technology | 2 | $29B |
|
||
| Insurance | 2 | $17B |
|
||
| Retail | 1 | $60B |
|
||
| Technology Distribution | 1 | $58B |
|
||
| Homebuilding | 1 | $35B |
|
||
| Technology Manufacturing | 1 | $35B |
|
||
Price history
+201.0% since first listed28 events — show timeline
- 2026-05-18 Pending — Stellar MLS as Distributed by MLS Grid
- 2026-05-11 Price Changed $90,000 Stellar MLS as Distributed by MLS Grid
- 2026-03-03 Listed $125,000 Stellar MLS as Distributed by MLS Grid
- 2023-11-09 Rental Removed $900 STELLARMLS
- 2023-10-31 Listed for Rent $900 STELLARMLS
- 2023-08-21 Sold (MLS) $63,000 Stellar MLS as Distributed by MLS Grid
- 2023-08-16 Sold (Public Records) $63,000 Public Records
- 2023-06-28 Pending — Stellar MLS as Distributed by MLS Grid
- 2023-05-30 Price Changed $75,900 Stellar MLS as Distributed by MLS Grid
- 2023-04-11 Listed $85,000 Stellar MLS as Distributed by MLS Grid
- 2023-03-29 Listing Removed — MARMLS
- 2023-03-07 Price Changed $87,000 MARMLS
- 2023-03-07 Price Changed $97,000 MARMLS
- 2023-02-17 Price Changed $92,000 MARMLS
- 2023-01-25 Price Changed $93,000 MARMLS
- 2023-01-25 Price Changed $95,000 MARMLS
- 2022-12-15 Price Changed $97,500 MARMLS
- 2022-11-30 Price Changed $95,000 MARMLS
- 2022-10-19 Price Changed $99,000 MARMLS
- 2022-09-20 Price Changed $110,000 MARMLS
- 2022-09-20 Price Changed $119,999 MARMLS
- 2022-08-25 Price Changed $120,000 MARMLS
- 2022-08-09 Listed $100,000 MARMLS
- 2021-07-02 Sold (MLS) $32,000 Stellar MLS as Distributed by MLS Grid
- 2021-06-24 Pending — Stellar MLS as Distributed by MLS Grid
- 2021-06-02 Listed $30,000 Stellar MLS as Distributed by MLS Grid
- 2005-03-07 Sold (MLS) $25,500 Stellar MLS as Distributed by MLS Grid
- 2004-05-24 Listed $29,900 Stellar MLS as Distributed by MLS Grid
Property tax history
+17.9%/yrLatest (2025): $822 · +6.7% YoY. Source: county tax records.
Cash-flow waterfall
monthlySold comps — $/sqft
last 12 mo · ≤1 miLoading sold comps…