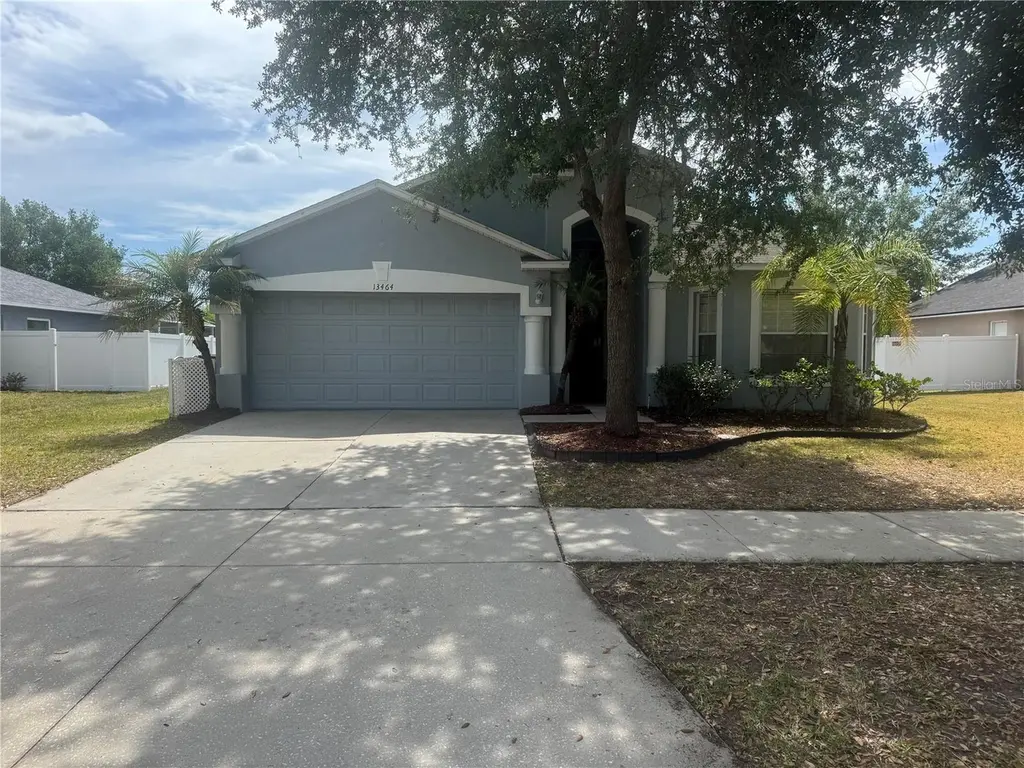
13464 Fladgate Mark Dr · Riverview, FL
Flood risk 1/10 · Minimal
- FEMA flood zone
- X (unshaded)
- Chance of flooding over 30 yrs
- 0.0%
- Est. flood insurance / yr
- $507 – $1,088
Fire risk 3/10 · Minor
- Est. fire insurance / yr
- $947 – $1,759
Heat risk 10/10 · Severe
- Hot days now (above 109°F)
- 7 days/yr
- Hot days in 30 yrs
- 27 days/yr
Wind risk 9/10 · Severe
- Chance of severe wind over 30 yrs
- 99.0%
Air-quality risk 3/10 · Minor
- Unhealthy air days now
- 3 days/yr
- Unhealthy air days in 30 yrs
- 3 days/yr
Risk factors via First Street. Map © Google.
Why this score? — see what drove the C grade
The composite is a weighted blend of 9 inputs, each scored 0–100. Each bar is that input's sub-score; the figure is the points it added to the 100-point composite (weight × sub-score).
- Cash flow +17.9/30.0
- ARV discount +7.5/15.0
- 1% rule +7.3/10.0
- DSCR +5.6/10.0
- Appreciation +4.3/10.0
- Schools +4.2/10.0
- Livability +4.0/5.0
- Rent growth +2.8/5.0
- Condition / age +2.5/5.0
$225,000
🖨 Deal sheet 📄 Offer letter ✓ Due diligence
Listing remarks MLS
Soaring ceilings, plenty of plant shelves & niches, open floor plan with bonus room and 3 way bedroom split. Covered lanai and over sized backyard. Buyer is encouraged to have home inspection by qualified professional before purchase. Buyer assumes all responsibility for verifying all HOA, leasing, tax and CDD information.
Key facts
- Rental property
- Spacious layout
- As-is sale
Tags
Property features AI
Finance
- Other: Total acreage: less than 1/4 acre (approx. 0.21 acres); Lot dimensions approx. 65 x 139
- Financial info: CDD present; Lease restrictions apply
- HOA & community: Has HOA (annual fee $142; approximately $11.83/month); HOA approval required; Association name: Sarah Ranney; Community amenities include a pool; Deed restrictions in community; Pets allowed
Exterior
- Parking: Attached garage; 2-car garage
- Utilities: Public water; Public sewer; Electricity connected; Water connected
- Home design: Single-family residence; One story; Faces west; Located in a planned development (PD)
- Construction: Block and stucco construction; Shingle roof; Slab foundation; Built as a fixer
- Exterior features: Covered patio/porch; Deck; Patio; Porch; Sidewalk; Paved lot/drive
Interior
- Kitchen: Eat-in kitchen
- Bedrooms: 4 bedrooms
- Flooring: Carpet; Ceramic tile
- Bathrooms: 3 full bathrooms
- Heating & cooling: Central heating; Central air conditioning
- Interior features: Cathedral ceilings; Vaulted ceilings; High ceilings; Open floor plan; Eat-in kitchen; Split bedroom floorplan; Walk-in closets; Great room; Inside utility
- Laundry & utility: Laundry inside
Neighborhood map
What this means for you Summary
Snapshot
- This is a 4-bed/3.0-bath single-family listed at $225k.
Deal economics
- At list price, monthly cash flow is $188 ($2k/yr) — positive.
- The deal already cash-flows at list — no discount required.
- Meets the 1% rule at list price ($3k rent vs $225k).
Location & tenants
- Location reads 79/100 on livability (#134 in FL, #2,000 nationally) — a middle-class / working-renter tenant base. Strengths: housing A+, health & safety A+, employment B+; Watch: amenities F.
- Hillsborough (suburban): math 47% / reading 50% proficiency, ranked #41 of 73 in FL (top 56%) — families likely to look elsewhere, expect single-tenant / working-renter base with shorter leases.
- Market conditions: Rents rising (+1.2%/yr); 457 active listings in the ZIP; 40 comparable units currently listed for rent nearby; rentals at typical pace (median 15d on market — plan ~3-4 weeks tenant-placement turnaround); high-income renter base; 9,053 units permitted in Hillsborough County in 2024 (4,555 in 5+ unit buildings).
Forward outlook
- Local home prices are declining (-1.4%/yr); year-one equity from $2k of loan paydown is wiped out by about $3k of value loss. Plan a longer hold.
- Hillsborough County population projected at +37% by 2050 — long-run rental-demand tailwind backs the buy-and-hold thesis.
Negotiation context
- Only 3 days on market — expect competitive offers; lowballing is unlikely to land.
- 2 sale attempts since 13y ago with the ask held roughly flat each time — persistent listings suggest the price (not the market) is what's stuck; bring a comps-based counter.
- Current owner paid $137k; list at $225k implies a 64% gain — meaningful room to come down on a strong offer.
Risks & watch-outs
- Watch-outs: property tax is 3.8% of price.
- Climate carrying-cost: severe wind risk, 99% chance of damaging wind over 30y; extreme-heat days projected 7→27/yr by 2055 (HVAC capex compounding) — expect insurance premiums to compound above CPI over the hold.
Questions for the listing agent
- Property tax is high relative to price — has the assessment been appealed recently, and will the sale trigger a re-assessment?
- What does the HOA fee cover, when was the last increase, and are there any pending special assessments or reserve-fund shortfalls?
- Is there a deadline driving the sale (1031 exchange, divorce, estate, relocation)? That informs how much negotiation room exists.
- Schools are B-rated — typically a magnet for longer-tenancy family renters. What's the average tenant stay here, and is there a school-zone premium baked into asking?
- What's the average days-on-market for RENTAL listings here right now (not sales)? A rising rental-DOM trend means longer vacancies and softer asking-rent achievability than the comps imply.
- What's the recent tenant-quality profile in this submarket — average credit score on applications, eviction rate, late-payment / NSF rate, and stable-employment percentage? A property-management company in the area should have these aggregated.
- How much new for-sale + rental construction is in the pipeline within 1–3 miles? Heavy new supply typically softens prices + rents 12–24 months out; constrained supply supports both.
Investment metrics
- 1% rule
- 1.23% ✓
- Cap rate
- 7.30%
- Cash-on-cash
- 3.58%
- DSCR
- 1.16
- GRM
- 6.8
CMA / ARV
No comps found within radius.
Projected returns pro-forma
-1.42% appreciation · 1.18% rent growth · sell at horizon
- IRR
- -5.3%
- Equity multiple
- 0.78×
- Total profit
- $-13,887
- Equity at exit
- $49,800
- IRR
- -0.2%
- Equity multiple
- 0.98×
- Total profit
- $-1,099
- Equity at exit
- $48,540
Cash invested: $63,000 (down + closing). Projections, not guarantees.
Landlord ↔ Tenant lean methodology
- Overall (STATE)
- 87 Strongly Landlord-Friendly
- State Florida
- 87 Strongly Landlord-Friendly · R+3
- County
- — inherits STATE
- City
- — inherits STATE
ZIP-level market 33579
- Home prices YoY
- -0.6%
- Rents YoY
- 1.2%
- Active inventory
- 457
- Price-to-rent
- 6.8×
Monthly cashflow live
- Estimated rent
- $2,776 high interval (Pro) →
- Mortgage (P&I)
- −$1,180
- Tax from tax record
- −$720 /mo · $8,645/yr
- Insurance
- −$94
- HOA
- −$11
- Vacancy / Maint / Mgmt
- −$583
- Net cashflow
- $188
Break-even live
UW: 25.0% down · 7.5% · 30yr · 1.5% tax · 5.0% vac · 8.0% maint · 8.0% mgmt
Financing live
Cash to close
- Down payment
- $56,250
- Closing costs
- $6,750
- Reserves months
- —
- Total cash needed
- —
Loan-product check · same deal, 3 products live
Conventional
25% down · 7.5% · 30yr
- Down + closing
- —
- Monthly P&I
- —
- Monthly cashflow
- —
- DSCR
- —
- Eligible?
- —
Personal DTI + credit; lowest rate.
DSCR
20% down · 8.5% · 30yr
- Down + closing
- —
- Monthly P&I
- —
- Monthly cashflow
- —
- DSCR
- —
- Eligible?
- —
No personal income docs; deal must DSCR.
Hard money
10% down · 12.0% · 12mo
- Down + closing
- —
- Monthly P&I
- —
- Monthly cashflow
- —
- DSCR
- —
- Eligible?
- —
Short-term bridge; refi at stabilization.
Rent comps 40 comps
| Address | Beds | Baths | Sqft | Rent | $/sqft | DOM | Units | Dist |
|---|---|---|---|---|---|---|---|---|
| 13465 Fladgate Mark Dr Riverview, FL | 4.0 | 2.0 | 1544 | $2,045 | $1.32 | 4d | 1 | 0.05mi |
| 11618 Ashton Field Ave Riverview, FL | 4.0 | 3.0 | 2114 | $2,600 | $1.23 | 14d | 1 | 0.29mi |
| 13655 Artesa Bell Dr Riverview, FL | 4.0 | 3.0 | 2351 | $3,075 | $1.31 | 4d | 1 | 0.32mi |
| 11211 Flora Springs Dr Riverview, FL | 5.0 | 3.0 | 2320 | $2,723 | $1.17 | 23d | 1 | 0.33mi |
| 11510 Harlan Eddy Ct Riverview, FL | 4.0 | 2.0 | 2351 | $2,700 | $1.15 | 24d | 1 | 0.38mi |
| 11519 Misty Isle Ln Riverview, FL | 4.0 | 2.0 | 1936 | $2,600 | $1.34 | 24d | 1 | 0.39mi |
| 11716 Navajo Sandstone St Riverview, FL | 4.0 | 2.5 | 2450 | $2,900 | $1.18 | 4d | 1 | 0.47mi |
| 13423 Beechberry Dr Riverview, FL | 4.0 | 2.5 | 2322 | $2,800 | $1.21 | 2d | 1 | 0.51mi |
| 11328 Misty Isle Ln Riverview, FL | 4.0 | 3.5 | 2532 | $2,600 | $1.03 | 10d | 1 | 0.51mi |
| 11412 Misty Isle Ln Riverview, FL | 5.0 | 4.0 | 2523 | $3,200 | $1.27 | 24d | 1 | 0.57mi |
| 11424 Misty Isle Ln Riverview, FL | 3.0 | 2.0 | 1839 | $2,165 | $1.18 | 12d | 1 | 0.62mi |
| 11427 Misty Isle Ln Riverview, FL | 4.0 | 2.0 | 1916 | $2,310 | $1.21 | 4d | 1 | 0.64mi |
| 13305 Silvercreek Dr Riverview, FL | 3.0 | 2.0 | 1743 | $2,099 | $1.20 | 4d | 1 | 0.68mi |
| 13263 Evening Sunset Ln Riverview, FL | 4.0 | 2.0 | 1959 | $2,200 | $1.12 | 4d | 1 | 0.69mi |
| 13625 Silver Charm Ct Riverview, FL | 4.0 | 2.5 | 1907 | $2,350 | $1.23 | 24d | 1 | 0.83mi |
| 11164 Golden Silence Dr Riverview, FL | 3.0 | 2.0 | 1930 | $2,050 | $1.06 | 24d | 1 | 0.88mi |
| 13204 Waterleaf Garden Cir Riverview, FL | 4.0 | 2.0 | 2046 | $3,600 | $1.76 | 4d | 1 | 0.95mi |
| 11838 Blackeyed Susan Dr Riverview, FL | 4.0 | 2.0 | 1816 | $2,800 | $1.54 | 20d | 1 | 0.97mi |
| 11025 Golden Silence Dr Riverview, FL | 3.0 | 2.5 | 1785 | $2,210 | $1.24 | 13d | 1 | 1.00mi |
| 13515 Palmera Vista Dr Riverview, FL | 4.0 | 2.0 | 1832 | $3,600 | $1.97 | 4d | 1 | 1.01mi |
| 13515 Palmera Vista Dr Riverview, FL | 4.0 | 2.0 | 1850 | $3,800 | $2.05 | 17d | 1 | 1.01mi |
| 11110 Cherrywood Ln Riverview, FL | 3.0 | 2.0 | 1264 | $2,045 | $1.62 | 4d | 1 | 1.01mi |
| 14207 Poke Ridge Dr Riverview, FL | 3.0 | 3.0 | 1897 | $2,350 | $1.24 | 23d | 1 | 1.02mi |
| 11736 Dumaine Valley Rd Riverview, FL | 3.0 | 2.5 | 1670 | $2,000 | $1.20 | 14d | 1 | 1.03mi |
| 11218 Scotchwood Dr Riverview, FL | 3.0 | 2.0 | 1546 | $2,150 | $1.39 | 14d | 1 | 1.03mi |
| 11176 Leland Groves Dr Riverview, FL | 4.0 | 2.5 | 2318 | $2,700 | $1.16 | 4d | 1 | 1.04mi |
| 14217 Poke Ridge Dr Riverview, FL | 3.0 | 2.5 | 1913 | $2,511 | $1.31 | 4d | 1 | 1.04mi |
| 11105 Cherrywood Ln Riverview, FL | 4.0 | 2.0 | 1364 | $2,110 | $1.55 | 24d | 1 | 1.05mi |
| 11009 Golden Silence Dr Riverview, FL | 4.0 | 2.5 | 2154 | $2,800 | $1.30 | 24d | 1 | 1.06mi |
| 11167 Leland Groves Dr Riverview, FL | 5.0 | 3.0 | 2526 | $3,500 | $1.39 | 24d | 1 | 1.08mi |
| 13456 Palmera Vista Dr Riverview, FL | 3.0 | 2.0 | 1752 | $2,500 | $1.43 | 17d | 1 | 1.09mi |
| 11810 Tetrafin Dr Riverview, FL | 4.0 | 2.0 | 2184 | $2,750 | $1.26 | 24d | 1 | 1.10mi |
| 13924 Arbor Pines Dr Riverview, FL | 4.0 | 2.5 | 1920 | $2,545 | $1.33 | 24d | 1 | 1.12mi |
| 13016 Prestwick Dr Riverview, FL | 4.0 | 3.0 | 2506 | $3,500 | $1.40 | 24d | 1 | 1.16mi |
| 11030 Whittney Chase Dr Riverview, FL | 3.0 | 2.0 | 1270 | $2,350 | $1.85 | 10d | 1 | 1.16mi |
| 11025 Whittney Chase Dr Riverview, FL | 4.0 | 2.0 | 1544 | $2,235 | $1.45 | 1d | 1 | 1.16mi |
| 11201 Hudson Hills Ln Riverview, FL | 5.0 | 2.5 | 2254 | $2,450 | $1.09 | 14d | 1 | 1.18mi |
| 13230 Prestwick Dr Riverview, FL | 3.0 | 2.0 | 1270 | $1,830 | $1.44 | 17d | 1 | 1.23mi |
| 10925 Subtle Trail Dr Riverview, FL | 3.0 | 2.0 | 1716 | $2,000 | $1.17 | 24d | 1 | 1.25mi |
| 11322 Torrey Pines Dr Riverview, FL | 4.0 | 2.0 | 2194 | $2,300 | $1.05 | 24d | 1 | 1.25mi |
HOA detail
- Monthly dues
- $11 · $132/yr
Listing history 6 events
-
2026-05-04status Pending
-
2026-05-01$225,000 Active
-
2013-11-06soldstatus $137,000 330-char remark
Show marketing remark (330 chars)
Soaring ceilings, plenty of plant shelves & niches, open floor plan with bonus room and 3 way bedroom split. Covered lanai and over sized backyard. Buyer is encouraged to have home inspection by qualified professional before purchase. Buyer assumes all responsibility for verifying all HOA, leasing, tax and CDD information.
-
2013-09-20$144,900 330-char remark
Show marketing remark (330 chars)
Soaring ceilings, plenty of plant shelves & niches, open floor plan with bonus room and 3 way bedroom split. Covered lanai and over sized backyard. Buyer is encouraged to have home inspection by qualified professional before purchase. Buyer assumes all responsibility for verifying all HOA, leasing, tax and CDD information.
-
2006-06-19soldstatus $600,000
-
2005-06-27soldstatus $2,155,500
ⓘ Source: listings_history table (triggers on properties + properties_extension) + one-shot
backfill from property_details.listing_events for pre-trigger history.
Tax reassessment forecast FL · Resets to sale price
- Current annual tax
- $8,645 · $720/mo
- Projected year-2 tax
- $8,645 · $720/mo
- Expected delta
- $0/yr ($0/mo · 0.0%)
ⓘ Screening estimate from a state-policy table — verify with the county assessor before closing.
Climate risk First Street
- Flood 1/10 Low FEMA zone X (unshaded) · 0% chance over 30 yrs
- Wildfire 3/10 Moderate
- Heat 10/10 Extreme 7 d/yr ≥109°F today · 27 d/yr by 30 yrs out
- Wind 9/10 Extreme 99% chance of damaging wind over 30 yrs
- Air quality 3/10 Moderate 3 unhealthy d/yr today · 3 by 30 yrs out
Nearby sold comps map
Loading sold comps map…
Walkable amenities ~0.75 mi
Loading nearby amenities…
Taxation est. · year 1
- Rental income
- $33,313
- − Mortgage interest
- −$12,603
- − Property taxes
- −$8,645
- − Insurance
- −$1,125
- − Repairs & maintenance
- −$2,665
- − Management
- −$2,665
- − HOA
- −$132
- − Depreciation
- −$6,545
- Taxable loss
- −$1,069
- Est. tax savings @ 24.0%
- +$257
- After-tax cash flow
- $2,512/yr
For passive investors: Depreciation is non-cash, so a rental often shows a tax loss while cash-flowing — sheltering income. Rental losses are passive: they offset passive income freely, and up to $25,000/yr can offset ordinary (W-2) income if you actively participate and your MAGI is under $100k (phasing out to $0 by $150k); unused losses carry forward. On sale, claimed depreciation is recaptured at up to 25%, and gains may owe capital-gains tax (a 1031 exchange can defer both). Figures are a year-1 estimate at your 24.0% rate — not tax advice; consult a CPA.
Schools (NCES district)
- District
- Hillsborough
- NCES district ID
- 1200870
- Math proficiency
- 47% ▼ -8.00%
- Reading proficiency
- 50% ▼ -4.00%
- Median HH income
- $50,622
- Composite
- 41.6/100
- National rank
- #3435
- State rank
- #41 of 73 in FL
Livability — Riverview
- Score
- 79/100
- State rank
- #134
- US rank
- #2000
Category grades
Schools grade is shown separately in the Schools card above.
Census & demographics
- Census place
- Riverview, FL
- County
- Hillsborough County · 1,540,968 people
- City population
- 137,988
- Metro
- Tampa-St. Petersburg-Clearwater, FL
- Population (ZIP)
- 49,470
- Household income
- $116,134
- Rent vs Own
- Severe rent burden
- 258.0
Population outlook (Hillsborough County) Hauer SSP2
- Today (2025)
- 1,607,022 people
- By 2030
- 1,733,968 · +7.9%
- By 2040
- 1,979,565 · +23.2%
- By 2050
- 2,203,427 · +37.1%
- By 2075
- 2,667,893 · +66.0%
- By 2100
- 2,891,558 · +79.9%
Race, ethnicity, and origin ACS 2023
- Neighborhood character
- Highly diverse neighborhood (Simpson 0.71)
- Race & ethnicity
- White 42% Hispanic / Latino 25% Black 24% Two or more races 19% Asian 5%
- Hispanic origin (detail)
- Mexican 3% Puerto Rican 12% Cuban 3% Dominican 1%
- Common ancestry
- Hispanic 1% British 1% Romanian 1%
- Foreign-born
- 17% · Canada, Jamaica, China
- Languages at home
- 73% English-only · Spanish 19% Other Indo-European 2% French/Haitian/Cajun 1%
Political lean MEDSL · Hillsborough
- 2024 margin
- Toss-up / Even · D 47.8% · R 50.9% · Other 1.3%
- 2008→2024 swing
- -10.2pp toward R · 2008: 7.1pp · 2024: -3.1pp
- All cycles
- 2024: R+3.1 2020: D+6.9 2016: D+6.8 2012: D+6.7 2008: D+7.1
Not yet ingested
- Civics
- —
Market trends
- HPI YoY
- ▼ -1.42%
- Current HPI
- 240.5825
- Rent YoY
- ▲ 1.18%
- Metro
- Tampa-St. Petersburg-Clearwater, FL
- State GDP YoY
- ▲ 3.28%
- F500 in state
- 36
Industry mix (Fortune 500 HQ in FL)
| Industry | F500 HQs | Revenue |
|---|---|---|
| Industrial Technology | 2 | $29B |
|
||
| Insurance | 2 | $17B |
|
||
| Retail | 1 | $60B |
|
||
| Technology Distribution | 1 | $58B |
|
||
| Homebuilding | 1 | $35B |
|
||
| Technology Manufacturing | 1 | $35B |
|
||
Price history
-89.6% since first listed6 events — show timeline
- 2026-05-04 Pending — Stellar MLS as Distributed by MLS Grid
- 2026-05-01 Listed $225,000 Stellar MLS as Distributed by MLS Grid
- 2013-11-06 Sold (MLS) $137,000 Stellar MLS as Distributed by MLS Grid
- 2013-09-20 Listed $144,900 Stellar MLS as Distributed by MLS Grid
- 2006-06-19 Sold (Public Records) $600,000 Public Records
- 2005-06-27 Sold (Public Records) $2,155,500 Public Records
Property tax history
+7.7%/yrLatest (2025): $8,645 · +9.1% YoY. Source: county tax records.
Cash-flow waterfall
monthlySold comps — $/sqft
last 12 mo · ≤1 miLoading sold comps…