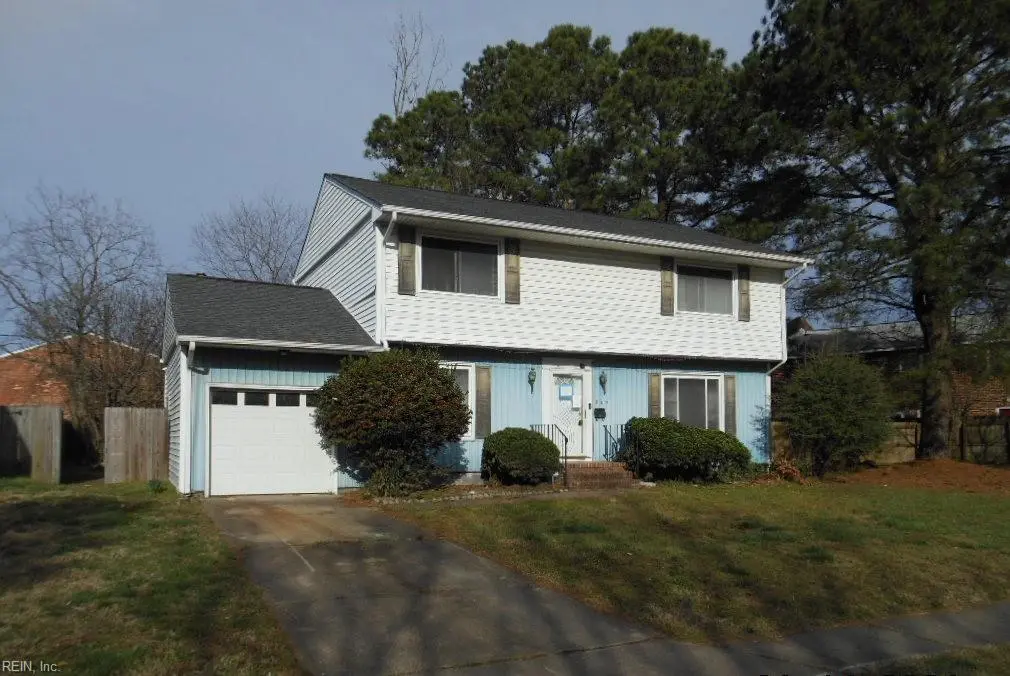
207 Swartmore Dr · Hampton, VA
Flood risk 6/10 · Moderate
- FEMA flood zone
- X (unshaded)
- Chance of flooding over 30 yrs
- 0.54%
- Est. flood insurance / yr
- $507 – $1,088
Fire risk 2/10 · Minimal
- Est. fire insurance / yr
- $666 – $1,236
Heat risk 9/10 · Severe
- Hot days now (above 105°F)
- 7 days/yr
- Hot days in 30 yrs
- 17 days/yr
Wind risk 8/10 · Major
- Chance of severe wind over 30 yrs
- 80.0%
Air-quality risk 2/10 · Minimal
- Unhealthy air days now
- 2 days/yr
- Unhealthy air days in 30 yrs
- 2 days/yr
Risk factors via First Street. Map © Google.
Why this score? — see what drove the C grade
The composite is a weighted blend of 9 inputs, each scored 0–100. Each bar is that input's sub-score; the figure is the points it added to the 100-point composite (weight × sub-score).
- Cash flow +16.7/30.0
- ARV discount +15.0/15.0
- Schools +5.5/10.0
- DSCR +5.2/10.0
- 1% rule +4.6/10.0
- Livability +3.8/5.0
- Rent growth +3.5/5.0
- Condition / age +2.5/5.0
- Appreciation +0.0/10.0
$243,000
🖨 Deal sheet 📄 Offer letter ✓ Due diligence
Listing remarks MLS
Property Sold as-is. No concessions No Repairs. Traditional home with 2000sf of living space, 4 bedroom, 2.5 bathrooms, 1 car garage, sunroom, privacy fenced in back yard, convenient Hampton location near Coliseum Central, shopping and restaurants. Must see to appreciate!
Key facts
- Sunroom
- 0.23 acre lot
- Garage
Tags
Neighborhood map
What this means for you Summary
Snapshot
- This is a 3-bed/2.5-bath single-family listed at $243k.
Deal economics
- At list price, monthly cash flow is $151 ($2k/yr) — positive.
- The deal already cash-flows at list — no discount required.
- To meet the 1% rule (rent ≥ 1% of price), the offer needs to be $232k (4.4% below list).
- Recommended offer: $228k (6.0% below list) — sets the bar for market timing.
- Cap rate 7.0% vs local median 4.5% in Hampton — top-decile yield for the area; either an underpriced asset or a hidden risk that comps aren't pricing in. Stress-test before assuming the spread holds.
Location & tenants
- Location reads 75/100 on livability (#133 in VA, #4,302 nationally) — a middle-class / working-renter tenant base. Strengths: housing A+, health & safety A+, cost of living A; Watch: crime C-, amenities D+, commute F.
- Hampton City Public School District (urban): math 60% / reading 70% proficiency, ranked #40 of 131 in VA (top 30%) — acceptable for families but not a draw, mixed tenant base, ~2y average lease.
- Market conditions: Rents rising fast (+4.0%/yr); 231 active listings in the ZIP; 4 comparable units currently listed for rent nearby; rentals at typical pace (median 15d on market — plan ~3-4 weeks tenant-placement turnaround); 68 units permitted in Hampton city in 2024 (0 in 5+ unit buildings).
- This rent runs 38% of the median local income ($73k/yr) — at the standard rent-burdened threshold; future hikes will face affordability resistance.
Forward outlook
- Local home prices are declining (-3.0%/yr); year-one equity from $2k of loan paydown is wiped out by about $7k of value loss. Plan a longer hold.
- Hampton County population projected at -13% by 2050 — secular population decline; favor cash flow + early exit over multi-decade hold.
Negotiation context
- It's been on market 67 days — a 6% lower offer ($228k) is reasonable based on typical stale-listing flexibility.
- Current owner paid $55k; list at $243k implies a 342% gain — meaningful room to come down on a strong offer.
Risks & watch-outs
- Climate carrying-cost: major flood risk; severe wind risk, 80% chance of damaging wind over 30y; extreme-heat days projected 7→17/yr by 2055 (HVAC capex compounding) — expect insurance premiums to compound above CPI over the hold.
Questions for the listing agent
- It's been on market 67 days. Have you received any prior offers? Is the seller open to a 6% concession, seller financing, or rate buy-down credit?
- Built in 1978 — when were the roof, HVAC, electrical panel, plumbing, and water heater last replaced?
- Why hasn't it sold? Are there any deal-killer items the seller is aware of (foundation, flood, title, zoning, code violations)?
- Is there a deadline driving the sale (1031 exchange, divorce, estate, relocation)? That informs how much negotiation room exists.
- Schools are B-rated — typically a magnet for longer-tenancy family renters. What's the average tenant stay here, and is there a school-zone premium baked into asking?
- What's the average days-on-market for RENTAL listings here right now (not sales)? A rising rental-DOM trend means longer vacancies and softer asking-rent achievability than the comps imply.
- What's the recent tenant-quality profile in this submarket — average credit score on applications, eviction rate, late-payment / NSF rate, and stable-employment percentage? A property-management company in the area should have these aggregated.
- How much new for-sale + rental construction is in the pipeline within 1–3 miles? Heavy new supply typically softens prices + rents 12–24 months out; constrained supply supports both.
Investment metrics
- 1% rule
- 0.96% ✗
- Cap rate
- 7.04%
- Cash-on-cash
- 2.67%
- DSCR
- 1.12
- GRM
- 8.7
CMA / ARV
- ARV (median comp)
- $329,710
- List price
- $243,000
- Delta
- -26.30%
- Verdict
- UNDERPRICED
- Comps
- 20 within 1.0 mi
Show comp detail 12 sales within ~0.75 mi
| Address | Dist | Beds/Ba | Sqft | Sold | Price | $/sf | Match |
|---|---|---|---|---|---|---|---|
| 41 Santa Barbara Dr | 0.11mi | 4/2.5 (+1) | 2,233 (+7%) | 5mo | $345,500 | $155 | 74 |
| 119 Brinkman Dr | 0.21mi | 3/2.0 | 1,941 (-7%) | 3mo | $325,000 | $167 | 74 |
| 5 Toledo Ct | 0.11mi | 4/2.5 (+1) | 2,324 (+11%) | 3mo | $345,500 | $149 | 69 |
| 108 Waltham St | 0.24mi | 3/2.5 | 1,828 (-12%) | 2mo | $310,000 | $170 | 66 |
| 22 Greenwell Dr | 0.27mi | 4/2.0 (+1) | 1,986 (-5%) | 10mo | $345,000 | $174 | 64 |
| 115 Deerfield Blvd | 0.33mi | 3/2.0 | 1,828 (-12%) | 2mo | $285,000 | $156 | 60 |
| 5 Marldale Dr | 0.38mi | 4/2.0 (+1) | 1,892 (-9%) | 5mo | $330,000 | $174 | 56 |
| 111 Santa Clara Dr | 0.28mi | 4/2.0 (+1) | 1,830 (-12%) | 5mo | $293,000 | $160 | 55 |
| 110 Greenwell Dr | 0.30mi | 4/2.5 (+1) | 1,850 (-11%) | 11mo | $324,999 | $176 | 53 |
| 118 Watts Dr | 0.55mi | 3/2.0 | 1,802 (-14%) | 3mo | $311,823 | $173 | 47 |
| 115 Greenwell Dr | 0.30mi | 4/2.0 (+1) | 1,778 (-15%) | 9mo | $310,000 | $174 | 47 |
| 112 Watts Dr | 0.51mi | 3/2.5 | 1,775 (-15%) | 7mo | $324,900 | $183 | 45 |
Match score weights: distance 35% · size 25% · config 20% · recency 20%. Top-matched comps best support the ARV.
Projected returns pro-forma
-3.0% appreciation · 4.05% rent growth · sell at horizon
- IRR
- -10.9%
- Equity multiple
- 0.60×
- Total profit
- $-27,220
- Equity at exit
- $36,232
- IRR
- -0.1%
- Equity multiple
- 0.99×
- Total profit
- $-740
- Equity at exit
- $21,010
Cash invested: $68,040 (down + closing). Projections, not guarantees.
Landlord ↔ Tenant lean methodology
- Overall (STATE)
- 55 Moderately Landlord-Leaning
- State Virginia
- 55 Moderately Landlord-Leaning · D+2
- County
- — inherits STATE
- City
- — inherits STATE
ZIP-level market 23666
- Home prices YoY
- -15.7%
- Rents YoY
- 4.0%
- Active inventory
- 231
- Price-to-rent
- 8.7×
Monthly cashflow live
- Estimated rent
- $2,323 medium interval (Pro) →
- Mortgage (P&I)
- −$1,274
- Tax from tax record
- −$309 /mo · $3,703/yr
- Insurance
- −$101
- HOA
- −$0
- Vacancy / Maint / Mgmt
- −$488
- Net cashflow
- $151
Break-even live
UW: 25.0% down · 7.5% · 30yr · 1.5% tax · 5.0% vac · 8.0% maint · 8.0% mgmt
Financing live
Cash to close
- Down payment
- $60,750
- Closing costs
- $7,290
- Reserves months
- —
- Total cash needed
- —
Loan-product check · same deal, 3 products live
Conventional
25% down · 7.5% · 30yr
- Down + closing
- —
- Monthly P&I
- —
- Monthly cashflow
- —
- DSCR
- —
- Eligible?
- —
Personal DTI + credit; lowest rate.
DSCR
20% down · 8.5% · 30yr
- Down + closing
- —
- Monthly P&I
- —
- Monthly cashflow
- —
- DSCR
- —
- Eligible?
- —
No personal income docs; deal must DSCR.
Hard money
10% down · 12.0% · 12mo
- Down + closing
- —
- Monthly P&I
- —
- Monthly cashflow
- —
- DSCR
- —
- Eligible?
- —
Short-term bridge; refi at stabilization.
Rent comps 4 comps
| Address | Beds | Baths | Sqft | Rent | $/sqft | DOM | Units | Dist |
|---|---|---|---|---|---|---|---|---|
| 99 Tide Mill Ln Hampton, VA | 1.0–4.0 | 1.0–2.0 | 1145 | $2,319 | $2.03 | 1d | 19 | 0.83mi |
| 608 Charlton Dr Hampton, VA | 3.0 | 2.5 | 1800 | $2,500 | $1.39 | 14d | 1 | 1.05mi |
| 110 Marvin Dr Hampton, VA | 4.0 | 2.5 | 2300 | $2,400 | $1.04 | 14d | 1 | 1.22mi |
| 10 Rutland Dr Hampton, VA | 3.0 | 2.5 | 1817 | $2,600 | $1.43 | 23d | 1 | 1.48mi |
Listing history 7 events
-
2026-06-02status $243,000 Under Contract 67 DOM
-
2026-06-01days on market $243,000 Active 67 DOM
-
2026-05-31days on market $243,000 Active 66 DOM
-
2026-04-29price $256,500 273-char remark
Show marketing remark (273 chars)
Property Sold as-is. No concessions No Repairs. Traditional home with 2000sf of living space, 4 bedroom, 2.5 bathrooms, 1 car garage, sunroom, privacy fenced in back yard, convenient Hampton location near Coliseum Central, shopping and restaurants. Must see to appreciate!
-
2026-04-15price $270,000 273-char remark
Show marketing remark (273 chars)
Property Sold as-is. No concessions No Repairs. Traditional home with 2000sf of living space, 4 bedroom, 2.5 bathrooms, 1 car garage, sunroom, privacy fenced in back yard, convenient Hampton location near Coliseum Central, shopping and restaurants. Must see to appreciate!
-
2026-03-26$296,000 Active 273-char remark
Show marketing remark (273 chars)
Property Sold as-is. No concessions No Repairs. Traditional home with 2000sf of living space, 4 bedroom, 2.5 bathrooms, 1 car garage, sunroom, privacy fenced in back yard, convenient Hampton location near Coliseum Central, shopping and restaurants. Must see to appreciate!
-
1979-05-01soldstatus $54,950
ⓘ Source: listings_history table (triggers on properties + properties_extension) + one-shot
backfill from property_details.listing_events for pre-trigger history.
Tax reassessment forecast VA · Resets to sale price
- Current annual tax
- $3,703 · $309/mo
- Projected year-2 tax
- $3,703 · $309/mo
- Expected delta
- $0/yr ($0/mo · 0.0%)
ⓘ Screening estimate from a state-policy table — verify with the county assessor before closing.
Climate risk First Street
- Flood 6/10 Major FEMA zone X (unshaded) · 54% chance over 30 yrs
- Wildfire 2/10 Low
- Heat 9/10 Extreme 7 d/yr ≥105°F today · 17 d/yr by 30 yrs out
- Wind 8/10 Severe 80% chance of damaging wind over 30 yrs
- Air quality 2/10 Low 2 unhealthy d/yr today · 2 by 30 yrs out
Nearby sold comps map
Loading sold comps map…
Walkable amenities ~0.75 mi
Loading nearby amenities…
Taxation est. · year 1
- Rental income
- $27,880
- − Mortgage interest
- −$13,612
- − Property taxes
- −$3,703
- − Insurance
- −$1,215
- − Repairs & maintenance
- −$2,230
- − Management
- −$2,230
- − Depreciation
- −$7,069
- Taxable loss
- −$2,179
- Est. tax savings @ 24.0%
- +$523
- After-tax cash flow
- $2,339/yr
For passive investors: Depreciation is non-cash, so a rental often shows a tax loss while cash-flowing — sheltering income. Rental losses are passive: they offset passive income freely, and up to $25,000/yr can offset ordinary (W-2) income if you actively participate and your MAGI is under $100k (phasing out to $0 by $150k); unused losses carry forward. On sale, claimed depreciation is recaptured at up to 25%, and gains may owe capital-gains tax (a 1031 exchange can defer both). Figures are a year-1 estimate at your 24.0% rate — not tax advice; consult a CPA.
Schools (NCES district)
- District
- Hampton City Public School District
- NCES district ID
- 5101800
- Math proficiency
- 60% ▼ -21.00%
- Reading proficiency
- 70% ▼ -4.00%
- Median HH income
- $50,089
- Composite
- 55.19/100
- National rank
- #1272
- State rank
- #40 of 131 in VA
Livability — Hampton
- Score
- 75/100
- State rank
- #133
- US rank
- #4302
Category grades
Schools grade is shown separately in the Schools card above.
Census & demographics
- Census place
- Hampton, VA
- County
- Hampton City · 132,421 people
- City population
- 132,421
- Metro
- Virginia Beach-Norfolk-Newport News, VA-NC
- Population (ZIP)
- 54,233
- Household income
- $72,568
- Rent vs Own
- Severe rent burden
- 2951.0
Population outlook (Hampton County) Hauer SSP2
- Today (2025)
- 134,055 people
- By 2030
- 131,753 · -1.7%
- By 2040
- 125,017 · -6.7%
- By 2050
- 116,825 · -12.9%
- By 2075
- 97,033 · -27.6%
- By 2100
- 76,188 · -43.2%
Race, ethnicity, and origin ACS 2023
- Neighborhood character
- Diverse neighborhood (Simpson 0.65)
- Race & ethnicity
- Black 51% White 29% Two or more races 10% Hispanic / Latino 9% Asian 4%
- Hispanic origin (detail)
- Mexican 3% Puerto Rican 3%
- Common ancestry
- Italian 1% Lithuanian 1% Romanian 1%
- Foreign-born
- 7% · Canada, Vietnam
- Languages at home
- 90% English-only · Spanish 5% Vietnamese 1% Arabic 1%
Political lean MEDSL · Hampton
- 2024 margin
- Solid D (+39.9) · D 69.2% · R 29.4% · Other 1.4%
- 2008→2024 swing
- +1.0pp no change · 2008: 38.9pp · 2024: 39.9pp
- All cycles
- 2024: D+39.9 2020: D+42.2 2016: D+37.8 2012: D+45.4 2008: D+38.9
Not yet ingested
- Civics
- —
Market trends
- HPI YoY
- ▼ -49.01%
- Current HPI
- 262.821
- Rent YoY
- ▲ 4.05%
- Metro
- Virginia Beach-Norfolk-Newport News, VA-NC
- State GDP YoY
- ▲ 2.40%
- F500 in state
- 50
Industry mix (Fortune 500 HQ in VA)
| Industry | F500 HQs | Revenue |
|---|---|---|
| Aerospace / Defense | 4 | $236B |
|
||
| Technology / Defense | 3 | $32B |
|
||
| Financial Services | 2 | $176B |
|
||
| Utilities | 2 | $27B |
|
||
| Insurance | 2 | $25B |
|
||
| Technology | 2 | $15B |
|
||
Price history
+366.8% since first listed4 events — show timeline
- 2026-04-29 Price Changed $256,500 REINMLS
- 2026-04-15 Price Changed $270,000 REINMLS
- 2026-03-26 Listed $296,000 REINMLS
- 1979-05-01 Sold (Public Records) $54,950 Public Records
Property tax history
+9.3%/yrLatest (2025): $3,703 · +0.6% YoY. Source: county tax records.
Cash-flow waterfall
monthlySold comps — $/sqft
last 12 mo · ≤1 miLoading sold comps…