 Multi-family
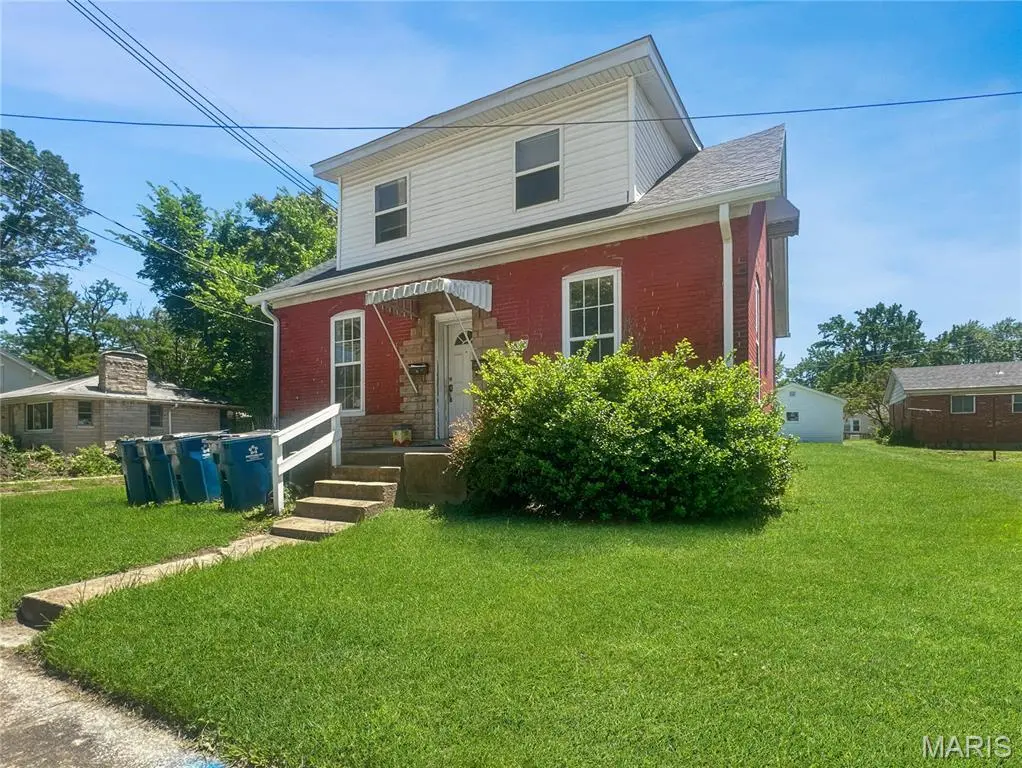
528 E Main St · Collinsville, IL
Flood risk 1/10 · Minimal
- FEMA flood zone
- X
- Chance of flooding over 30 yrs
- 0.0%
- Est. flood insurance / yr
- $473 – $860
Fire risk 1/10 · Minimal
- Est. fire insurance / yr
- $804 – $1,492
Heat risk 5/10 · Moderate
- Hot days now (above 107°F)
- 7 days/yr
- Hot days in 30 yrs
- 21 days/yr
Wind risk 2/10 · Minimal
- Chance of severe wind over 30 yrs
- 1.0%
Air-quality risk 3/10 · Minor
- Unhealthy air days now
- 3 days/yr
- Unhealthy air days in 30 yrs
- 4 days/yr
Risk factors via First Street. Map © Google.
Why this score? — see what drove the C+ grade
The composite is a weighted blend of 9 inputs, each scored 0–100. Each bar is that input's sub-score; the figure is the points it added to the 100-point composite (weight × sub-score).
- Cash flow +30.0/30.0
- DSCR +10.0/10.0
- 1% rule +9.7/10.0
- ARV discount +4.4/15.0
- Livability +3.4/5.0
- Rent growth +3.3/5.0
- Condition / age +2.5/5.0
- Schools +1.6/10.0
- Appreciation +0.0/10.0
$160,000
🖨 Deal sheet (PDF) 📄 Offer letter ✓ Due diligence
Multi-family units
County records classify this as Multi-Family (2-4 Unit). Listing-text estimate: 1 unit. estimate disagrees with records
Listing remarks
Excellent opportunity to own a versatile multi-unit property in a convenient Collinsville location! This two-unit building offers strong income potential for investors or could be ideal for an owner-occupant looking to offset expenses with rental income. Unit A, located on the main level, features 3 bedrooms, 2 bathrooms, laundry hookups, a spacious living room, kitchen, and an additional flexible room that could serve as either a family room or dining area. Upstairs, Unit B includes 2 bedrooms, 1 bathroom, a kitchen, and additional storage space. The property also includes an oversized detached 1-car garage located at the rear of the property, offering extra storage or parking options. Con
Key facts
- Income potential
- Flexible room
- Multi-unit property
Tags
Property features AI
Finance
- Other: Ownership is private
- Financial info: Seller may consider concessions; No second mortgage reported; Lease not considered
- HOA & community: No HOA information provided
Exterior
- Parking: 1 garage space (total parking for 1 vehicle)
- Security: No security details provided
- Utilities: Public water; Electric service by Ameren; Cable available
- Home design: Residential income property; 2-4 unit multifamily (two units); One building; Two stories
- Construction: Brick and vinyl siding exterior
- Exterior features: Garage(s); Lot is approximately 0.1773 acres; No pool
Interior
- Kitchen: No kitchen appliance details provided
- Bedrooms: One 3-bedroom unit; One 2-bedroom unit
- Flooring: No flooring details provided
- Bathrooms: 3 bathrooms total (2 in the 3-bedroom unit, 1 in the 2-bedroom unit)
- Heating & cooling: Forced air heating; Natural gas heating; Central air conditioning
- Interior features: Unfinished basement; Two-level building
- Laundry & utility: No laundry or utility room details provided
Neighborhood map
What this means for you Summary
Snapshot
- This is a 2-bed/3.0-bath multifamily listed at $160k.
Deal economics
- At list price, monthly cash flow is $683 ($8k/yr) — positive.
- The deal already cash-flows at list — no discount required.
- Meets the 1% rule at list price ($2k rent vs $160k).
- Recommended offer: $155k (3.0% below list) — sets the bar for market timing.
- Cap rate 11.4% vs local median 4.0% in Collinsville — top-decile yield for the area; either an underpriced asset or a hidden risk that comps aren't pricing in. Stress-test before assuming the spread holds.
Location & tenants
- Location reads 67/100 on livability (#491 in IL) — a middle-class / working-renter tenant base. Strengths: cost of living A+, housing A+, crime B; Watch: amenities F, commute F, health & safety F.
- Collinsville CUSD 10 (suburban): math 14% / reading 20% proficiency, ranked #465 of 620 in IL (top 75%) — low school quality limits family demand, transient renter base, plan for 1-2y turnover.
- Zoned schools: Collinsville High School (math 16% / reading 21%, grade F, #427 of 693 statewide, top 62%, 1,978 students, 0% FRL) — zoned schools average 0% FRL vs 52% district-wide (52 pts lower); this property's tenant base skews higher-income than the district average.
- Market conditions: Rents rising (+3.1%/yr); 83 active listings in the ZIP; 5 comparable units currently listed for rent nearby; rentals leasing fast (median 8d on market — plan ~1-2 weeks tenant-placement turnaround); 40% of comp listings sitting > 30 days — soft ceiling on asking rent; 336 units permitted in Madison County in 2024 (0 in 5+ unit buildings).
- This rent runs 41% of the median local income ($70k/yr) — at the standard rent-burdened threshold; future hikes will face affordability resistance.
Forward outlook
- Local home prices are declining (-3.0%/yr); year-one equity from $1k of loan paydown is wiped out by about $5k of value loss. Plan a longer hold.
- Madison County population projected at -18% by 2050 — secular population decline; favor cash flow + early exit over multi-decade hold.
- At projected returns (-3.0% appreciation + 3.1% rent growth), your $45k cash investment doubles in ~7 years — after that, you're playing with house money.
Negotiation context
- It's been on market 34 days — a 3% lower offer ($155k) is reasonable based on typical stale-listing flexibility.
- Current owner paid $82k; list at $160k implies a 95% gain — meaningful room to come down on a strong offer.
Risks & watch-outs
- Watch-outs: built in 1900 — expect roof / HVAC / electrical / plumbing capex.
- Climate carrying-cost: extreme-heat days projected 7→21/yr by 2055 (HVAC capex compounding) — expect insurance premiums to compound above CPI over the hold.
Questions for the listing agent
- It's been on market 34 days. Have you received any prior offers? Is the seller open to a 3% concession, seller financing, or rate buy-down credit?
- Built in 1900 — when were the roof, HVAC, electrical panel, plumbing, and water heater last replaced?
- Is there a deadline driving the sale (1031 exchange, divorce, estate, relocation)? That informs how much negotiation room exists.
- Schools are D-rated, which usually means shorter tenancies and higher turnover. Who's the typical renter profile here, and what's been the actual vacancy rate?
- What's the average days-on-market for RENTAL listings here right now (not sales)? A rising rental-DOM trend means longer vacancies and softer asking-rent achievability than the comps imply.
- What's the recent tenant-quality profile in this submarket — average credit score on applications, eviction rate, late-payment / NSF rate, and stable-employment percentage? A property-management company in the area should have these aggregated.
- How much new apartment / multifamily construction is in the pipeline within 1–3 miles? Heavy new supply (>2% of stock underway) typically softens rents 12–24 months out; light construction supports rent growth.
Investment metrics
- 1% rule
- 1.47% ✓
- Cap rate
- 11.41%
- Cash-on-cash
- 18.29%
- DSCR
- 1.81
- GRM
- 5.7
CMA / ARV
- ARV (median comp)
- $149,547
- List price
- $160,000
- Delta
- 6.99%
- Verdict
- FAIR
- Comps
- 11 within 1.0 mi
Show comp detail 2 sales within ~0.75 mi
| Address | Dist | Beds/Ba | Sqft | Sold | Price | $/sf | Match |
|---|---|---|---|---|---|---|---|
| 246 Center | 0.36mi | 3/2.0 (+1) | 2,100 (+9%) | 12mo | $60,000 | $29 | 48 |
| 231 South St | 0.53mi | 3/3.0 (+1) | 2,128 (+11%) | 21mo | $125,000 | $59 | 35 |
Match score weights: distance 35% · size 25% · config 20% · recency 20%. Top-matched comps best support the ARV.
Projected returns pro-forma
-3.0% appreciation · 3.1% rent growth · sell at horizon
- IRR
- 10.1%
- Equity multiple
- 1.40×
- Total profit
- $17,875
- Equity at exit
- $23,857
- IRR
- 19.3%
- Equity multiple
- 2.63×
- Total profit
- $72,866
- Equity at exit
- $13,834
Cash invested: $44,800 (down + closing). Projections, not guarantees.
Landlord ↔ Tenant lean methodology
- Overall (STATE)
- 43 Moderately Tenant-Leaning
- State Illinois
- 43 Moderately Tenant-Leaning · D+7
- County
- — inherits STATE
- City
- — inherits STATE
ZIP-level market 62234
- Home prices YoY
- -17.1%
- Rents YoY
- 3.1%
- Active inventory
- 83
- Price-to-rent
- 10.7×
Monthly cashflow live
- Estimated rent
- $2,359 high interval (Pro) →
- Mortgage (P&I)
- −$839
- Tax from tax record
- −$275 /mo · $3,302/yr
- Insurance
- −$67
- HOA
- −$0
- Vacancy / Maint / Mgmt
- −$495
- Net cashflow
- $683
Break-even live
Sensitivity live
| Price | -10% $773 | -5% $728 | +0% $683 | +5% $637 | +10% $592 |
|---|---|---|---|---|---|
| Rent | -10% $496 | -5% $590 | +0% $683 | +5% $776 | +10% $869 |
| Rate | -1.0pp $763 | -0.5pp $723 | base $683 | +0.5pp $641 | +1.0pp $599 |
2-unit breakdown (identical units grouped — click to expand)
| Units | Beds | Baths | Est. rent |
|---|---|---|---|
| 1× unit | 3 | 2 | $1,251 |
| 1× unit | 2 | 1 | $1,109 |
| Total (2 units) | $2,359 | ||
UW: 25.0% down · 7.5% · 30yr · 1.5% tax · 5.0% vac · 8.0% maint · 8.0% mgmt
Financing live
Cash to close
- Down payment
- $40,000
- Closing costs
- $4,800
- Reserves months
- —
- Total cash needed
- —
Loan-product check · same deal, 3 products live
Conventional
25% down · 7.5% · 30yr
- Down + closing
- —
- Monthly P&I
- —
- Monthly cashflow
- —
- DSCR
- —
- Eligible?
- —
Personal DTI + credit; lowest rate.
DSCR
20% down · 8.5% · 30yr
- Down + closing
- —
- Monthly P&I
- —
- Monthly cashflow
- —
- DSCR
- —
- Eligible?
- —
No personal income docs; deal must DSCR.
Hard money
10% down · 12.0% · 12mo
- Down + closing
- —
- Monthly P&I
- —
- Monthly cashflow
- —
- DSCR
- —
- Eligible?
- —
Short-term bridge; refi at stabilization.
Rent comps 5 comps
| Address | Beds | Baths | Sqft | Rent | $/sqft | DOM | Units | Dist |
|---|---|---|---|---|---|---|---|---|
| 921 Vine St Collinsville, IL | 3.0 | 2.0 | 1274 | $1,875 | $1.47 | 2d | 1 | 0.34mi |
| 307 N Clinton St Collinsville, IL | 3.0 | 2.0 | 1395 | $1,700 | $1.22 | 2d | 1 | 0.44mi |
| 108 S Hesperia St Collinsville, IL | 2.0 | 2.0 | 1450 | $1,300 | $0.90 | 8d | 1 | 0.64mi |
| 300 Bethel Rd Collinsville, IL | 3.0 | 1.0 | 1250 | $1,350 | $1.08 | 44d | 1 | 0.80mi |
| 1302 Eileen St Collinsville, IL | 3.0 | 2.0 | 1700 | $1,650 | $0.97 | 44d | 1 | 1.28mi |
Listing history 18 events
-
2026-06-18days on market $160,000 Active 34 DOM
-
2026-06-17days on market $160,000 Active 33 DOM
-
2026-06-16days on market $160,000 Active 32 DOM
-
2026-06-15days on market $160,000 Active 31 DOM
-
2026-06-13days on market $160,000 Active 29 DOM
-
2026-06-13days on market $160,000 Active 28 DOM
-
2026-06-09days on market $160,000 Active 25 DOM
-
2026-06-08days on market $160,000 Active 24 DOM
-
2026-06-07days on market $160,000 Active 23 DOM
-
2026-06-05days on market $160,000 Active 20 DOM
-
2026-06-03days on market $160,000 Active 19 DOM
-
2026-06-02days on market $160,000 Active 18 DOM
-
2026-06-01days on market $160,000 Active 17 DOM
-
2026-05-31days on market $160,000 Active 16 DOM
-
2026-05-15$160,000 Active 1041-char remark
-
2013-12-11soldstatus $82,000
-
2007-02-21soldstatus $78,000
-
1989-05-31soldstatus $94,000
ⓘ Source: listings_history table (triggers on properties + properties_extension) + one-shot
backfill from property_details.listing_events for pre-trigger history.
Tax reassessment forecast IL · Partial reset (capped growth)
- Current annual tax
- $3,302 · $275/mo
- Projected year-2 tax
- $3,467 · $289/mo
- Expected delta
- +$165/yr (+$14/mo · 5.0%)
ⓘ Screening estimate from a state-policy table — verify with the county assessor before closing.
Climate risk First Street
- Flood 1/10 Low FEMA zone X · 0% chance over 30 yrs
- Wildfire 1/10 Low
- Heat 5/10 Major 7 d/yr ≥107°F today · 21 d/yr by 30 yrs out
- Wind 2/10 Low 100% chance of damaging wind over 30 yrs
- Air quality 3/10 Moderate 3 unhealthy d/yr today · 4 by 30 yrs out
Nearby sold comps map
Loading sold comps map…
Walkable amenities ~0.75 mi
Loading nearby amenities…
Taxation est. · year 1
- Rental income
- $28,308
- − Mortgage interest
- −$8,962
- − Property taxes
- −$3,302
- − Insurance
- −$800
- − Repairs & maintenance
- −$2,265
- − Management
- −$2,265
- − Depreciation
- −$4,655
- Taxable income
- $6,060
- Est. tax owed @ 24.0%
- −$1,454
- After-tax cash flow
- $6,738/yr
For passive investors: Depreciation is non-cash, so a rental often shows a tax loss while cash-flowing — sheltering income. Rental losses are passive: they offset passive income freely, and up to $25,000/yr can offset ordinary (W-2) income if you actively participate and your MAGI is under $100k (phasing out to $0 by $150k); unused losses carry forward. On sale, claimed depreciation is recaptured at up to 25%, and gains may owe capital-gains tax (a 1031 exchange can defer both). Figures are a year-1 estimate at your 24.0% rate — not tax advice; consult a CPA.
Schools (NCES district)
- District
- Collinsville CUSD 10
- NCES district ID
- 1710650
- Math proficiency
- 14% ▼ -9.00%
- Reading proficiency
- 20% ▼ -7.00%
- Median HH income
- $52,504
- Composite
- 15.65/100
- National rank
- #9288
- State rank
- #465 of 620 in IL
Livability — Collinsville
- Score
- 67/100
- State rank
- #491
- US rank
- #10221
Category grades
Schools grade is shown separately in the Schools card above.
Census & demographics
- Census place
- Collinsville, IL
- County
- Madison County · 189,064 people
- City population
- 31,648
- Metro
- St. Louis, MO-IL
- Population (ZIP)
- 31,648
- Household income
- $69,607
- Rent vs Own
- Severe rent burden
- 801.0
Population outlook (Madison County) Hauer SSP2
- Today (2025)
- 258,371 people
- By 2030
- 251,523 · -2.7%
- By 2040
- 233,640 · -9.6%
- By 2050
- 213,042 · -17.5%
- By 2075
- 165,255 · -36.0%
- By 2100
- 123,953 · -52.0%
Race, ethnicity, and origin ACS 2023
- Neighborhood character
- Predominantly White (73%)
- Race & ethnicity
- White 73% Black 13% Hispanic / Latino 10% Two or more races 8%
- Hispanic origin (detail)
- Mexican 7%
- Common ancestry
- Romanian 3% Lithuanian 3% Slovak 1%
- Foreign-born
- 4% · Canada
- Languages at home
- 92% English-only · Spanish 6%
Political lean MEDSL · Madison
- 2024 margin
- R (+13.3) · D 42.5% · R 55.8% · Other 1.8%
- 2008→2024 swing
- -22.5pp toward R · 2008: 9.2pp · 2024: -13.3pp
- All cycles
- 2024: R+13.3 2020: R+13.2 2016: R+15.6 2012: R+1.4 2008: D+9.2
Not yet ingested
- Civics
- —
Market trends
- HPI YoY
- ▼ -46.21%
- Current HPI
- 223.6438
- Rent YoY
- ▲ 3.10%
- Metro
- St. Louis, MO-IL
- State GDP YoY
- ▲ 1.59%
- F500 in state
- 60
Industry mix (Fortune 500 HQ in IL)
| Industry | F500 HQs | Revenue |
|---|---|---|
| Insurance | 4 | $201B |
|
||
| Consumer Goods | 4 | $87B |
|
||
| Industrial Machinery | 3 | $64B |
|
||
| Healthcare | 2 | $55B |
|
||
| Retail / Pharmacy | 1 | $148B |
|
||
| Agriculture / Food | 1 | $86B |
|
||
Price history
+70.2% since first listed4 events — show timeline
- 2026-05-15 Listed $160,000 MARIS as Distributed by MLS Grid
- 2013-12-11 Sold (Public Records) $82,000 Public Records
- 2007-02-21 Sold (Public Records) $78,000 Public Records
- 1989-05-31 Sold (Public Records) $94,000 Public Records
Property tax history
+2.7%/yrLatest (2024): $3,302 · +5.0% YoY. Source: county tax records.
Cash-flow waterfall
monthlySold comps — $/sqft
last 12 mo · ≤1 miLoading sold comps…