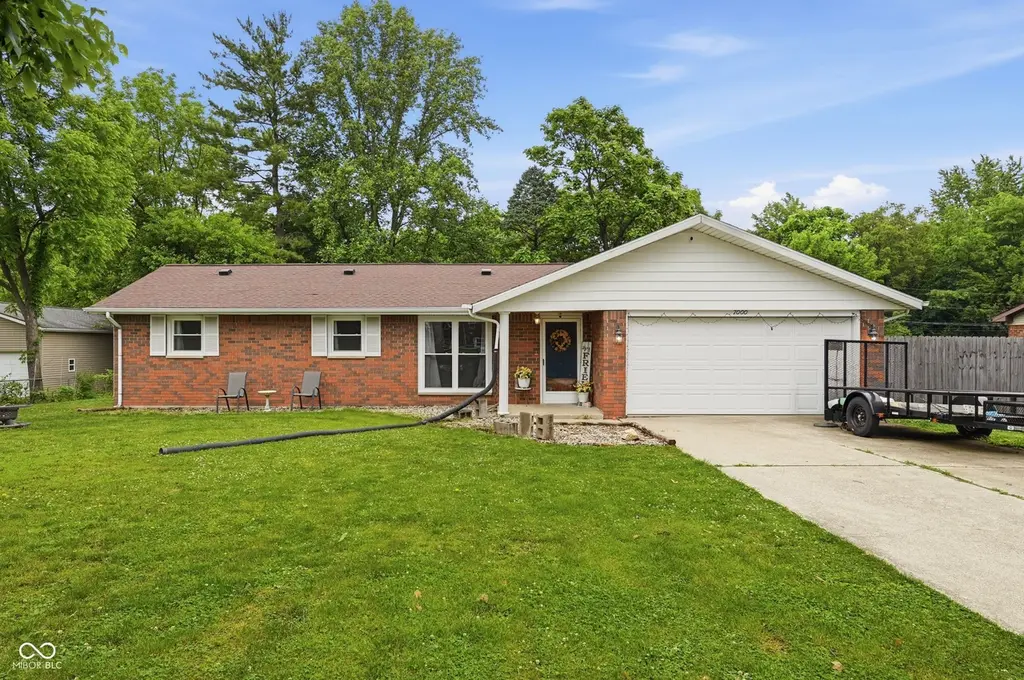
7000 W Edgewood Dr · Yorktown, IN
Flood risk 1/10 · Minimal
- FEMA flood zone
- X (unshaded)
- Chance of flooding over 30 yrs
- 0.0%
- Est. flood insurance / yr
- $507 – $1,088
Fire risk 1/10 · Minimal
- Est. fire insurance / yr
- $717 – $1,331
Heat risk 3/10 · Minor
- Hot days now (above 100°F)
- 7 days/yr
- Hot days in 30 yrs
- 18 days/yr
Wind risk 2/10 · Minimal
- Chance of severe wind over 30 yrs
- 1.0%
Air-quality risk 2/10 · Minimal
- Unhealthy air days now
- 1 days/yr
- Unhealthy air days in 30 yrs
- 2 days/yr
Risk factors via First Street. Map © Google.
Why this score? — see what drove the D+ grade
The composite is a weighted blend of 9 inputs, each scored 0–100. Each bar is that input's sub-score; the figure is the points it added to the 100-point composite (weight × sub-score).
- ARV discount +15.0/15.0
- Cash flow +13.7/30.0
- Schools +4.3/10.0
- DSCR +4.1/10.0
- Livability +3.7/5.0
- 1% rule +2.8/10.0
- Rent growth +2.5/5.0
- Condition / age +2.5/5.0
- Appreciation +0.0/10.0
$219,900
🖨 Deal sheet 📄 Offer letter ✓ Due diligence
Listing remarks MLS
Yorktown School district. This move-in-ready home features 3 bedrooms, 2 bathrooms, and a fenced-in backyard. According to the sellers, the property includes several recent updates: - HVAC: New in 2025 - Windows: New vinyl windows in 2024 - Kitchen: Newer cabinets, sink, faucet, and sliding door (2024) - Interior: Fresh paint in the family room, living room, and kitchen, along with updated flooring and lighting. The home offers a large eat-in kitchen, a spacious family room and living room, and abundant storage. It is also conveniently located near local schools and parks
Key facts
- Newer cabinets
- Large eat-in kitchen
- Fresh paint
Tags
Property features AI
Finance
- Other: Property type listed as Residential; Lot size approximately 0.37 acres (about 1/4–1/2 acre)
Exterior
- Parking: Attached 2-car garage
- Security: Smoke detector(s)
- Utilities: Municipal sewer connection; Private water source; Solid waste service available
- Home design: Single family residence; One level
- Construction: Brick construction; Crawl space foundation
- Exterior features: Storage shed; Has a view
Interior
- Kitchen: Electric oven; Refrigerator; Dishwasher; Range hood
- Bedrooms: Three bedrooms on the main level (all bedrooms located on main)
- Bathrooms: Two full bathrooms (both on the main level)
- Heating & cooling: Forced air heating (natural gas); Central air conditioning
- Interior features: Smoke detectors; Living room; Family room; Foyer; Storage shed
- Laundry & utility: Laundry closet
Neighborhood map
What this means for you Summary
Snapshot
- This is a 3-bed/2.0-bath single-family listed at $220k.
Deal economics
- At list price, monthly cash flow is $15 ($185/yr) — positive.
- The deal already cash-flows at list — no discount required.
- To meet the 1% rule (rent ≥ 1% of price), the offer needs to be $172k (21.6% below list).
- Recommended offer: $172k (21.6% below list) — sets the bar for 1% rule.
- Cap rate 6.4% vs local median 3.4% in Yorktown — top-decile yield for the area; either an underpriced asset or a hidden risk that comps aren't pricing in. Stress-test before assuming the spread holds.
Location & tenants
- Location reads 73/100 on livability (#99 in IN) — a middle-class / working-renter tenant base. Strengths: crime A+, cost of living A+, housing A+; Watch: health & safety D, amenities F, commute F.
- Yorktown Community Schools (suburban): math 49% / reading 51% proficiency, ranked #48 of 301 in IN (top 16%) — acceptable for families but not a draw, mixed tenant base, ~2y average lease.
- Market conditions: 46 active listings in the ZIP; 1 comparable units currently listed for rent nearby; 171 units permitted in Delaware County in 2024 (57 in 5+ unit buildings).
Forward outlook
- Local home prices are declining (-3.0%/yr); year-one equity from $2k of loan paydown is wiped out by about $7k of value loss. Plan a longer hold.
- Delaware County population projected at -11% by 2050 — secular population decline; favor cash flow + early exit over multi-decade hold.
Negotiation context
- Only 10 days on market — expect competitive offers; lowballing is unlikely to land.
- 5 sale attempts since 10y ago with the ask held roughly flat each time — persistent listings suggest the price (not the market) is what's stuck; bring a comps-based counter.
- Current owner paid $116k; list at $220k implies a 90% gain — meaningful room to come down on a strong offer.
Questions for the listing agent
- Built in 1970 — when were the roof, HVAC, electrical panel, plumbing, and water heater last replaced?
- Is there a deadline driving the sale (1031 exchange, divorce, estate, relocation)? That informs how much negotiation room exists.
- Schools are B-rated — typically a magnet for longer-tenancy family renters. What's the average tenant stay here, and is there a school-zone premium baked into asking?
- The area grade is low — what's the realistic commute time and amenity access for the typical tenant pool here? Any planned neighborhood developments (good or bad) we should know about?
- What's the average days-on-market for RENTAL listings here right now (not sales)? A rising rental-DOM trend means longer vacancies and softer asking-rent achievability than the comps imply.
- What's the recent tenant-quality profile in this submarket — average credit score on applications, eviction rate, late-payment / NSF rate, and stable-employment percentage? A property-management company in the area should have these aggregated.
- How much new for-sale + rental construction is in the pipeline within 1–3 miles? Heavy new supply typically softens prices + rents 12–24 months out; constrained supply supports both.
Investment metrics
- 1% rule
- 0.78% ✗
- Cap rate
- 6.38%
- Cash-on-cash
- 0.30%
- DSCR
- 1.01
- GRM
- 10.6
CMA / ARV
- ARV (on-the-fly)
- $269,535
- Comps found
- 12
Show comp detail 12 sales within ~0.75 mi
| Address | Dist | Beds/Ba | Sqft | Sold | Price | $/sf | Match |
|---|---|---|---|---|---|---|---|
| 7010 W Edgewood Dr | 0.02mi | 3/2.0 | 1,920 (+8%) | 11mo | $182,500 | $95 | 77 |
| 6416 W Franwood Cir | 0.52mi | 3/2.5 | 1,838 (+3%) | 1mo | $239,900 | $131 | 68 |
| 6330 W CR 200 S | 0.68mi | 3/2.0 | 1,768 (-1%) | 9mo | $194,900 | $110 | 59 |
| 1801 S O'hare Blvd | 0.66mi | 3/2.0 | 1,683 (-6%) | 3mo | $280,000 | $166 | 57 |
| 7800 W Kennedy Pkwy | 0.58mi | 3/2.0 | 1,924 (+8%) | 4mo | $349,900 | $182 | 57 |
| 7813 O'hare Cir | 0.66mi | 3/2.0 | 1,692 (-5%) | 6mo | $271,000 | $160 | 56 |
| 7816 W Frankie Ln | 0.65mi | 3/2.0 | 1,567 (-12%) | 2mo | $237,000 | $151 | 48 |
| 7920 W Angus Ave | 0.72mi | 3/2.0 | 1,618 (-9%) | 6mo | $205,000 | $127 | 46 |
| 7909 W Kennedy Pkwy | 0.69mi | 3/2.0 | 2,008 (+12%) | 2mo | $277,500 | $138 | 46 |
| 2001 S O'hare Blvd | 0.64mi | 3/2.0 | 1,599 (-10%) | 12mo | $287,500 | $180 | 43 |
| 2211 S Andrews Rd | 0.71mi | 2/1.0 (-1) | 1,918 (+8%) | 10mo | $199,900 | $104 | 37 |
| 7805 W Kennedy Pkwy | 0.60mi | 4/2.5 (+1) | 2,030 (+14%) | 9mo | $352,500 | $174 | 35 |
Match score weights: distance 35% · size 25% · config 20% · recency 20%. Top-matched comps best support the ARV.
Projected returns pro-forma
-3.0% appreciation · 3.0% rent growth · sell at horizon
- IRR
- -15.9%
- Equity multiple
- 0.44×
- Total profit
- $-34,730
- Equity at exit
- $32,788
- IRR
- -7.5%
- Equity multiple
- 0.52×
- Total profit
- $-29,301
- Equity at exit
- $19,013
Cash invested: $61,572 (down + closing). Projections, not guarantees.
Landlord ↔ Tenant lean methodology
- Overall (STATE)
- 90 Strongly Landlord-Friendly
- State Indiana
- 90 Strongly Landlord-Friendly · R+11
- County
- — inherits STATE
- City
- — inherits STATE
ZIP-level market 47396
- Home prices YoY
- -14.6%
- Active inventory
- 46
- Price-to-rent
- 10.6×
Monthly cashflow live
- Estimated rent
- $1,725 medium interval (Pro) →
- Mortgage (P&I)
- −$1,153
- Tax from tax record
- −$103 /mo · $1,230/yr
- Insurance
- −$92
- HOA
- −$0
- Vacancy / Maint / Mgmt
- −$362
- Net cashflow
- $15
Break-even live
UW: 25.0% down · 7.5% · 30yr · 1.5% tax · 5.0% vac · 8.0% maint · 8.0% mgmt
Financing live
Cash to close
- Down payment
- $54,975
- Closing costs
- $6,597
- Reserves months
- —
- Total cash needed
- —
Loan-product check · same deal, 3 products live
Conventional
25% down · 7.5% · 30yr
- Down + closing
- —
- Monthly P&I
- —
- Monthly cashflow
- —
- DSCR
- —
- Eligible?
- —
Personal DTI + credit; lowest rate.
DSCR
20% down · 8.5% · 30yr
- Down + closing
- —
- Monthly P&I
- —
- Monthly cashflow
- —
- DSCR
- —
- Eligible?
- —
No personal income docs; deal must DSCR.
Hard money
10% down · 12.0% · 12mo
- Down + closing
- —
- Monthly P&I
- —
- Monthly cashflow
- —
- DSCR
- —
- Eligible?
- —
Short-term bridge; refi at stabilization.
Rent comps 1 comps
| Address | Beds | Baths | Sqft | Rent | $/sqft | DOM | Units | Dist |
|---|---|---|---|---|---|---|---|---|
| 3001 S Broadway St Yorktown, IN | 3.0 | 1.5 | 1678 | $1,725 | $1.03 | 44d | 1 | 1.26mi |
Listing history 9 events
-
2026-06-19days on market $219,900 Active 10 DOM
-
2026-06-18days on market $219,900 Active 9 DOM
-
2026-06-17days on market $219,900 Active 8 DOM
-
2026-06-16days on market $219,900 Active 7 DOM
-
2026-06-15days on market $219,900 Active 6 DOM
-
2026-06-14days on market $219,900 Active 4 DOM
-
2026-06-13days on market $219,900 Active 3 DOM
-
2026-06-10remarks 584-char remark
-
2026-06-10$219,900 Active 1 DOM
ⓘ Source: listings_history table (triggers on properties + properties_extension) + one-shot
backfill from property_details.listing_events for pre-trigger history.
Tax reassessment forecast IN · Partial reset (capped growth)
- Current annual tax
- $1,230 · $103/mo
- Projected year-2 tax
- $1,550 · $129/mo
- Expected delta
- +$320/yr (+$27/mo · 26.0%)
ⓘ Screening estimate from a state-policy table — verify with the county assessor before closing.
Climate risk First Street
- Flood 1/10 Low FEMA zone X (unshaded) · 0% chance over 30 yrs
- Wildfire 1/10 Low
- Heat 3/10 Moderate 7 d/yr ≥100°F today · 18 d/yr by 30 yrs out
- Wind 2/10 Low 100% chance of damaging wind over 30 yrs
- Air quality 2/10 Low 1 unhealthy d/yr today · 2 by 30 yrs out
Nearby sold comps map
Loading sold comps map…
Walkable amenities ~0.75 mi
Loading nearby amenities…
Taxation est. · year 1
- Rental income
- $20,700
- − Mortgage interest
- −$12,318
- − Property taxes
- −$1,230
- − Insurance
- −$1,100
- − Repairs & maintenance
- −$1,656
- − Management
- −$1,656
- − Depreciation
- −$6,397
- Taxable loss
- −$3,657
- Est. tax savings @ 24.0%
- +$878
- After-tax cash flow
- $1,063/yr
For passive investors: Depreciation is non-cash, so a rental often shows a tax loss while cash-flowing — sheltering income. Rental losses are passive: they offset passive income freely, and up to $25,000/yr can offset ordinary (W-2) income if you actively participate and your MAGI is under $100k (phasing out to $0 by $150k); unused losses carry forward. On sale, claimed depreciation is recaptured at up to 25%, and gains may owe capital-gains tax (a 1031 exchange can defer both). Figures are a year-1 estimate at your 24.0% rate — not tax advice; consult a CPA.
Schools (NCES district)
- District
- Yorktown Community Schools
- NCES district ID
- 1807230
- Math proficiency
- 49% ▼ -8.00%
- Reading proficiency
- 51% ▼ -2.00%
- Median HH income
- $55,611
- Composite
- 43.32/100
- National rank
- #3036
- State rank
- #48 of 301 in IN
Livability — Yorktown
- Score
- 73/100
- State rank
- #99
- US rank
- #5439
Category grades
Schools grade is shown separately in the Schools card above.
Census & demographics
- Census place
- Yorktown, IN
- City population
- 7,808
- Population (ZIP)
- 7,808
Population outlook (Delaware County) Hauer SSP2
- Today (2025)
- 113,036 people
- By 2030
- 111,313 · -1.5%
- By 2040
- 106,432 · -5.8%
- By 2050
- 100,747 · -10.9%
- By 2075
- 91,000 · -19.5%
- By 2100
- 80,687 · -28.6%
Race, ethnicity, and origin ACS 2023
- Neighborhood character
- Predominantly White (95%)
- Race & ethnicity
- White 95% Two or more races 3% Asian 2%
- Common ancestry
- Italian 4% Slovak 3% Romanian 1%
- Foreign-born
- 1%
- Languages at home
- 98% English-only · Other Indo-European 1%
Political lean MEDSL · Delaware
- 2024 margin
- R (+15.8) · D 41.2% · R 57.0% · Other 1.8%
- 2008→2024 swing
- -30.8pp toward R · 2008: 15.0pp · 2024: -15.8pp
- All cycles
- 2024: R+15.8 2020: R+13.2 2016: R+13.7 2012: D+3.1 2008: D+15.0
Not yet ingested
- Civics
- —
Market trends
- HPI YoY
- ▼ -35.12%
- Current HPI
- 205.7559
- Rent YoY
- —
- Metro
- —
- State GDP YoY
- ▲ 2.90%
- F500 in state
- 18
Industry mix (Fortune 500 HQ in IN)
| Industry | F500 HQs | Revenue |
|---|---|---|
| Industrial Machinery | 2 | $37B |
|
||
| Healthcare | 1 | $177B |
|
||
| Pharmaceuticals | 1 | $45B |
|
||
| Metals / Steel | 1 | $18B |
|
||
| Agriculture | 1 | $17B |
|
||
| Packaging | 1 | $12B |
|
||
Price history
+214.6% since first listed8 events — show timeline
- 2026-06-09 Listed $219,900 IRMLS
- 2026-06-09 Listed $219,900 MIBOR as Distributed by MLS Grid
- 2020-03-24 Sold (MLS) $116,000 MIBOR as Distributed by MLS Grid
- 2020-02-28 Sold (MLS) $116,000 IRMLS
- 2020-01-27 Listed $114,900 MIBOR as Distributed by MLS Grid
- 2020-01-27 Listed $116,000 IRMLS
- 2017-05-22 Sold (MLS) $73,500 IRMLS
- 2016-12-05 Listed $69,900 IRMLS
Property tax history
+6.8%/yrLatest (2024): $1,230 · +6.3% YoY. Source: county tax records.
Cash-flow waterfall
monthlySold comps — $/sqft
last 12 mo · ≤1 miLoading sold comps…