2508 Brenda Dr · New Iberia, LA
Flood risk 4/10 · Minor
- FEMA flood zone
- X (unshaded)
- Chance of flooding over 30 yrs
- 0.22%
- Est. flood insurance / yr
- $507 – $1,088
Fire risk 1/10 · Minimal
- Est. fire insurance / yr
- $1,269 – $2,357
Heat risk 9/10 · Severe
- Hot days now (above 108°F)
- 7 days/yr
- Hot days in 30 yrs
- 21 days/yr
Wind risk 9/10 · Severe
- Chance of severe wind over 30 yrs
- 99.0%
Air-quality risk 1/10 · Minimal
- Unhealthy air days now
- 0 days/yr
- Unhealthy air days in 30 yrs
- 0 days/yr
Risk factors via First Street. Map © Google.
Why this score? — see what drove the C+ grade
The composite is a weighted blend of 9 inputs, each scored 0–100. Each bar is that input's sub-score; the figure is the points it added to the 100-point composite (weight × sub-score).
- Cash flow +25.2/30.0
- ARV discount +14.1/15.0
- DSCR +8.3/10.0
- 1% rule +5.5/10.0
- Livability +3.7/5.0
- Schools +3.2/10.0
- Rent growth +2.5/5.0
- Condition / age +2.5/5.0
- Appreciation +0.0/10.0
$120,000
🖨 Deal sheet 📄 Offer letter ✓ Due diligence
Listing remarks
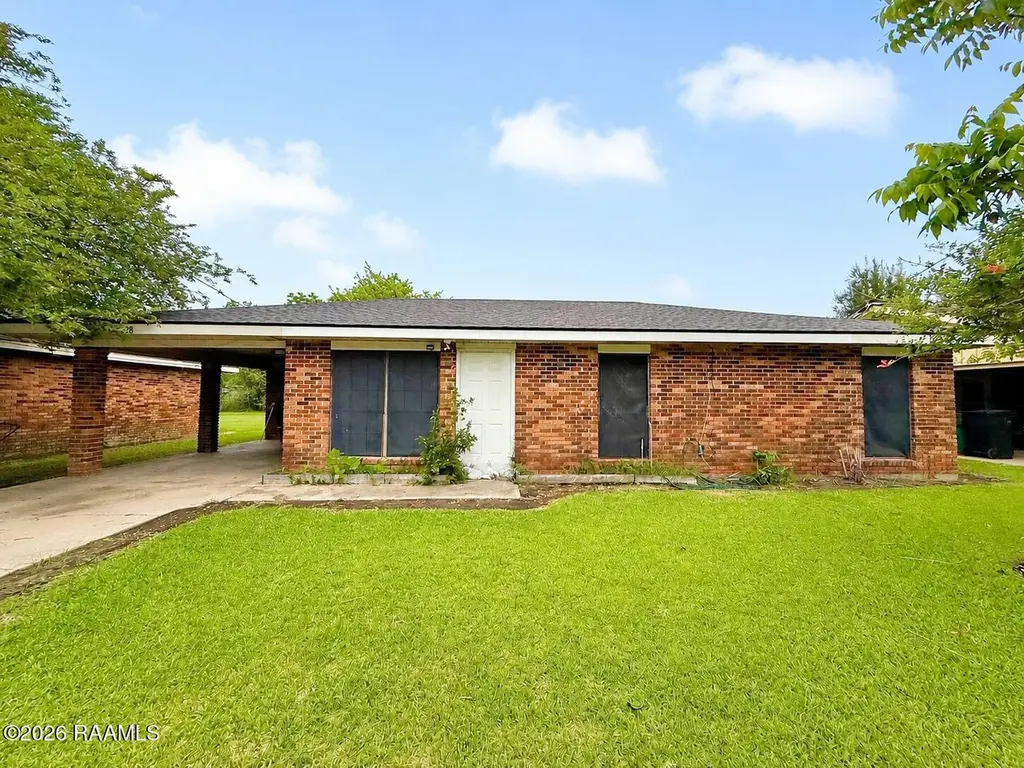
3 bedroom, 1.5 bathroom home located in New Iberia. Conveniently located right off the main highway and just 1 minute from the new First Solar plant, offering quick access to one of the area's growing employment hubs. The home has a functional layout, covered parking, and spacious yard. Seller is offering a $5,000 credit to buyer at closing, which may be used toward closing costs, repairs, or improvements. Property is being sold AS IS, and seller will make no repairs. Schedule your showing today!
Key facts
- Spacious yard
- Covered parking
- Quick access
Tags
Property features AI
Exterior
- Parking: Carport (1 covered space, total 1 parking space)
- Utilities: Public sewer; Electric service: CLECO
- Home design: Single family residence; City street frontage
- Construction: Brick and brick veneer construction; Composition roof
- Exterior features: Covered patio/porch
Interior
- Kitchen: Electric cooktop; Electric stove
- Flooring: Laminate
- Bathrooms: 1 full bathroom; 1 half bathroom
- Heating & cooling: Central heating; Central air conditioning
- Interior features: Bathroom on first floor; Laminate flooring; Electric cooktop; Electric stove
Neighborhood map
What this means for you Summary
Snapshot
- This is a 3-bed/1.5-bath other listed at $120k.
Deal economics
- At list price, monthly cash flow is $270 ($3k/yr) — positive.
- The deal already cash-flows at list — no discount required.
- Meets the 1% rule at list price ($1k rent vs $120k).
- Recommended offer: $116k (3.0% below list) — sets the bar for market timing.
- Cap rate 9.0% vs local median 5.8% in New Iberia — top-decile yield for the area; either an underpriced asset or a hidden risk that comps aren't pricing in. Stress-test before assuming the spread holds.
Location & tenants
- Location reads 73/100 on livability (#33 in LA) — a middle-class / working-renter tenant base. Strengths: cost of living A+, housing A+, health & safety A+; Watch: commute D+, crime F, employment F.
- Iberia Parish (other): math 32% / reading 43% proficiency, ranked #27 of 98 in LA (top 28%) — families likely to look elsewhere, expect single-tenant / working-renter base with shorter leases; 66% free/reduced lunch — lower-income household profile, screen leases tightly.
- Zoned schools: Iberia Middle School (math 20% / reading 40%, grade F, #114 of 218 statewide, top 53%, 498 students, 77% FRL); Westgate High School (math 17% / reading 37%, grade F, #136 of 265 statewide, top 55%, 993 students, 77% FRL).
- Market conditions: 237 active listings in the ZIP; 94 units permitted in Iberia Parish in 2024 (0 in 5+ unit buildings).
Forward outlook
- Local home prices are declining (-3.0%/yr); year-one equity from $830 of loan paydown is wiped out by about $4k of value loss. Plan a longer hold.
- Iberia County population projected to shrink 4% by 2050 — rents likely to lag national; underwrite the cash flow, not the appreciation.
Negotiation context
- It's been on market 38 days — a 3% lower offer ($116k) is reasonable based on typical stale-listing flexibility.
Risks & watch-outs
- Climate carrying-cost: severe wind risk, 99% chance of damaging wind over 30y; extreme-heat days projected 7→21/yr by 2055 (HVAC capex compounding) — expect insurance premiums to compound above CPI over the hold.
Questions for the listing agent
- It's been on market 38 days. Have you received any prior offers? Is the seller open to a 3% concession, seller financing, or rate buy-down credit?
- Is there a deadline driving the sale (1031 exchange, divorce, estate, relocation)? That informs how much negotiation room exists.
- Schools are B-rated — typically a magnet for longer-tenancy family renters. What's the average tenant stay here, and is there a school-zone premium baked into asking?
- Crime grade is F in this area — have there been break-ins, vandalism, or insurance claims at this property in the last 3 years? What carrier currently insures it and at what premium?
- What's the average days-on-market for RENTAL listings here right now (not sales)? A rising rental-DOM trend means longer vacancies and softer asking-rent achievability than the comps imply.
- What's the recent tenant-quality profile in this submarket — average credit score on applications, eviction rate, late-payment / NSF rate, and stable-employment percentage? A property-management company in the area should have these aggregated.
- How much new for-sale + rental construction is in the pipeline within 1–3 miles? Heavy new supply typically softens prices + rents 12–24 months out; constrained supply supports both.
Investment metrics
- 1% rule
- 1.05% ✓
- Cap rate
- 8.99%
- Cash-on-cash
- 9.63%
- DSCR
- 1.43
- GRM
- 8.0
CMA / ARV
- ARV (median comp)
- $140,453
- List price
- $120,000
- Delta
- -14.56%
- Verdict
- UNDERPRICED
- Comps
- 7 within 1.0 mi
Projected returns pro-forma
-3.0% appreciation · 3.0% rent growth · sell at horizon
- IRR
- -1.8%
- Equity multiple
- 0.93×
- Total profit
- $-2,321
- Equity at exit
- $17,892
- IRR
- 7.8%
- Equity multiple
- 1.59×
- Total profit
- $19,902
- Equity at exit
- $10,375
Cash invested: $33,600 (down + closing). Projections, not guarantees.
Landlord ↔ Tenant lean methodology
- Overall (STATE)
- 90 Strongly Landlord-Friendly
- State Louisiana
- 90 Strongly Landlord-Friendly · R+12
- County
- — inherits STATE
- City
- — inherits STATE
ZIP-level market 70560
- Home prices YoY
- -29.8%
- Active inventory
- 237
- Price-to-rent
- 8.0×
Monthly cashflow live
- Estimated rent
- $1,257 medium interval (Pro) →
- Mortgage (P&I)
- −$629
- Tax from tax record
- −$44 /mo · $530/yr
- Insurance
- −$50
- HOA
- −$0
- Vacancy / Maint / Mgmt
- −$264
- Net cashflow
- $270
Break-even live
UW: 25.0% down · 7.5% · 30yr · 1.5% tax · 5.0% vac · 8.0% maint · 8.0% mgmt
Financing live
Cash to close
- Down payment
- $30,000
- Closing costs
- $3,600
- Reserves months
- —
- Total cash needed
- —
Loan-product check · same deal, 3 products live
Conventional
25% down · 7.5% · 30yr
- Down + closing
- —
- Monthly P&I
- —
- Monthly cashflow
- —
- DSCR
- —
- Eligible?
- —
Personal DTI + credit; lowest rate.
DSCR
20% down · 8.5% · 30yr
- Down + closing
- —
- Monthly P&I
- —
- Monthly cashflow
- —
- DSCR
- —
- Eligible?
- —
No personal income docs; deal must DSCR.
Hard money
10% down · 12.0% · 12mo
- Down + closing
- —
- Monthly P&I
- —
- Monthly cashflow
- —
- DSCR
- —
- Eligible?
- —
Short-term bridge; refi at stabilization.
Listing history 18 events
-
2026-06-18days on market $120,000 Active 38 DOM
-
2026-06-17days on market $120,000 Active 37 DOM
-
2026-06-16days on market $120,000 Active 36 DOM
-
2026-06-15days on market $120,000 Active 35 DOM
-
2026-06-14days on market $120,000 Active 33 DOM
-
2026-06-13days on market $120,000 Active 32 DOM
-
2026-06-10days on market $120,000 Active 30 DOM
-
2026-06-09days on market $120,000 Active 29 DOM
-
2026-06-08days on market $120,000 Active 28 DOM
-
2026-06-07days on market $120,000 Active 27 DOM
-
2026-06-05days on market $120,000 Active 24 DOM
-
2026-06-03days on market $120,000 Active 23 DOM
-
2026-06-02days on market $120,000 Active 22 DOM
-
2026-06-01days on market $120,000 Active 21 DOM
-
2026-05-31remarks 501-char remark
-
2026-05-31pricedays on market $120,000 Active 20 DOM
-
2026-05-30days on market $130,000 Active 19 DOM
-
2026-05-11$130,000 Active 425-char remark
ⓘ Source: listings_history table (triggers on properties + properties_extension) + one-shot
backfill from property_details.listing_events for pre-trigger history.
Tax reassessment forecast LA · Resets to sale price
- Current annual tax
- $530 · $44/mo
- Projected year-2 tax
- $660 · $55/mo
- Expected delta
- +$130/yr (+$11/mo · 24.6%)
ⓘ Screening estimate from a state-policy table — verify with the county assessor before closing.
Climate risk First Street
- Flood 4/10 Moderate FEMA zone X (unshaded) · 22% chance over 30 yrs
- Wildfire 1/10 Low
- Heat 9/10 Extreme 7 d/yr ≥108°F today · 21 d/yr by 30 yrs out
- Wind 9/10 Extreme 99% chance of damaging wind over 30 yrs
- Air quality 1/10 Low 0 unhealthy d/yr today · 0 by 30 yrs out
Nearby sold comps map
Loading sold comps map…
Walkable amenities ~0.75 mi
Loading nearby amenities…
Taxation est. · year 1
- Rental income
- $15,084
- − Mortgage interest
- −$6,722
- − Property taxes
- −$530
- − Insurance
- −$600
- − Repairs & maintenance
- −$1,207
- − Management
- −$1,207
- − Depreciation
- −$3,491
- Taxable income
- $1,328
- Est. tax owed @ 24.0%
- −$319
- After-tax cash flow
- $2,916/yr
For passive investors: Depreciation is non-cash, so a rental often shows a tax loss while cash-flowing — sheltering income. Rental losses are passive: they offset passive income freely, and up to $25,000/yr can offset ordinary (W-2) income if you actively participate and your MAGI is under $100k (phasing out to $0 by $150k); unused losses carry forward. On sale, claimed depreciation is recaptured at up to 25%, and gains may owe capital-gains tax (a 1031 exchange can defer both). Figures are a year-1 estimate at your 24.0% rate — not tax advice; consult a CPA.
Schools (NCES district)
- District
- Iberia Parish
- NCES district ID
- 2200720
- Math proficiency
- 32% ▼ -43.00%
- Reading proficiency
- 43% ▼ -35.00%
- Median HH income
- $43,289
- Composite
- 31.74/100
- National rank
- #5904
- State rank
- #27 of 98 in LA
Livability — New Iberia
- Score
- 73/100
- State rank
- #33
- US rank
- #5376
Category grades
Schools grade is shown separately in the Schools card above.
Census & demographics
- Population (ZIP)
- 37,589
Population outlook (Iberia County) Hauer SSP2
- Today (2025)
- 74,632 people
- By 2030
- 74,368 · -0.4%
- By 2040
- 73,223 · -1.9%
- By 2050
- 71,728 · -3.9%
- By 2075
- 69,028 · -7.5%
- By 2100
- 65,018 · -12.9%
Race, ethnicity, and origin ACS 2023
- Neighborhood character
- Diverse neighborhood (Simpson 0.61)
- Race & ethnicity
- White 52% Black 35% Two or more races 8% Hispanic / Latino 6% Asian 2%
- Hispanic origin (detail)
- Mexican 2%
- Common ancestry
- Lithuanian 11% Italian 1% Serbian 1%
- Foreign-born
- 3% · Canada
- Languages at home
- 93% English-only · French/Haitian/Cajun 3% Spanish 2% Other Asian/Pacific 1%
Political lean MEDSL · Iberia
- 2024 margin
- Solid R (+34.1) · D 32.4% · R 66.5% · Other 1.1%
- 2008→2024 swing
- -11.1pp toward R · 2008: -23.0pp · 2024: -34.1pp
- All cycles
- 2024: R+34.1 2020: R+31.2 2016: R+31.4 2012: R+26.2 2008: R+23.0
Not yet ingested
- Civics
- —
Market trends
- HPI YoY
- ▼ -65.82%
- Current HPI
- 154.9018
- Rent YoY
- —
- Metro
- —
- State GDP YoY
- ▲ 3.29%
- F500 in state
- 10
Industry mix (Fortune 500 HQ in LA)
| Industry | F500 HQs | Revenue |
|---|---|---|
| Telecommunications | 2 | $23B |
|
||
| Utilities | 1 | $12B |
|
||
| Wholesale / Distribution | 1 | $5B |
|
||
| Advertising | 1 | $2B |
|
||
Price history
-7.7% since first listed2 events — show timeline
- 2026-05-30 Price Changed $120,000 AcadianaMLS
- 2026-05-11 Listed $130,000 AcadianaMLS
Property tax history
+0.3%/yrLatest (2025): $530 · +1.7% YoY. Source: county tax records.
Cash-flow waterfall
monthlySold comps — $/sqft
last 12 mo · ≤1 miLoading sold comps…