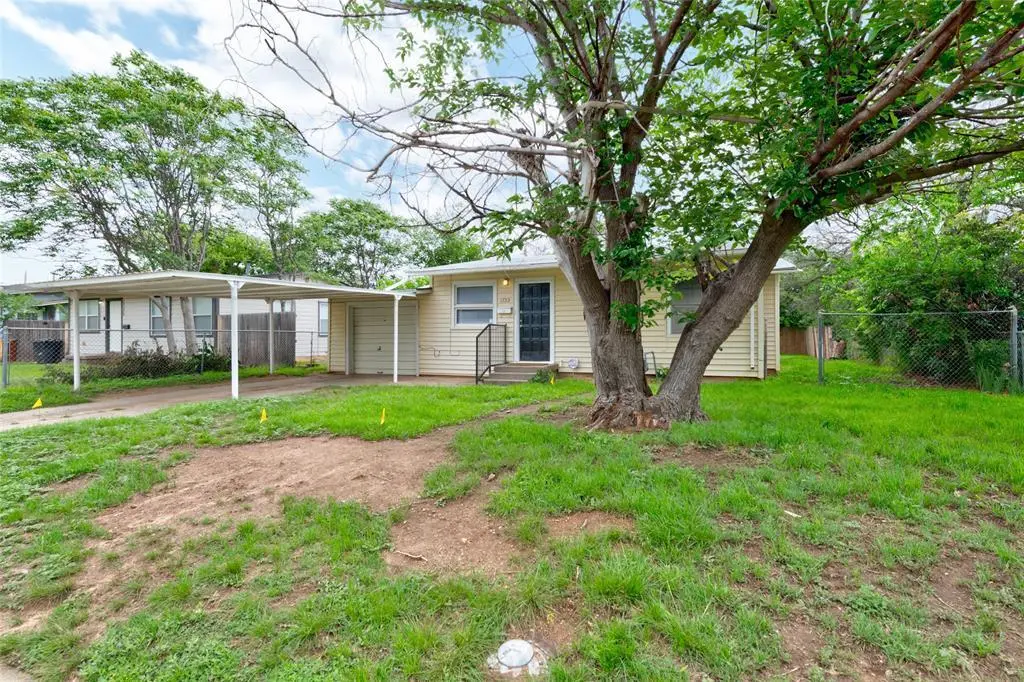
1733 Palm St · Abilene, TX
Flood risk 4/10 · Minor
- FEMA flood zone
- X (unshaded)
- Chance of flooding over 30 yrs
- 0.2%
- Est. flood insurance / yr
- $507 – $1,088
Fire risk 2/10 · Minimal
- Est. fire insurance / yr
- $1,222 – $2,270
Heat risk 7/10 · Major
- Hot days now (above 103°F)
- 7 days/yr
- Hot days in 30 yrs
- 24 days/yr
Wind risk 4/10 · Minor
- Chance of severe wind over 30 yrs
- 11.0%
Air-quality risk 1/10 · Minimal
- Unhealthy air days now
- 0 days/yr
- Unhealthy air days in 30 yrs
- 0 days/yr
Risk factors via First Street. Map © Google.
Why this score? — see what drove the B+ grade
The composite is a weighted blend of 9 inputs, each scored 0–100. Each bar is that input's sub-score; the figure is the points it added to the 100-point composite (weight × sub-score).
- Cash flow +30.0/30.0
- ARV discount +15.0/15.0
- 1% rule +10.0/10.0
- DSCR +10.0/10.0
- Rent growth +5.0/5.0
- Livability +3.8/5.0
- Schools +2.8/10.0
- Condition / age +2.5/5.0
- Appreciation +0.0/10.0
$159,900
🖨 Deal sheet 📄 Offer letter ✓ Due diligence
Listing remarks MLS
Tons of value add potential in this investment! Perfect flip or add to your rental-Airbnb portfolio with close proximity to McMurry University and central to local amenities. This house would also make a great affordable family home for the first-time home buyer. 'Feels like home' comes to mind as you walk in and the only thing missing is your ideas and personal touch! You'll love the large master bedroom and enclosed back porch! Don't hesitate, inquire about this one now!
Key facts
- Extended open patio
- Newer water heater
- New blinds
Tags
Property features AI
Finance
- HOA & community: No association; Community curbs
Exterior
- Parking: Attached carport; Garage (1 car) — garage faces front; Covered parking for 2 vehicles (including carport)
- Security: Smoke detector(s)
- Utilities: City water; City sewer; Electricity connected
- Home design: Single-family residence; One story; Residential property
- Construction: Built in 1952; Vinyl siding; Composition roof; Pillar/post/pier foundation
- Exterior features: Covered, screened porch; Wood fencing in backyard; Grassed yard; Interior lot; Curbs
Interior
- Kitchen: Electric range; Refrigerator
- Bedrooms: Primary bedroom (one level) — includes ensuite bath, built-in desk and walk-in closet; Bedroom (one level); Bedroom (one level)
- Flooring: Vinyl flooring
- Bathrooms: 2 full bathrooms
- Heating & cooling: Central air; Electric heating; Ceiling fan(s)
- Interior features: Walk-in closet(s); Built-in cabinets in kitchen; Built-in desk in primary bedroom; Ensuite bath in primary bedroom; Medicine cabinet
- Laundry & utility: Laundry located in garage
Neighborhood map
What this means for you Summary
Snapshot
- This is a 3-bed/2.0-bath single-family listed at $160k.
Deal economics
- At list price, monthly cash flow is $878 ($11k/yr) — positive.
- The deal already cash-flows at list — no discount required.
- Meets the 1% rule at list price ($3k rent vs $160k).
- Recommended offer: $158k (1.5% below list) — sets the bar for market timing.
- Cap rate 12.9% vs local median 6.7% in Abilene — top-decile yield for the area; either an underpriced asset or a hidden risk that comps aren't pricing in. Stress-test before assuming the spread holds.
Location & tenants
- Location reads 75/100 on livability (#142 in TX, #4,037 nationally) — a middle-class / working-renter tenant base. Strengths: cost of living A+, housing A+, health & safety A+; Watch: crime D, commute F.
- Abilene ISD (urban): math 32% / reading 34% proficiency, ranked #575 of 826 in TX (top 70%) — families likely to look elsewhere, expect single-tenant / working-renter base with shorter leases.
- Zoned schools: Bowie El (math 34% / reading 36%, grade F, #1,965 of 4,322 statewide, top 46%, 476 students, 87% FRL) — zoned schools average 87% FRL vs 57% district-wide (30 pts higher); higher-poverty schools than district average — tighter screening recommended.
- Market conditions: Rents rising fast (+33.5%/yr); 370 active listings in the ZIP; 10 comparable units currently listed for rent nearby; rentals at typical pace (median 21d on market — plan ~3-4 weeks tenant-placement turnaround); solid renter incomes; 508 units permitted in Taylor County in 2024 (0 in 5+ unit buildings).
- This rent runs 34% of the median local income ($90k/yr) — at the standard rent-burdened threshold; future hikes will face affordability resistance.
Forward outlook
- Local home prices are declining (-3.0%/yr); year-one equity from $1k of loan paydown is wiped out by about $5k of value loss. Plan a longer hold.
- Taylor County population projected at +16% by 2050 — long-run rental-demand tailwind backs the buy-and-hold thesis.
- At projected returns (-3.0% appreciation + 8.0% rent growth), your $45k cash investment doubles in ~5 years — after that, you're playing with house money.
Negotiation context
- It's been on market 22 days — a 2% lower offer ($158k) is reasonable based on typical stale-listing flexibility.
- 6 sale attempts since 16y ago with the ask held roughly flat each time — persistent listings suggest the price (not the market) is what's stuck; bring a comps-based counter.
Risks & watch-outs
- Watch-outs: built in 1952 — expect roof / HVAC / electrical / plumbing capex.
- Climate carrying-cost: extreme-heat days projected 7→24/yr by 2055 (HVAC capex compounding) — expect insurance premiums to compound above CPI over the hold.
Questions for the listing agent
- Built in 1952 — when were the roof, HVAC, electrical panel, plumbing, and water heater last replaced?
- Is there a deadline driving the sale (1031 exchange, divorce, estate, relocation)? That informs how much negotiation room exists.
- Schools are D-rated, which usually means shorter tenancies and higher turnover. Who's the typical renter profile here, and what's been the actual vacancy rate?
- Crime grade is D in this area — have there been break-ins, vandalism, or insurance claims at this property in the last 3 years? What carrier currently insures it and at what premium?
- What's the average days-on-market for RENTAL listings here right now (not sales)? A rising rental-DOM trend means longer vacancies and softer asking-rent achievability than the comps imply.
- What's the recent tenant-quality profile in this submarket — average credit score on applications, eviction rate, late-payment / NSF rate, and stable-employment percentage? A property-management company in the area should have these aggregated.
- How much new for-sale + rental construction is in the pipeline within 1–3 miles? Heavy new supply typically softens prices + rents 12–24 months out; constrained supply supports both.
Investment metrics
- 1% rule
- 1.59% ✓
- Cap rate
- 12.88%
- Cash-on-cash
- 23.52%
- DSCR
- 2.05
- GRM
- 5.2
CMA / ARV
- ARV (on-the-fly)
- $219,579
- Comps found
- 12
Show comp detail 12 sales within ~0.75 mi
| Address | Dist | Beds/Ba | Sqft | Sold | Price | $/sf | Match |
|---|---|---|---|---|---|---|---|
| 1733 Palm St | 0.00mi | 3/2.0 | 1,381 (0%) | 0mo | $159,900 | $116 | 100 |
| 1701 S 21st St | 0.43mi | 3/2.0 | 1,384 (+0%) | 2mo | $199,900 | $144 | 78 |
| 1150 S 15th St | 0.29mi | 3/2.0 | 1,293 (-6%) | 2mo | $146,900 | $114 | 74 |
| 2026 S 20th St | 0.46mi | 3/2.0 | 1,448 (+5%) | 1mo | $199,900 | $138 | 70 |
| 1309 Chestnut St | 0.52mi | 4/2.0 (+1) | 1,400 (+1%) | 0mo | $260,000 | $186 | 68 |
| 2209 Poplar St | 0.45mi | 4/1.0 (+1) | 1,328 (-4%) | 1mo | $145,000 | $109 | 63 |
| 1110 Amarillo St | 0.72mi | 3/1.0 | 1,368 (-1%) | 1mo | $119,900 | $88 | 60 |
| 1749 S 21 | 0.46mi | 2/2.0 (-1) | 1,269 (-8%) | 1mo | $219,500 | $173 | 59 |
| 2002 S 20th St | 0.43mi | 3/2.0 | 1,214 (-12%) | 2mo | $194,900 | $161 | 58 |
| 1134 Elm St | 0.60mi | 3/2.0 | 1,254 (-9%) | 2mo | $203,000 | $162 | 55 |
| 2050 Fulton St | 0.45mi | 3/1.0 | 1,224 (-11%) | 3mo | $200,000 | $163 | 53 |
| 1701 S 23rd St | 0.55mi | 3/2.0 | 1,188 (-14%) | 1mo | $189,000 | $159 | 50 |
Match score weights: distance 35% · size 25% · config 20% · recency 20%. Top-matched comps best support the ARV.
Projected returns pro-forma
-3.0% appreciation · 8.0% rent growth · sell at horizon
- IRR
- 22.3%
- Equity multiple
- 1.97×
- Total profit
- $43,517
- Equity at exit
- $23,842
- IRR
- 33.4%
- Equity multiple
- 4.83×
- Total profit
- $171,411
- Equity at exit
- $13,825
Cash invested: $44,772 (down + closing). Projections, not guarantees.
Landlord ↔ Tenant lean methodology
- Overall (STATE)
- 87 Strongly Landlord-Friendly
- State Texas
- 87 Strongly Landlord-Friendly · R+5
- County
- — inherits STATE
- City
- — inherits STATE
ZIP-level market 79602
- Home prices YoY
- -19.6%
- Rents YoY
- 33.5%
- Active inventory
- 370
- Price-to-rent
- 5.2×
Monthly cashflow live
- Estimated rent
- $2,549 high interval (Pro) →
- Mortgage (P&I)
- −$839
- Tax from tax record
- −$231 /mo · $2,767/yr
- Insurance
- −$67
- HOA
- −$0
- Vacancy / Maint / Mgmt
- −$535
- Net cashflow
- $878
Break-even live
UW: 25.0% down · 7.5% · 30yr · 1.5% tax · 5.0% vac · 8.0% maint · 8.0% mgmt
Financing live
Cash to close
- Down payment
- $39,975
- Closing costs
- $4,797
- Reserves months
- —
- Total cash needed
- —
Loan-product check · same deal, 3 products live
Conventional
25% down · 7.5% · 30yr
- Down + closing
- —
- Monthly P&I
- —
- Monthly cashflow
- —
- DSCR
- —
- Eligible?
- —
Personal DTI + credit; lowest rate.
DSCR
20% down · 8.5% · 30yr
- Down + closing
- —
- Monthly P&I
- —
- Monthly cashflow
- —
- DSCR
- —
- Eligible?
- —
No personal income docs; deal must DSCR.
Hard money
10% down · 12.0% · 12mo
- Down + closing
- —
- Monthly P&I
- —
- Monthly cashflow
- —
- DSCR
- —
- Eligible?
- —
Short-term bridge; refi at stabilization.
Rent comps 10 comps
| Address | Beds | Baths | Sqft | Rent | $/sqft | DOM | Units | Dist |
|---|---|---|---|---|---|---|---|---|
| 801 S 17th St Abilene, TX | 3.0 | 1.0 | 1200 | $1,800 | $1.50 | 13d | 1 | 0.45mi |
| 1349 Meander St Abilene, TX | 3.0 | 1.0 | 1532 | $3,800 | $2.48 | 13d | 1 | 0.46mi |
| 1934 Portland Ave Abilene, TX | 3.0 | 2.0 | 1108 | $1,900 | $1.71 | 44d | 1 | 0.83mi |
| 725 Peach St Abilene, TX | 3.0 | 2.0 | 1618 | $3,500 | $2.16 | 21d | 1 | 0.99mi |
| 619 Poplar St Abilene, TX | 2.0 | 1.0 | 884 | $1,695 | $1.92 | 13d | 1 | 1.05mi |
| 889 Ross Ave Abilene, TX | 2.0 | 1.0 | 1223 | $1,700 | $1.39 | 21d | 1 | 1.07mi |
| 2601 Edgemont Dr Abilene, TX | 2.0 | 2.0 | 1624 | $2,495 | $1.54 | 21d | 1 | 1.24mi |
| 1709 Bandolero Rd Abilene, TX | 3.0 | 2.0 | 1288 | $4,500 | $3.49 | 13d | 1 | 1.24mi |
| 3173 Hunt St Abilene, TX | 3.0 | 1.5 | 1300 | $2,250 | $1.73 | 44d | 1 | 1.27mi |
| 3250 College St Abilene, TX | 2.0 | 1.0 | 1148 | $1,595 | $1.39 | 21d | 1 | 1.38mi |
Listing history 19 events
-
2026-05-15status Pending
-
2026-04-28historical Active Option Contract
-
2026-04-23$159,900 Active
-
2026-04-10historical $1,895
-
2026-04-08$1,895
-
2026-04-07historical $1,895
-
2026-04-07$1,895
-
2024-02-14historical $1,295
-
2024-02-09$1,295
-
2023-08-31soldstatus
-
2023-08-30soldstatus Closed 477-char remark
Show marketing remark (477 chars)
Tons of value add potential in this investment! Perfect flip or add to your rental-Airbnb portfolio with close proximity to McMurry University and central to local amenities. This house would also make a great affordable family home for the first-time home buyer. 'Feels like home' comes to mind as you walk in and the only thing missing is your ideas and personal touch! You'll love the large master bedroom and enclosed back porch! Don't hesitate, inquire about this one now!
-
2023-08-20status Pending 477-char remark
Show marketing remark (477 chars)
Tons of value add potential in this investment! Perfect flip or add to your rental-Airbnb portfolio with close proximity to McMurry University and central to local amenities. This house would also make a great affordable family home for the first-time home buyer. 'Feels like home' comes to mind as you walk in and the only thing missing is your ideas and personal touch! You'll love the large master bedroom and enclosed back porch! Don't hesitate, inquire about this one now!
-
2023-08-01historical Active Option Contract 477-char remark
Show marketing remark (477 chars)
Tons of value add potential in this investment! Perfect flip or add to your rental-Airbnb portfolio with close proximity to McMurry University and central to local amenities. This house would also make a great affordable family home for the first-time home buyer. 'Feels like home' comes to mind as you walk in and the only thing missing is your ideas and personal touch! You'll love the large master bedroom and enclosed back porch! Don't hesitate, inquire about this one now!
-
2023-07-27$114,900 Active 477-char remark
Show marketing remark (477 chars)
Tons of value add potential in this investment! Perfect flip or add to your rental-Airbnb portfolio with close proximity to McMurry University and central to local amenities. This house would also make a great affordable family home for the first-time home buyer. 'Feels like home' comes to mind as you walk in and the only thing missing is your ideas and personal touch! You'll love the large master bedroom and enclosed back porch! Don't hesitate, inquire about this one now!
-
2010-04-14soldstatus
-
2010-04-12soldstatus 3-char remark
Show marketing remark (3 chars)
CBP
-
2010-03-18$76,000 3-char remark
Show marketing remark (3 chars)
CBP
-
2010-03-18historical 3-char remark
Show marketing remark (3 chars)
CBP
-
1992-09-16soldstatus
ⓘ Source: listings_history table (triggers on properties + properties_extension) + one-shot
backfill from property_details.listing_events for pre-trigger history.
Tax reassessment forecast TX · Resets to sale price
- Current annual tax
- $2,767 · $231/mo
- Projected year-2 tax
- $2,926 · $244/mo
- Expected delta
- +$159/yr (+$13/mo · 5.8%)
ⓘ Screening estimate from a state-policy table — verify with the county assessor before closing.
Climate risk First Street
- Flood 4/10 Moderate FEMA zone X (unshaded) · 20% chance over 30 yrs
- Wildfire 2/10 Low
- Heat 7/10 Severe 7 d/yr ≥103°F today · 24 d/yr by 30 yrs out
- Wind 4/10 Moderate 11% chance of damaging wind over 30 yrs
- Air quality 1/10 Low 0 unhealthy d/yr today · 0 by 30 yrs out
Nearby sold comps map
Loading sold comps map…
Walkable amenities ~0.75 mi
Loading nearby amenities…
Taxation est. · year 1
- Rental income
- $30,584
- − Mortgage interest
- −$8,957
- − Property taxes
- −$2,767
- − Insurance
- −$800
- − Repairs & maintenance
- −$2,447
- − Management
- −$2,447
- − Depreciation
- −$4,652
- Taxable income
- $8,515
- Est. tax owed @ 24.0%
- −$2,044
- After-tax cash flow
- $8,489/yr
For passive investors: Depreciation is non-cash, so a rental often shows a tax loss while cash-flowing — sheltering income. Rental losses are passive: they offset passive income freely, and up to $25,000/yr can offset ordinary (W-2) income if you actively participate and your MAGI is under $100k (phasing out to $0 by $150k); unused losses carry forward. On sale, claimed depreciation is recaptured at up to 25%, and gains may owe capital-gains tax (a 1031 exchange can defer both). Figures are a year-1 estimate at your 24.0% rate — not tax advice; consult a CPA.
Schools (NCES district)
- District
- Abilene ISD
- NCES district ID
- 4807440
- Math proficiency
- 32% ▼ -11.00%
- Reading proficiency
- 34% ▼ -5.00%
- Median HH income
- $39,782
- Composite
- 27.71/100
- National rank
- #6909
- State rank
- #575 of 826 in TX
Livability — Abilene
- Score
- 75/100
- State rank
- #142
- US rank
- #4037
Category grades
Schools grade is shown separately in the Schools card above.
Census & demographics
- Census place
- Abilene, TX
- County
- Taylor County · 136,672 people
- City population
- 136,672
- Metro
- Abilene, TX
- Population (ZIP)
- 27,425
- Household income
- $89,551
- Rent vs Own
- Severe rent burden
- 338.0
Population outlook (Taylor County) Hauer SSP2
- Today (2025)
- 145,270 people
- By 2030
- 150,050 · +3.3%
- By 2040
- 159,417 · +9.7%
- By 2050
- 168,883 · +16.3%
- By 2075
- 194,436 · +33.8%
- By 2100
- 203,163 · +39.9%
Race, ethnicity, and origin ACS 2023
- Neighborhood character
- Majority White (64%)
- Race & ethnicity
- White 64% Hispanic / Latino 22% Two or more races 12% Black 10% Asian 2%
- Hispanic origin (detail)
- Mexican 19%
- Common ancestry
- Romanian 2% Italian 2% Portuguese 2%
- Foreign-born
- 6% · Canada, Vietnam, Jamaica
- Languages at home
- 87% English-only · Spanish 9% Other Asian/Pacific 1% French/Haitian/Cajun 1%
Political lean MEDSL · Taylor
- 2024 margin
- Solid R (+49.8) · D 24.6% · R 74.4% · Other 1.0%
- 2008→2024 swing
- -4.2pp toward R · 2008: -45.6pp · 2024: -49.8pp
- All cycles
- 2024: R+49.8 2020: R+45.3 2016: R+51.1 2012: R+53.6 2008: R+45.6
Not yet ingested
- Civics
- —
Market trends
- HPI YoY
- ▼ -46.04%
- Current HPI
- 189.3098
- Rent YoY
- ▲ 33.46%
- Metro
- Abilene, TX
- State GDP YoY
- ▲ 3.95%
- F500 in state
- 110
Industry mix (Fortune 500 HQ in TX)
| Industry | F500 HQs | Revenue |
|---|---|---|
| Energy | 16 | $1,198B |
|
||
| Technology | 5 | $198B |
|
||
| Engineering / Construction | 4 | $72B |
|
||
| Energy Services | 3 | $60B |
|
||
| Utilities | 3 | $41B |
|
||
| Healthcare | 2 | $330B |
|
||
Price history
+110.4% since first listed19 events — show timeline
- 2026-05-15 Pending — NTREIS
- 2026-04-28 Contingent — NTREIS
- 2026-04-23 Listed $159,900 NTREIS
- 2026-04-10 Rental Removed $1,895 APPFOLIO
- 2026-04-08 Listed for Rent $1,895 APPFOLIO
- 2026-04-07 Rental Removed $1,895 NTREIS
- 2026-04-07 Listed for Rent $1,895 NTREIS
- 2024-02-14 Rental Removed $1,295 NTREIS
- 2024-02-09 Listed for Rent $1,295 NTREIS
- 2023-08-31 Sold (Public Records) — Public Records
- 2023-08-30 Sold (MLS) — NTREIS
- 2023-08-20 Pending — NTREIS
- 2023-08-01 Contingent — NTREIS
- 2023-07-27 Listed $114,900 NTREIS
- 2010-04-14 Sold (Public Records) — Public Records
- 2010-04-12 Sold (MLS) — NTREIS
- 2010-03-18 Listing Removed — NTREIS
- 2010-03-18 Listed $76,000 NTREIS
- 1992-09-16 Sold (Public Records) — Public Records
Property tax history
+3.2%/yrLatest (2025): $2,767 · +5.2% YoY. Source: county tax records.
Cash-flow waterfall
monthlySold comps — $/sqft
last 12 mo · ≤1 miLoading sold comps…