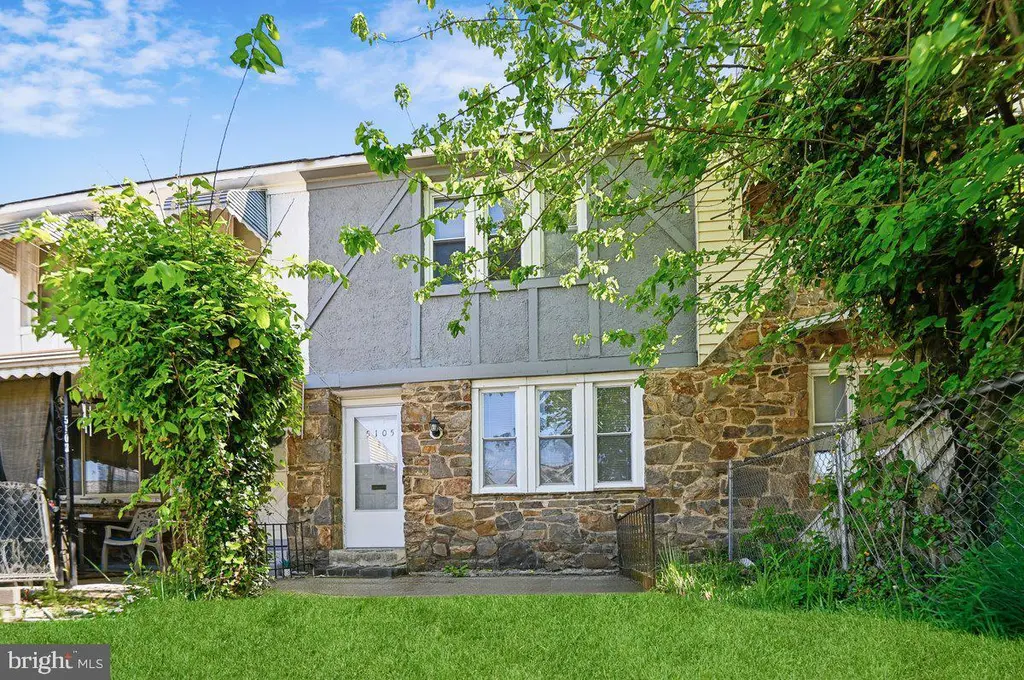
5105 Chalgrove Ave · Baltimore, MD
Flood risk 1/10 · Minimal
- FEMA flood zone
- X (unshaded)
- Chance of flooding over 30 yrs
- 0.0%
- Est. flood insurance / yr
- $473 – $860
Fire risk 1/10 · Minimal
- Est. fire insurance / yr
- $755 – $1,403
Heat risk 7/10 · Major
- Hot days now (above 104°F)
- 7 days/yr
- Hot days in 30 yrs
- 15 days/yr
Wind risk 6/10 · Moderate
- Chance of severe wind over 30 yrs
- 27.0%
Air-quality risk 3/10 · Minor
- Unhealthy air days now
- 2 days/yr
- Unhealthy air days in 30 yrs
- 4 days/yr
Risk factors via First Street. Map © Google.
Why this score? — see what drove the C grade
The composite is a weighted blend of 9 inputs, each scored 0–100. Each bar is that input's sub-score; the figure is the points it added to the 100-point composite (weight × sub-score).
- Cash flow +30.0/30.0
- DSCR +10.0/10.0
- 1% rule +7.8/10.0
- Livability +3.8/5.0
- Rent growth +3.1/5.0
- Condition / age +2.5/5.0
- Schools +1.0/10.0
- ARV discount +0.0/15.0
- Appreciation +0.0/10.0
$139,000
🖨 Deal sheet 📄 Offer letter ✓ Due diligence
Listing remarks MLS
New Price Reduction! Welcome Home! This property is great for first time home buyers or investors looking to add your rental portfolio or start your new rental portfolio. Enjoy this spacious 3 bedroom 1 bath. It has been freshly painted throughout the whole house, new luxury vinyl flooring throughout including the basement and new carpet on the stairs. The kitchen features new cabinets, countertops, stainless steel appliances and a breakfast nook that overlooks the dining area where you can add additional seating. It has a nice size basement for entertainment and lounging or design it to make it your own oasis. Large back yard that can be used for rear parking. Close to Sinai Hospital and Pimlico Racetrack, easy access to I-695 and I-83. This is a 1031 exchange sale. Agents bring your clients! Owners will entertain all reasonable offers.
Key facts
- Built 1937
- Listed 67 days
Neighborhood map
What this means for you Summary
Snapshot
- This is a 3-bed/1.0-bath townhouse listed at $139k.
Deal economics
- At list price, monthly cash flow is $526 ($6k/yr) — positive.
- The deal already cash-flows at list — no discount required.
- Meets the 1% rule at list price ($2k rent vs $139k).
- Recommended offer: $131k (6.0% below list) — sets the bar for market timing.
- Cap rate 10.8% vs local median 6.0% in Baltimore — top-decile yield for the area; either an underpriced asset or a hidden risk that comps aren't pricing in. Stress-test before assuming the spread holds.
Location & tenants
- Location reads 76/100 on livability (#90 in MD, #3,396 nationally) — a middle-class / working-renter tenant base. Strengths: amenities A+, commute A+, housing A+; Watch: schools D, crime F.
- Baltimore City Public Schools (urban): math 7% / reading 16% proficiency, ranked #24 of 24 in MD (top 100%) — low school quality limits family demand, transient renter base, plan for 1-2y turnover; 79% free/reduced lunch — lower-income household profile, screen leases tightly.
- Market conditions: Rents rising (+2.4%/yr); 351 active listings in the ZIP; 27 comparable units currently listed for rent nearby; rentals at typical pace (median 24d on market — plan ~3-4 weeks tenant-placement turnaround); 41% of comp listings sitting > 30 days — soft ceiling on asking rent; 1,273 units permitted in Baltimore city in 2024 (1,104 in 5+ unit buildings).
- This rent runs 42% of the median local income ($52k/yr) — at the standard rent-burdened threshold; future hikes will face affordability resistance.
Forward outlook
- Local home prices are declining (-3.0%/yr); year-one equity from $961 of loan paydown is wiped out by about $4k of value loss. Plan a longer hold.
- Baltimore County population projected to shrink 4% by 2050 — rents likely to lag national; underwrite the cash flow, not the appreciation.
- At projected returns (-3.0% appreciation + 2.4% rent growth), your $39k cash investment doubles in ~8 years — after that, you're playing with house money.
Negotiation context
- It's been on market 67 days — a 6% lower offer ($131k) is reasonable based on typical stale-listing flexibility.
- 4 sale attempts since 22y ago; this cycle's ask has dropped $31k (18%) from the opening price — seller is motivated, your offer sets the floor, not the list.
- Current owner paid $75k; list at $139k implies a 85% gain — meaningful room to come down on a strong offer.
Risks & watch-outs
- Watch-outs: built in 1937 — expect roof / HVAC / electrical / plumbing capex.
- Climate carrying-cost: major wind risk, 27% chance of damaging wind over 30y; extreme-heat days projected 7→15/yr by 2055 (HVAC capex compounding) — expect insurance premiums to compound above CPI over the hold.
Questions for the listing agent
- It's been on market 67 days. Have you received any prior offers? Is the seller open to a 6% concession, seller financing, or rate buy-down credit?
- Built in 1937 — when were the roof, HVAC, electrical panel, plumbing, and water heater last replaced?
- Why hasn't it sold? Are there any deal-killer items the seller is aware of (foundation, flood, title, zoning, code violations)?
- Is there a deadline driving the sale (1031 exchange, divorce, estate, relocation)? That informs how much negotiation room exists.
- Schools are D-rated, which usually means shorter tenancies and higher turnover. Who's the typical renter profile here, and what's been the actual vacancy rate?
- Crime grade is F in this area — have there been break-ins, vandalism, or insurance claims at this property in the last 3 years? What carrier currently insures it and at what premium?
- What's the average days-on-market for RENTAL listings here right now (not sales)? A rising rental-DOM trend means longer vacancies and softer asking-rent achievability than the comps imply.
- What's the recent tenant-quality profile in this submarket — average credit score on applications, eviction rate, late-payment / NSF rate, and stable-employment percentage? A property-management company in the area should have these aggregated.
- How much new for-sale + rental construction is in the pipeline within 1–3 miles? Heavy new supply typically softens prices + rents 12–24 months out; constrained supply supports both.
Investment metrics
- 1% rule
- 1.28% ✓
- Cap rate
- 10.83%
- Cash-on-cash
- 16.22%
- DSCR
- 1.72
- GRM
- 6.5
CMA / ARV
- ARV (median comp)
- $103,288
- List price
- $139,000
- Delta
- 34.57%
- Verdict
- OVERPRICED
- Comps
- 20 within 1.0 mi
Show comp detail 12 sales within ~0.75 mi
| Address | Dist | Beds/Ba | Sqft | Sold | Price | $/sf | Match |
|---|---|---|---|---|---|---|---|
| 3015 Spaulding Ave | 0.10mi | 3/1.5 | 1,300 (+3%) | 5mo | $80,000 | $62 | 84 |
| 5010 Chalgrove Ave | 0.08mi | 2/1.0 (-1) | 1,190 (-6%) | 5mo | $72,500 | $61 | 78 |
| 4911 Queensberry Ave | 0.14mi | 4/1.5 (+1) | 1,390 (+10%) | 2mo | $155,000 | $112 | 67 |
| 4912 Palmer Ave | 0.23mi | 3/2.0 | 1,400 (+11%) | 1mo | $60,000 | $43 | 66 |
| 3026 Virginia Ave | 0.40mi | 3/1.0 | 1,442 (+14%) | 3mo | $75,000 | $52 | 54 |
| 2361 Sundew Ter #2361 | 0.72mi | 3/2.5 | 1,298 (+3%) | 3mo | $181,000 | $139 | 52 |
| 2904 Virginia Ave | 0.53mi | 3/1.5 | 1,116 (-11%) | 2mo | $202,000 | $181 | 52 |
| 4927 Edgemere Ave | 0.41mi | 2/1.0 (-1) | 1,080 (-14%) | 3mo | $95,000 | $88 | 50 |
| 5118 Nelson Ave | 0.70mi | 3/2.0 | 1,386 (+10%) | 3mo | $219,000 | $158 | 44 |
| 5329 Cordelia Ave | 0.70mi | 3/1.0 | 1,080 (-14%) | 1mo | $105,000 | $97 | 42 |
| 3824 Beehler Ave | 0.74mi | 3/1.5 | 1,080 (-14%) | 3mo | $88,000 | $81 | 37 |
| 3716 Beehler Ave | 0.61mi | 4/4.0 (+1) | 1,445 (+15%) | 3mo | $265,000 | $183 | 28 |
Match score weights: distance 35% · size 25% · config 20% · recency 20%. Top-matched comps best support the ARV.
Projected returns pro-forma
-3.0% appreciation · 2.41% rent growth · sell at horizon
- IRR
- 6.6%
- Equity multiple
- 1.25×
- Total profit
- $9,906
- Equity at exit
- $20,725
- IRR
- 15.4%
- Equity multiple
- 2.22×
- Total profit
- $47,414
- Equity at exit
- $12,018
Cash invested: $38,920 (down + closing). Projections, not guarantees.
Landlord ↔ Tenant lean methodology
- Overall (CITY)
- 12 Strongly Tenant-Friendly
- State Maryland
- 27 Tenant-Leaning · D+14
- County
- — inherits STATE
- City Baltimore
- 12 Strongly Tenant-Friendly · D+58
ZIP-level market 21215
- Rents YoY
- 2.4%
- Active inventory
- 351
- Price-to-rent
- 6.5×
Monthly cashflow live
- Estimated rent
- $1,785 high interval (Pro) →
- Mortgage (P&I)
- −$729
- Tax from tax record
- −$97 /mo · $1,167/yr
- Insurance
- −$58
- HOA
- −$0
- Vacancy / Maint / Mgmt
- −$375
- Net cashflow
- $526
Break-even live
UW: 25.0% down · 7.5% · 30yr · 1.5% tax · 5.0% vac · 8.0% maint · 8.0% mgmt
Financing live
Cash to close
- Down payment
- $34,750
- Closing costs
- $4,170
- Reserves months
- —
- Total cash needed
- —
Loan-product check · same deal, 3 products live
Conventional
25% down · 7.5% · 30yr
- Down + closing
- —
- Monthly P&I
- —
- Monthly cashflow
- —
- DSCR
- —
- Eligible?
- —
Personal DTI + credit; lowest rate.
DSCR
20% down · 8.5% · 30yr
- Down + closing
- —
- Monthly P&I
- —
- Monthly cashflow
- —
- DSCR
- —
- Eligible?
- —
No personal income docs; deal must DSCR.
Hard money
10% down · 12.0% · 12mo
- Down + closing
- —
- Monthly P&I
- —
- Monthly cashflow
- —
- DSCR
- —
- Eligible?
- —
Short-term bridge; refi at stabilization.
Rent comps 27 comps
| Address | Beds | Baths | Sqft | Rent | $/sqft | DOM | Units | Dist |
|---|---|---|---|---|---|---|---|---|
| 5115 Pembridge Ave Baltimore, MD | 3.0 | 2.0 | 1088 | $2,150 | $1.98 | 43d | 1 | 0.03mi |
| 5301 Maple Ave Baltimore, MD | 3.0 | 1.0 | 960 | $1,700 | $1.77 | 43d | 1 | 0.34mi |
| 5340 Maple Ave Baltimore, MD | 2.0 | 1.0 | 1200 | $1,950 | $1.62 | 43d | 1 | 0.40mi |
| 4828 Beaufort Ave Baltimore, MD | 2.0 | 2.5 | 1200 | $1,850 | $1.54 | 23d | 1 | 0.56mi |
| 5000 Litchfield Ave #1 Baltimore, MD | 2.0 | 1.0 | 1100 | $1,100 | $1.00 | 43d | 1 | 0.60mi |
| 2432 Everton Rd Unit 2435 A Baltimore, MD | 2.0 | 1.5 | 1000 | $1,500 | $1.50 | 23d | 1 | 0.61mi |
| 3735 Manchester Ave Baltimore, MD | 2.0 | 1.0 | 1000 | $1,350 | $1.35 | 4d | 1 | 0.66mi |
| 4714 Greenspring Ave Baltimore, MD | 2.0 | 1.0 | 890 | $1,295 | $1.46 | 43d | 1 | 0.70mi |
| 2824 Edgecombe Cir S Baltimore, MD | 2.0 | 2.0 | 950 | $1,475 | $1.55 | 21d | 1 | 0.75mi |
| 5343 Nelson Ave Baltimore, MD | 2.0 | 1.0 | 1000 | $1,215 | $1.22 | 23d | 1 | 0.78mi |
| 2915 Oakford Ave Baltimore, MD | 3.0 | 2.0 | 1102 | $1,600 | $1.45 | 17d | 1 | 0.78mi |
| 2310 Sulgrave Ave Unit 3 Baltimore, MD | 2.0 | 1.0 | 978 | $1,700 | $1.74 | 43d | 1 | 0.79mi |
| 2454 W Cold Spring Ln Baltimore, MD | 3.0 | 1.0 | 1200 | $1,650 | $1.38 | 23d | 1 | 0.88mi |
| 3784 Columbus Dr Baltimore, MD | 4.0 | 2.0 | 1250 | $2,200 | $1.76 | 23d | 1 | 0.89mi |
| 2530 Edgecombe Cir N Baltimore, MD | 2.0–3.0 | 1.0 | 920 | $1,325 | $1.44 | 2d | 4 | 0.91mi |
| 2619 Loyola Northway Baltimore, MD | 3.0 | 2.0 | 1400 | $1,995 | $1.43 | 23d | 1 | 0.94mi |
| 5801 Western Run Dr Baltimore, MD | 3.0 | 1.0–2.0 | 835 | $1,979 | $2.37 | 2d | 7 | 0.98mi |
| 4230 Towanda Ave Baltimore, MD | 3.0 | 2.0 | 1400 | $1,800 | $1.29 | 17d | 1 | 1.02mi |
| 3912 Mortimer Ave Baltimore, MD | 3.0 | 2.0 | 1204 | $2,723 | $2.26 | 43d | 1 | 1.05mi |
| 2415 Loyola Southway Baltimore, MD | 3.0 | 1.5 | 1200 | $2,033 | $1.69 | 43d | 1 | 1.12mi |
| 2900 Taney Rd Apt 1A Baltimore, MD | 2.0 | 2.0 | 1200 | $1,600 | $1.33 | 23d | 1 | 1.15mi |
| 4010 Fernhill Ave Unit 2 Baltimore, MD | 2.0 | 1.0 | 1100 | $1,500 | $1.36 | 43d | 1 | 1.22mi |
| 2001 W Cold Spring Ln Baltimore, MD | 1.0–3.0 | 1.0–2.0 | 1154 | $3,505 | $3.04 | 1d | 31 | 1.24mi |
| 3822 Pall Mall Rd Baltimore, MD | 3.0 | 1.5 | 1320 | $1,875 | $1.42 | 43d | 1 | 1.36mi |
| 103 Cross Keys Rd Unit R103D2 Baltimore, MD | 2.0 | 2.0 | 1157 | $2,000 | $1.73 | 23d | 1 | 1.42mi |
| 6317 Pearce Ave Baltimore, MD | 2.0 | 2.0 | 1140 | $1,600 | $1.40 | 43d | 1 | 1.43mi |
| 6310 Greenspring Ave Baltimore, MD | 2.0–3.0 | 1.5–2.0 | 1080 | $1,940 | $1.80 | 2d | 6 | 1.46mi |
Listing history 27 events
-
2026-06-18days on market $139,000 Active 67 DOM
-
2026-06-17days on market $139,000 Active 66 DOM
-
2026-06-16days on market $139,000 Active 65 DOM
-
2026-06-15days on market $139,000 Active 64 DOM
-
2026-06-13days on market $139,000 Active 62 DOM
-
2026-06-09days on market $139,000 Active 58 DOM
-
2026-06-08days on market $139,000 Active 57 DOM
-
2026-06-07days on market $139,000 Active 56 DOM
-
2026-06-04days on market $139,000 Active 53 DOM
-
2026-06-03days on market $139,000 Active 52 DOM
-
2026-06-02days on market $139,000 Active 51 DOM
-
2026-06-02price $139,000 Active 50 DOM
-
2026-06-01days on market $149,000 Active 50 DOM
-
2026-05-31days on market $149,000 Active 49 DOM
-
2026-05-13price $149,000 850-char remark
Show marketing remark (850 chars)
New Price Reduction! Welcome Home! This property is great for first time home buyers or investors looking to add your rental portfolio or start your new rental portfolio. Enjoy this spacious 3 bedroom 1 bath. It has been freshly painted throughout the whole house, new luxury vinyl flooring throughout including the basement and new carpet on the stairs. The kitchen features new cabinets, countertops, stainless steel appliances and a breakfast nook that overlooks the dining area where you can add additional seating. It has a nice size basement for entertainment and lounging or design it to make it your own oasis. Large back yard that can be used for rear parking. Close to Sinai Hospital and Pimlico Racetrack, easy access to I-695 and I-83. This is a 1031 exchange sale. Agents bring your clients! Owners will entertain all reasonable offers.
-
2026-04-12$169,999 Active 850-char remark
Show marketing remark (850 chars)
New Price Reduction! Welcome Home! This property is great for first time home buyers or investors looking to add your rental portfolio or start your new rental portfolio. Enjoy this spacious 3 bedroom 1 bath. It has been freshly painted throughout the whole house, new luxury vinyl flooring throughout including the basement and new carpet on the stairs. The kitchen features new cabinets, countertops, stainless steel appliances and a breakfast nook that overlooks the dining area where you can add additional seating. It has a nice size basement for entertainment and lounging or design it to make it your own oasis. Large back yard that can be used for rear parking. Close to Sinai Hospital and Pimlico Racetrack, easy access to I-695 and I-83. This is a 1031 exchange sale. Agents bring your clients! Owners will entertain all reasonable offers.
-
2021-09-20soldstatus $75,000
-
2021-06-24soldstatus $75,000 Closed 369-char remark
Show marketing remark (369 chars)
Perfect home to build your rental portfolio located near Pimlico Race Track. Wall-to-wall carpet thorough out this spacious house with ample amount of space. The kitchen features a breakfast nook that overlooks the dining and adds additional seating if needed. Large back yard that can be used for rear parking. Currently rented for $925. Photos before tenant occupancy
-
2021-06-04status Pending 369-char remark
Show marketing remark (369 chars)
Perfect home to build your rental portfolio located near Pimlico Race Track. Wall-to-wall carpet thorough out this spacious house with ample amount of space. The kitchen features a breakfast nook that overlooks the dining and adds additional seating if needed. Large back yard that can be used for rear parking. Currently rented for $925. Photos before tenant occupancy
-
2021-05-15$80,000 Active 369-char remark
Show marketing remark (369 chars)
Perfect home to build your rental portfolio located near Pimlico Race Track. Wall-to-wall carpet thorough out this spacious house with ample amount of space. The kitchen features a breakfast nook that overlooks the dining and adds additional seating if needed. Large back yard that can be used for rear parking. Currently rented for $925. Photos before tenant occupancy
-
2006-05-17soldstatus $69,000
-
2005-12-21historical
-
2005-10-04
-
2005-02-28soldstatus $37,800
-
2005-02-16historical
-
2004-12-03$44,000
-
1985-01-23soldstatus $29,500
ⓘ Source: listings_history table (triggers on properties + properties_extension) + one-shot
backfill from property_details.listing_events for pre-trigger history.
Tax reassessment forecast MD · Partial reset (capped growth)
- Current annual tax
- $1,167 · $97/mo
- Projected year-2 tax
- $1,341 · $112/mo
- Expected delta
- +$174/yr (+$14/mo · 14.9%)
ⓘ Screening estimate from a state-policy table — verify with the county assessor before closing.
Climate risk First Street
- Flood 1/10 Low FEMA zone X (unshaded) · 0% chance over 30 yrs
- Wildfire 1/10 Low
- Heat 7/10 Severe 7 d/yr ≥104°F today · 15 d/yr by 30 yrs out
- Wind 6/10 Major 27% chance of damaging wind over 30 yrs
- Air quality 3/10 Moderate 2 unhealthy d/yr today · 4 by 30 yrs out
Nearby sold comps map
Loading sold comps map…
Walkable amenities ~0.75 mi
Loading nearby amenities…
Taxation est. · year 1
- Rental income
- $21,420
- − Mortgage interest
- −$7,786
- − Property taxes
- −$1,167
- − Insurance
- −$695
- − Repairs & maintenance
- −$1,714
- − Management
- −$1,714
- − Depreciation
- −$4,044
- Taxable income
- $4,301
- Est. tax owed @ 24.0%
- −$1,032
- After-tax cash flow
- $5,280/yr
For passive investors: Depreciation is non-cash, so a rental often shows a tax loss while cash-flowing — sheltering income. Rental losses are passive: they offset passive income freely, and up to $25,000/yr can offset ordinary (W-2) income if you actively participate and your MAGI is under $100k (phasing out to $0 by $150k); unused losses carry forward. On sale, claimed depreciation is recaptured at up to 25%, and gains may owe capital-gains tax (a 1031 exchange can defer both). Figures are a year-1 estimate at your 24.0% rate — not tax advice; consult a CPA.
Schools (NCES district)
- District
- Baltimore City Public Schools
- NCES district ID
- 2400090
- Math proficiency
- 7% ▼ -9.00%
- Reading proficiency
- 16% ▼ -5.00%
- Median HH income
- $42,108
- Composite
- 10.08/100
- National rank
- #9805
- State rank
- #24 of 24 in MD
Livability — Baltimore
- Score
- 76/100
- State rank
- #90
- US rank
- #3396
Category grades
Schools grade is shown separately in the Schools card above.
Census & demographics
- Census place
- Baltimore, MD
- County
- Baltimore City · 558,601 people
- City population
- 588,727
- Metro
- Baltimore-Columbia-Towson, MD
- Population (ZIP)
- 52,229
- Household income
- $51,587
- Rent vs Own
- Severe rent burden
- 3644.0
Population outlook (Baltimore County) Hauer SSP2
- Today (2025)
- 624,249 people
- By 2030
- 621,541 · -0.4%
- By 2040
- 609,756 · -2.3%
- By 2050
- 597,249 · -4.3%
- By 2075
- 552,236 · -11.5%
- By 2100
- 513,934 · -17.7%
Race, ethnicity, and origin ACS 2023
- Neighborhood character
- Predominantly Black (73%)
- Race & ethnicity
- Black 73% White 17% Hispanic / Latino 5% Two or more races 4% Asian 1%
- Common ancestry
- Scotch-Irish 2% Romanian 2% Italian 1%
- Foreign-born
- 9% · Canada, South Korea
- Languages at home
- 91% English-only · Spanish 4% French/Haitian/Cajun 1% Other Indo-European 1%
Political lean MEDSL · Baltimore
- 2024 margin
- Solid D (+73.0) · D 85.2% · R 12.2% · Other 2.6%
- 2008→2024 swing
- -2.5pp toward R · 2008: 75.5pp · 2024: 73.0pp
- All cycles
- 2024: D+73.0 2020: D+76.6 2016: D+74.6 2012: D+76.4 2008: D+75.5
Not yet ingested
- Civics
- —
Market trends
- HPI YoY
- ▼ -318.58%
- Current HPI
- 291.4926
- Rent YoY
- ▲ 2.41%
- Metro
- Baltimore-Columbia-Towson, MD
- State GDP YoY
- ▲ 2.97%
- F500 in state
- 12
Industry mix (Fortune 500 HQ in MD)
| Industry | F500 HQs | Revenue |
|---|---|---|
| Aerospace / Defense | 1 | $71B |
|
||
| Utilities | 1 | $25B |
|
||
| Hotels | 1 | $24B |
|
||
| Consumer Goods | 1 | $7B |
|
||
| Real Estate | 1 | $6B |
|
||
| Chemicals | 1 | $2B |
|
||
Price history
+405.1% since first listed13 events — show timeline
- 2026-05-13 Price Changed $149,000 BRIGHT MLS
- 2026-04-12 Listed $169,999 BRIGHT MLS
- 2021-09-20 Sold (Public Records) $75,000 Public Records
- 2021-06-24 Sold (MLS) $75,000 BRIGHT MLS
- 2021-06-04 Pending — BRIGHT MLS
- 2021-05-15 Listed $80,000 BRIGHT MLS
- 2006-05-17 Sold (Public Records) $69,000 Public Records
- 2005-12-21 Delisted — MRIS
- 2005-10-04 Listed — MRIS
- 2005-02-28 Sold (MLS) $37,800 MRIS
- 2005-02-16 Delisted — MRIS
- 2004-12-03 Listed $44,000 MRIS
- 1985-01-23 Sold (Public Records) $29,500 Public Records
Property tax history
-2.4%/yrLatest (2025): $1,167 · +18.3% YoY. Source: county tax records.
Cash-flow waterfall
monthlySold comps — $/sqft
last 12 mo · ≤1 miLoading sold comps…