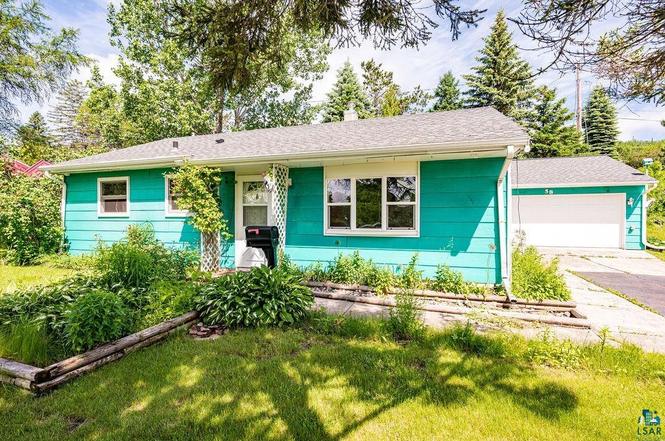
58 Banks Blvd · Silver Bay, MN
Flood risk 1/10 · Minimal
- FEMA flood zone
- —
- Chance of flooding over 30 yrs
- 0.0%
- Est. flood insurance / yr
- —
Fire risk 5/10 · Moderate
- Est. fire insurance / yr
- $888 – $1,650
Heat risk 1/10 · Minimal
- Hot days now (above 86°F)
- 7 days/yr
- Hot days in 30 yrs
- 14 days/yr
Wind risk 1/10 · Minimal
- Chance of severe wind over 30 yrs
- —
Air-quality risk 1/10 · Minimal
- Unhealthy air days now
- 0 days/yr
- Unhealthy air days in 30 yrs
- 0 days/yr
Risk factors via First Street. Map © Google.
Why this score? — see what drove the D grade
The composite is a weighted blend of 9 inputs, each scored 0–100. Each bar is that input's sub-score; the figure is the points it added to the 100-point composite (weight × sub-score).
- Appreciation +10.0/10.0
- Cash flow +7.8/30.0
- ARV discount +6.0/15.0
- Schools +3.8/10.0
- Livability +3.7/5.0
- Rent growth +2.5/5.0
- Condition / age +2.5/5.0
- 1% rule +2.1/10.0
- DSCR +1.9/10.0
$149,900
🖨 Deal sheet 📄 Offer letter ✓ Due diligence
Listing remarks
Charming, one level, 3 bedroom one level home in Silver Bay with views of Lake Superior and the surrounding hills! Walk in and be right at home! With vinyl frame windows, walk in shower, new roof in 2013, newer carpeting, 2 car garage, storage shed, everything you need is right here. ..
Key facts
- Vinyl frame windows
- Storage shed
- Walk in shower
Tags
Property features AI
Exterior
- Parking: Detached garage; 2 garage spaces; Off-street concrete parking
- Utilities: Public water; Public sewer
- Home design: Single-family detached residence; One story
- Construction: Asphalt shingle roof; Slab foundation; Built area above grade: 864
- Exterior features: Outdoor lighting; Shed on property; City street frontage; Paved, public-maintained road
Interior
- Kitchen: Dishwasher; Range; Refrigerator
- Bathrooms: One three-quarter bathroom
- Heating & cooling: Forced air heating (natural gas); Wall-mounted cooling unit
- Interior features: High-speed internet available; Primary bedroom on main level
- Laundry & utility: Washer; Dryer; Laundry on main level
Neighborhood map
What this means for you Summary
Snapshot
- This is a 3-bed/1.0-bath single-family listed at $150k.
Deal economics
- At list price, monthly cash flow is $-167 ($-2k/yr) — negative.
- To cash-flow at today's rent, offer at most $120k (19.7% below list).
- To meet the 1% rule (rent ≥ 1% of price), the offer needs to be $106k (29.4% below list).
- Recommended offer: $106k (29.4% below list) — sets the bar for 1% rule.
Location & tenants
- Location reads 74/100 on livability (#217 in MN, #4,547 nationally) — a middle-class / working-renter tenant base. Strengths: cost of living A+, housing A+, health & safety A+; Watch: amenities F, commute F.
- Lake Superior Public School District (rural): math 34% / reading 53% proficiency, ranked #191 of 301 in MN (top 64%) — families likely to look elsewhere, expect single-tenant / working-renter base with shorter leases.
- Market conditions: 66 active listings in the ZIP; 81 units permitted in Lake County in 2024 (0 in 5+ unit buildings).
Forward outlook
- In year one you build about $16k of equity ($1k loan paydown + $15k appreciation (10.0% local appreciation)).
- Lake County population projected at -26% by 2050 — secular population decline; favor cash flow + early exit over multi-decade hold.
- By year 3, paydown + projected appreciation supports a ~$41k cash-out refi (75% LTV) — recoverable capital for the next deal without selling this one.
Negotiation context
- Only 7 days on market — expect competitive offers; lowballing is unlikely to land.
- 3 sale attempts since 4y ago with the ask held roughly flat each time — persistent listings suggest the price (not the market) is what's stuck; bring a comps-based counter.
- Current owner paid $129k; 16% above their basis — modest negotiation headroom, anchor on the comps not their cost.
Risks & watch-outs
- Watch-outs: built in 1953 — expect roof / HVAC / electrical / plumbing capex.
- Climate carrying-cost: moderate wildfire risk — expect insurance premiums to compound above CPI over the hold.
Questions for the listing agent
- What do current leases actually rent for vs. the listed asking? Can we see a recent rent roll and the last 12 months of T-12 income?
- Built in 1953 — when were the roof, HVAC, electrical panel, plumbing, and water heater last replaced?
- Is there a deadline driving the sale (1031 exchange, divorce, estate, relocation)? That informs how much negotiation room exists.
- Schools are B-rated — typically a magnet for longer-tenancy family renters. What's the average tenant stay here, and is there a school-zone premium baked into asking?
- The area grade is low — what's the realistic commute time and amenity access for the typical tenant pool here? Any planned neighborhood developments (good or bad) we should know about?
- What's the average days-on-market for RENTAL listings here right now (not sales)? A rising rental-DOM trend means longer vacancies and softer asking-rent achievability than the comps imply.
- What's the recent tenant-quality profile in this submarket — average credit score on applications, eviction rate, late-payment / NSF rate, and stable-employment percentage? A property-management company in the area should have these aggregated.
- How much new for-sale + rental construction is in the pipeline within 1–3 miles? Heavy new supply typically softens prices + rents 12–24 months out; constrained supply supports both.
Investment metrics
- 1% rule
- 0.71% ✗
- Cap rate
- 4.95%
- Cash-on-cash
- -4.78%
- DSCR
- 0.79
- GRM
- 11.8
CMA / ARV
- ARV (on-the-fly)
- $145,152
- Comps found
- 12
Show comp detail 12 sales within ~0.75 mi
| Address | Dist | Beds/Ba | Sqft | Sold | Price | $/sf | Match |
|---|---|---|---|---|---|---|---|
| 88 Banks Blvd | 0.28mi | 3/1.0 | 864 (0%) | 0mo | $105,000 | $122 | 86 |
| 33 Charles Crk | 0.14mi | 3/1.0 | 864 (0%) | 14mo | $145,000 | $168 | 82 |
| 51 Davis Dr | 0.39mi | 3/1.0 | 864 (0%) | 3mo | $107,500 | $124 | 80 |
| 31 Charles Cr Cir | 0.12mi | 2/1.0 (-1) | 864 (0%) | 18mo | $145,000 | $168 | 74 |
| 36 Aiken Cr Cir | 0.43mi | 2/1.0 (-1) | 864 (0%) | 2mo | $130,000 | $150 | 73 |
| 42 Banks Blvd | 0.13mi | 3/1.0 | 900 (+4%) | 20mo | $163,900 | $182 | 70 |
| 66 Banks Blvd | 0.08mi | 2/1.0 (-1) | 768 (-11%) | 4mo | $117,000 | $152 | 70 |
| 12 Dodge Ln | 0.29mi | 2/1.0 (-1) | 864 (0%) | 18mo | $141,000 | $163 | 66 |
| 11 Aiken Crk | 0.34mi | 3/1.0 | 932 (+8%) | 6mo | $124,000 | $133 | 66 |
| 10 Drake Cr Cir | 0.28mi | 2/1.0 (-1) | 864 (0%) | 23mo | $150,000 | $174 | 63 |
| 36 Adams Blvd | 0.46mi | 2/1.0 (-1) | 768 (-11%) | 13mo | $170,000 | $221 | 44 |
| 30 Arthur Crk | 0.58mi | 3/1.0 | 960 (+11%) | 19mo | $170,000 | $177 | 39 |
Match score weights: distance 35% · size 25% · config 20% · recency 20%. Top-matched comps best support the ARV.
Projected returns pro-forma
10.0% appreciation · 3.0% rent growth · sell at horizon
- IRR
- 20.9%
- Equity multiple
- 2.69×
- Total profit
- $70,977
- Equity at exit
- $135,042
- IRR
- 18.9%
- Equity multiple
- 6.18×
- Total profit
- $217,389
- Equity at exit
- $291,223
Cash invested: $41,972 (down + closing). Projections, not guarantees.
Landlord ↔ Tenant lean methodology
- Overall (STATE)
- 46 Balanced
- State Minnesota
- 46 Balanced · D+2
- County
- — inherits STATE
- City
- — inherits STATE
ZIP-level market 55614
- Home prices YoY
- 11.9%
- Active inventory
- 66
- Price-to-rent
- 11.8×
Monthly cashflow live
- Estimated rent
- $1,058 medium interval (Pro) →
- Mortgage (P&I)
- −$786
- Tax from tax record
- −$154 /mo · $1,852/yr
- Insurance
- −$62
- HOA
- −$0
- Vacancy / Maint / Mgmt
- −$222
- Net cashflow
- $-167
Break-even live
UW: 25.0% down · 7.5% · 30yr · 1.5% tax · 5.0% vac · 8.0% maint · 8.0% mgmt
Financing live
Cash to close
- Down payment
- $37,475
- Closing costs
- $4,497
- Reserves months
- —
- Total cash needed
- —
Loan-product check · same deal, 3 products live
Conventional
25% down · 7.5% · 30yr
- Down + closing
- —
- Monthly P&I
- —
- Monthly cashflow
- —
- DSCR
- —
- Eligible?
- —
Personal DTI + credit; lowest rate.
DSCR
20% down · 8.5% · 30yr
- Down + closing
- —
- Monthly P&I
- —
- Monthly cashflow
- —
- DSCR
- —
- Eligible?
- —
No personal income docs; deal must DSCR.
Hard money
10% down · 12.0% · 12mo
- Down + closing
- —
- Monthly P&I
- —
- Monthly cashflow
- —
- DSCR
- —
- Eligible?
- —
Short-term bridge; refi at stabilization.
Listing history 7 events
-
2026-06-18days on market $149,900 Active 7 DOM
-
2026-06-17days on market $149,900 Active 6 DOM
-
2026-06-16days on market $149,900 Active 5 DOM
-
2026-06-15days on market $149,900 Active 4 DOM
-
2026-06-14days on market $149,900 Active 2 DOM
-
2026-06-13remarks 287-char remark
-
2026-06-13$149,900 Active 1 DOM
ⓘ Source: listings_history table (triggers on properties + properties_extension) + one-shot
backfill from property_details.listing_events for pre-trigger history.
Tax reassessment forecast MN · Partial reset (capped growth)
- Current annual tax
- $1,852 · $154/mo
- Projected year-2 tax
- $1,852 · $154/mo
- Expected delta
- $0/yr ($0/mo · 0.0%)
ⓘ Screening estimate from a state-policy table — verify with the county assessor before closing.
Climate risk First Street
- Flood 1/10 Low 0% chance over 30 yrs
- Wildfire 5/10 Major
- Heat 1/10 Low 7 d/yr ≥86°F today · 14 d/yr by 30 yrs out
- Wind 1/10 Low
- Air quality 1/10 Low 0 unhealthy d/yr today · 0 by 30 yrs out
Nearby sold comps map
Loading sold comps map…
Walkable amenities ~0.75 mi
Loading nearby amenities…
Taxation est. · year 1
- Rental income
- $12,692
- − Mortgage interest
- −$8,397
- − Property taxes
- −$1,852
- − Insurance
- −$750
- − Repairs & maintenance
- −$1,015
- − Management
- −$1,015
- − Depreciation
- −$4,361
- Taxable loss
- −$4,698
- Est. tax savings @ 24.0%
- +$1,127
- After-tax cash flow
- $-881/yr
For passive investors: Depreciation is non-cash, so a rental often shows a tax loss while cash-flowing — sheltering income. Rental losses are passive: they offset passive income freely, and up to $25,000/yr can offset ordinary (W-2) income if you actively participate and your MAGI is under $100k (phasing out to $0 by $150k); unused losses carry forward. On sale, claimed depreciation is recaptured at up to 25%, and gains may owe capital-gains tax (a 1031 exchange can defer both). Figures are a year-1 estimate at your 24.0% rate — not tax advice; consult a CPA.
Schools (NCES district)
- District
- Lake Superior Public School District
- NCES district ID
- 2740740
- Math proficiency
- 34% ▼ -24.00%
- Reading proficiency
- 53% ▼ -9.00%
- Median HH income
- $51,958
- Composite
- 37.51/100
- National rank
- #4399
- State rank
- #191 of 301 in MN
Livability — Silver Bay
- Score
- 74/100
- State rank
- #217
- US rank
- #4547
Category grades
Schools grade is shown separately in the Schools card above.
Census & demographics
- Census place
- Silver Bay, MN
- Population (ZIP)
- 2,450
Population outlook (Lake County) Hauer SSP2
- Today (2025)
- 9,943 people
- By 2030
- 9,437 · -5.1%
- By 2040
- 8,326 · -16.3%
- By 2050
- 7,365 · -25.9%
- By 2075
- 6,008 · -39.6%
- By 2100
- 5,038 · -49.3%
Race, ethnicity, and origin ACS 2023
- Neighborhood character
- Predominantly White (91%)
- Race & ethnicity
- White 91% Two or more races 7% Hispanic / Latino 2%
- Common ancestry
- Portuguese 21% Lithuanian 2% Scottish 2%
- Foreign-born
- 1% · Vietnam
- Languages at home
- 98% English-only · Other Indo-European 1%
Political lean MEDSL · Lake
- 2024 margin
- Toss-up / Even · D 51.0% · R 47.1% · Other 1.9%
- 2008→2024 swing
- -18.2pp toward R · 2008: 22.1pp · 2024: 3.9pp
- All cycles
- 2024: D+3.9 2020: D+3.5 2016: D+2.2 2012: D+21.1 2008: D+22.1
Not yet ingested
- Civics
- —
Market trends
- HPI YoY
- ▲ 52.26%
- Current HPI
- 490.17
- Rent YoY
- —
- Metro
- —
- State GDP YoY
- ▲ 2.41%
- F500 in state
- 34
Industry mix (Fortune 500 HQ in MN)
| Industry | F500 HQs | Revenue |
|---|---|---|
| Healthcare | 2 | $407B |
|
||
| Retail | 2 | $150B |
|
||
| Consumer Goods | 2 | $32B |
|
||
| Industrial Machinery | 2 | $6B |
|
||
| Agriculture | 1 | $40B |
|
||
| Healthcare / Medical Devices | 1 | $32B |
|
||
Price history
+15.4% since first listed5 events — show timeline
- 2026-06-11 Listed $149,900 LSAR
- 2025-09-02 Listed — LSAR
- 2023-02-07 Sold (Public Records) $128,900 Public Records
- 2023-01-31 Sold (MLS) $128,900 LSAR
- 2022-09-10 Listed $129,900 LSAR
Property tax history
+26.1%/yrLatest (2025): $1,852 · +414.0% YoY. Source: county tax records.
Cash-flow waterfall
monthlySold comps — $/sqft
last 12 mo · ≤1 miLoading sold comps…