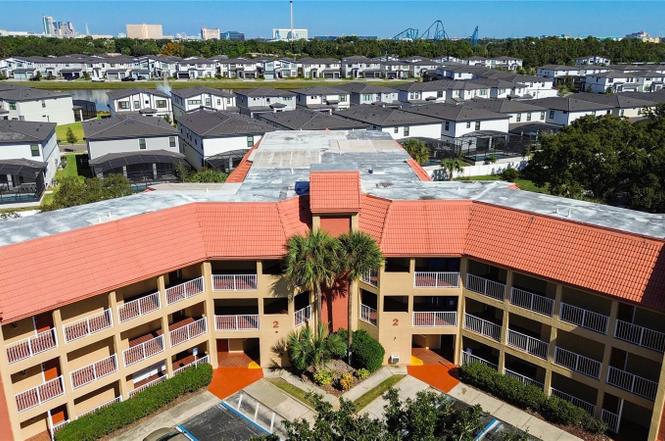
6337 Parc Corniche Dr #2304 · Williamsburg, FL
Flood risk No data
- FEMA flood zone
- —
- Chance of flooding over 30 yrs
- —
- Est. flood insurance / yr
- —
Fire risk No data
- Est. fire insurance / yr
- —
Heat risk No data
- Hot days now (above threshold)
- —
- Hot days in 30 yrs
- —
Wind risk No data
- Chance of severe wind over 30 yrs
- —
Air-quality risk No data
- Unhealthy air days now
- —
- Unhealthy air days in 30 yrs
- —
Risk factors via First Street. Map © Google.
Why this score? — see what drove the B grade
The composite is a weighted blend of 9 inputs, each scored 0–100. Each bar is that input's sub-score; the figure is the points it added to the 100-point composite (weight × sub-score).
- Cash flow +26.3/30.0
- 1% rule +10.0/10.0
- DSCR +8.9/10.0
- ARV discount +7.5/15.0
- Appreciation +5.1/10.0
- Livability +4.2/5.0
- Schools +4.1/10.0
- Condition / age +2.5/5.0
- Rent growth +1.7/5.0
$95,000
🖨 Deal sheet 📄 Offer letter ✓ Due diligence
Listing remarks
TURNKEY INVESTMENT – FULLY FURNISHED 2 BEDROOM CONDO AT PARC CORNICHE RESORT. Located in the heart of Orlando’s tourism corridor, this fully furnished 2-bedroom, 2-bath condo offers 806 sq ft and a desirable split floor plan with an open living and dining area. The kitchen and bathrooms feature granite countertops and tile flooring, while the living room, dining area, and bedrooms have carpet flooring for comfort. The kitchen is equipped with microwave, stovetop, refrigerator, and dishwasher, and the unit is move-in ready or ideal for vacation rental use. Step outside to a private balcony overlooking the pool, perfect for relaxing in the Florida afternoons. This third-floor unit
Key facts
- Fitness center
- Private balcony
- Outdoor jacuzzi
Tags
Property features AI
Finance
- Other: Furnished; Total living area approximately 806 square feet
- Financial info: Lease restrictions apply
- HOA & community: Monthly HOA fee of $777; Annual HOA/association fees total $9,324; Association approval required; Association covers pool, building maintenance, grounds maintenance, recreational facilities, security, and trash; Community amenities include fitness center, pool, and playground; Buyer approval required; Pets not allowed
Exterior
- Security: Community security included in association fees
- Utilities: Public water; Public sewer; Cable connected
- Home design: Condominium; Residential property; Southwest-facing; Located on 3rd floor; One-level living within the unit; Planned Development (P-D) zoning
- Construction: Stucco construction; Tile roof; Slab foundation; Built with 3 total stories in building; Building number 2
- Exterior features: Balcony; Paved road access
Interior
- Kitchen: Cooktop; Dishwasher; Microwave; Refrigerator
- Bedrooms: 2 bedrooms
- Flooring: Carpet; Ceramic tile
- Bathrooms: 2 full bathrooms
- Heating & cooling: Central heating (electric); Central air conditioning
- Interior features: Open floorplan; Building elevator
- Laundry & utility: No in-unit laundry
Neighborhood map
What this means for you Summary
Snapshot
- This is a 2-bed/2.0-bath condo listed at $95k.
Deal economics
- At list price, monthly cash flow is $245 ($3k/yr) — positive.
- The deal already cash-flows at list — no discount required.
- Meets the 1% rule at list price ($2k rent vs $95k).
- Recommended offer: $86k (9.0% below list) — sets the bar for market timing.
- Cap rate 9.4% vs local median 3.9% in Williamsburg — top-decile yield for the area; either an underpriced asset or a hidden risk that comps aren't pricing in. Stress-test before assuming the spread holds.
Location & tenants
- Location reads 85/100 on livability (#29 in FL, #608 nationally) — a professional / high-income tenant draw. Strengths: housing A+, health & safety A+, crime A; Watch: amenities D.
- Orange (suburban): math 46% / reading 51% proficiency, ranked #43 of 73 in FL (top 59%) — families likely to look elsewhere, expect single-tenant / working-renter base with shorter leases.
- Zoned schools: Sunshine Elementary (math 41% / reading 43%, grade F, #1,403 of 2,144 statewide, top 67%, 949 students, 41% FRL); Lake Buena Vista High School (1,714 students, 49% FRL).
- Market conditions: Rents falling (-3.2%/yr); 275 active listings in the ZIP; 33 comparable units currently listed for rent nearby; rentals leasing fast (median 3d on market — plan ~1-2 weeks tenant-placement turnaround); 8,053 units permitted in Orange County in 2024 (3,133 in 5+ unit buildings).
- This rent runs 37% of the median local income ($69k/yr) — at the standard rent-burdened threshold; future hikes will face affordability resistance.
Forward outlook
- In year one you build about $939 of equity ($657 loan paydown + $282 appreciation (0.3% local appreciation)).
- Orange County population projected at +52% by 2050 — long-run rental-demand tailwind backs the buy-and-hold thesis.
- At projected returns (0.3% appreciation + 0.0% rent growth), your $27k cash investment doubles in ~10 years — after that, you're playing with house money.
Negotiation context
- It's been on market 98 days — a 9% lower offer ($86k) is reasonable based on typical stale-listing flexibility.
Risks & watch-outs
- Watch-outs: HOA is 36% of rent.
Questions for the listing agent
- It's been on market 98 days. Have you received any prior offers? Is the seller open to a 9% concession, seller financing, or rate buy-down credit?
- What does the HOA fee cover, when was the last increase, and are there any pending special assessments or reserve-fund shortfalls?
- Any open or pending special assessments — roof, HVAC, plumbing, elevator, façade? What's the per-unit balance and payoff schedule, and is the seller paying it off at close or rolling it to the buyer?
- Why hasn't it sold? Are there any deal-killer items the seller is aware of (foundation, flood, title, zoning, code violations)?
- Is there a deadline driving the sale (1031 exchange, divorce, estate, relocation)? That informs how much negotiation room exists.
- Schools are F-rated, which usually means shorter tenancies and higher turnover. Who's the typical renter profile here, and what's been the actual vacancy rate?
- What's the average days-on-market for RENTAL listings here right now (not sales)? A rising rental-DOM trend means longer vacancies and softer asking-rent achievability than the comps imply.
- What's the recent tenant-quality profile in this submarket — average credit score on applications, eviction rate, late-payment / NSF rate, and stable-employment percentage? A property-management company in the area should have these aggregated.
- How much new apartment / multifamily construction is in the pipeline within 1–3 miles? Heavy new supply (>2% of stock underway) typically softens rents 12–24 months out; light construction supports rent growth.
Investment metrics
- 1% rule
- 2.25% ✓
- Cap rate
- 9.39%
- Cash-on-cash
- 11.06%
- DSCR
- 1.49
- GRM
- 3.7
CMA / ARV
No comps found within radius.
Projected returns pro-forma
0.3% appreciation · 0.0% rent growth · sell at horizon
- IRR
- 6.8%
- Equity multiple
- 1.32×
- Total profit
- $8,408
- Equity at exit
- $29,003
- IRR
- 7.6%
- Equity multiple
- 1.72×
- Total profit
- $19,264
- Equity at exit
- $36,016
Cash invested: $26,600 (down + closing). Projections, not guarantees.
Landlord ↔ Tenant lean methodology
- Overall (STATE)
- 87 Strongly Landlord-Friendly
- State Florida
- 87 Strongly Landlord-Friendly · R+3
- County
- — inherits STATE
- City
- — inherits STATE
ZIP-level market 32821
- Home prices YoY
- 0.1%
- Rents YoY
- -3.2%
- Active inventory
- 275
- Price-to-rent
- 3.7×
Monthly cashflow live
- Estimated rent
- $2,141 high interval (Pro) →
- Mortgage (P&I)
- −$498
- Tax from tax record
- −$132 /mo · $1,581/yr
- Insurance
- −$40
- HOA
- −$777
- Vacancy / Maint / Mgmt
- −$450
- Net cashflow
- $245
Break-even live
UW: 25.0% down · 7.5% · 30yr · 1.5% tax · 5.0% vac · 8.0% maint · 8.0% mgmt
Financing live
Cash to close
- Down payment
- $23,750
- Closing costs
- $2,850
- Reserves months
- —
- Total cash needed
- —
Loan-product check · same deal, 3 products live
Conventional
25% down · 7.5% · 30yr
- Down + closing
- —
- Monthly P&I
- —
- Monthly cashflow
- —
- DSCR
- —
- Eligible?
- —
Personal DTI + credit; lowest rate.
DSCR
20% down · 8.5% · 30yr
- Down + closing
- —
- Monthly P&I
- —
- Monthly cashflow
- —
- DSCR
- —
- Eligible?
- —
No personal income docs; deal must DSCR.
Hard money
10% down · 12.0% · 12mo
- Down + closing
- —
- Monthly P&I
- —
- Monthly cashflow
- —
- DSCR
- —
- Eligible?
- —
Short-term bridge; refi at stabilization.
Rent comps 33 comps
| Address | Beds | Baths | Sqft | Rent | $/sqft | DOM | Units | Dist |
|---|---|---|---|---|---|---|---|---|
| 10107 Ancora Cir Orlando, FL | 1.0–3.0 | 1.0–2.0 | 1091 | $2,102 | $1.93 | 2d | 23 | 0.25mi |
| 6000 Paradiso Grande Blvd Orlando, FL | 1.0–3.0 | 1.0–2.0 | 1305 | $2,836 | $2.17 | 7d | 21 | 0.25mi |
| 6600 Banner Lake Cir Orlando, FL | 1.0–3.0 | 1.0–2.0 | 975 | $1,824 | $1.87 | 1d | 18 | 0.32mi |
| 11833 Westwood Blvd Orlando, FL | 1.0–3.0 | 1.0–2.0 | 1085 | $2,229 | $2.05 | 1d | 11 | 0.36mi |
| 11128 Grande Pines Cir Orlando, FL | 1.0–3.0 | 1.0–2.0 | 1049 | $2,053 | $1.96 | 14d | 19 | 0.49mi |
| 11128 Grande Pines Cir Orlando, FL | 1.0–3.0 | 1.0–2.0 | 1049 | $2,019 | $1.92 | 2d | 16 | 0.49mi |
| 11544 Westwood Blvd #1311 Orlando, FL | 2.0 | 2.0 | 971 | $1,750 | $1.80 | 23d | 1 | 0.51mi |
| 11538 Westwood Blvd #218 Orlando, FL | 2.0 | 2.0 | 1100 | $3,000 | $2.73 | 23d | 1 | 0.52mi |
| 11588 Westwood Blvd #1514 Orlando, FL | 1.0 | 1.0 | 800 | $2,400 | $3.00 | 23d | 1 | 0.53mi |
| 11508 Westwood Blvd #313 Orlando, FL | 1.0 | 1.0 | 715 | $2,800 | $3.92 | 23d | 1 | 0.54mi |
| 11582 Westwood Blvd Orlando, FL | 1.0 | 1.0 | 754 | $1,374 | $1.82 | 23d | 2 | 0.56mi |
| 11520 Westwood Blvd Orlando, FL | 2.0 | 2.0 | 1000 | $3,000 | $3.00 | 23d | 1 | 0.56mi |
| 11520 Westwood Blvd Orlando, FL | 2.0 | 2.0 | 985 | $2,450 | $2.49 | 7d | 2 | 0.56mi |
| 6902 Villa De Costa Dr Orlando, FL | 2.0 | 2.0 | 738 | $1,600 | $2.17 | 13d | 1 | 0.56mi |
| 11532 Westwood Blvd #628 Orlando, FL | 2.0 | 2.0 | 1100 | $3,000 | $2.73 | 23d | 1 | 0.58mi |
| 11574 Westwood Blvd #1134 Orlando, FL | 1.0 | 1.0 | 754 | $1,200 | $1.59 | 23d | 1 | 0.59mi |
| 11568 Westwood Blvd #1021 Orlando, FL | 2.0 | 2.0 | 1067 | $1,775 | $1.66 | 17d | 1 | 0.63mi |
| 11562 Westwood Blvd #934 Orlando, FL | 1.0 | 1.0 | 800 | $2,400 | $3.00 | 23d | 1 | 0.66mi |
| 6800 Villa de Costa Dr Orlando, FL | 2.0 | 2.0 | 960 | $1,899 | $1.98 | 2d | 6 | 0.66mi |
| 11562 Westwood Blvd Orlando, FL | 1.0–2.0 | 1.0–2.0 | 933 | $2,400 | $2.57 | 7d | 2 | 0.66mi |
| 6820 Axis West Cir Orlando, FL | 1.0–3.0 | 1.0–2.0 | 1033 | $2,343 | $2.27 | 2d | 18 | 0.81mi |
| 6801 Integra Cove Blvd Orlando, FL | 3.0 | 1.0–2.0 | 966 | $2,251 | $2.33 | 2d | 30 | 0.82mi |
| 12024 Meadow Bend Loop Orlando, FL | 1.0–3.0 | 1.0–2.0 | 1058 | $1,962 | $1.85 | 23d | 31 | 0.82mi |
| 6739 Mission Club Blvd Orlando, FL | 1.0–3.0 | 1.0–2.0 | 947 | $1,652 | $1.74 | 1d | 24 | 0.96mi |
| 7118 Altis Way Orlando, FL | 1.0–3.0 | 1.0–2.0 | 1119 | $2,112 | $1.89 | 1d | 20 | 1.07mi |
| 6260 Juniper Pine Way Orlando, FL | 1.0–3.0 | 1.0–2.0 | 1094 | $2,492 | $2.28 | 2d | 32 | 1.08mi |
| 6701 Westwood Blvd Orlando, FL | 1.0–2.0 | 1.0–2.0 | 735 | $1,699 | $2.31 | 2d | 6 | 1.09mi |
| 7010 Bayfront Scenic Dr Orlando, FL | 1.0–2.0 | 1.0–2.0 | 903 | $2,800 | $3.10 | 2d | 21 | 1.22mi |
| 12515 Lake Square Cir Orlando, FL | 1.0–3.0 | 1.0–2.0 | 1087 | $3,022 | $2.78 | 1d | 21 | 1.33mi |
| 7511 Solstice Cir Orlando, FL | 3.0 | 1.0–2.0 | 1168 | $2,527 | $2.16 | 2d | 36 | 1.35mi |
| 11115 S Beach Cir Orlando, FL | 1.0–3.0 | 1.0–2.0 | 1116 | $2,422 | $2.17 | 1d | 50 | 1.39mi |
| 7119 Sand Lake Reserve Dr Orlando, FL | 1.0–3.0 | 1.0–2.0 | 1041 | $2,295 | $2.20 | 1d | 17 | 1.40mi |
| 10535 Hamilton Dawn St Orlando, FL | 1.0–2.0 | 1.0–2.0 | 936 | $2,642 | $2.82 | 2d | 22 | 1.40mi |
HOA detail condo
- Monthly dues
- $777 · $9,324/yr
- Likely covers
- pool
- Assessments
- None detected in remarks — confirm with the listing agent.
Listing history 11 events
-
2026-06-18days on market $95,000 Active 98 DOM
-
2026-06-17days on market $95,000 Active 97 DOM
-
2026-06-16days on market $95,000 Active 96 DOM
-
2026-06-15days on market $95,000 Active 95 DOM
-
2026-06-13days on market $95,000 Active 93 DOM
-
2026-06-13pricedays on market $95,000 Active 92 DOM
-
2026-06-09days on market $109,900 Active 89 DOM
-
2026-06-08days on market $109,900 Active 88 DOM
-
2026-06-07days on market $109,900 Active 87 DOM
-
2026-06-04days on market $109,900 Active 84 DOM
-
2026-03-04$109,900 Active
ⓘ Source: listings_history table (triggers on properties + properties_extension) + one-shot
backfill from property_details.listing_events for pre-trigger history.
Tax reassessment forecast FL · Resets to sale price
- Current annual tax
- $1,581 · $132/mo
- Projected year-2 tax
- $1,581 · $132/mo
- Expected delta
- $0/yr ($0/mo · 0.0%)
ⓘ Screening estimate from a state-policy table — verify with the county assessor before closing.
Nearby sold comps map
Loading sold comps map…
Walkable amenities ~0.75 mi
Loading nearby amenities…
Taxation est. · year 1
- Rental income
- $25,695
- − Mortgage interest
- −$5,321
- − Property taxes
- −$1,581
- − Insurance
- −$475
- − Repairs & maintenance
- −$2,056
- − Management
- −$2,056
- − HOA
- −$9,324
- − Depreciation
- −$2,764
- Taxable income
- $2,119
- Est. tax owed @ 24.0%
- −$509
- After-tax cash flow
- $2,433/yr
For passive investors: Depreciation is non-cash, so a rental often shows a tax loss while cash-flowing — sheltering income. Rental losses are passive: they offset passive income freely, and up to $25,000/yr can offset ordinary (W-2) income if you actively participate and your MAGI is under $100k (phasing out to $0 by $150k); unused losses carry forward. On sale, claimed depreciation is recaptured at up to 25%, and gains may owe capital-gains tax (a 1031 exchange can defer both). Figures are a year-1 estimate at your 24.0% rate — not tax advice; consult a CPA.
Schools (NCES district)
- District
- Orange
- NCES district ID
- 1201440
- Math proficiency
- 46% ▼ -9.00%
- Reading proficiency
- 51% ▼ -2.00%
- Median HH income
- $49,350
- Composite
- 41.47/100
- National rank
- #3461
- State rank
- #43 of 73 in FL
Livability — Williamsburg
- Score
- 85/100
- State rank
- #29
- US rank
- #608
Category grades
Schools grade is shown separately in the Schools card above.
Census & demographics
- County
- Orange County · 1,471,359 people
- Metro
- Orlando-Kissimmee-Sanford, FL
- Population (ZIP)
- 26,161
- Household income
- $69,348
- Rent vs Own
- Severe rent burden
- 1840.0
Population outlook (Orange County) Hauer SSP2
- Today (2025)
- 1,618,226 people
- By 2030
- 1,787,404 · +10.5%
- By 2040
- 2,125,621 · +31.4%
- By 2050
- 2,454,016 · +51.6%
- By 2075
- 3,173,711 · +96.1%
- By 2100
- 3,607,781 · +122.9%
Race, ethnicity, and origin ACS 2023
- Neighborhood character
- Diverse neighborhood (Simpson 0.65)
- Race & ethnicity
- White 43% Hispanic / Latino 41% Two or more races 19% Black 6% Asian 3% Pacific Islander 1% Native American 1%
- Hispanic origin (detail)
- Mexican 3% Puerto Rican 11% Cuban 1% Dominican 4%
- Common ancestry
- Romanian 3% Lithuanian 2% Estonian 2%
- Foreign-born
- 29% · Canada, Jamaica, China
- Languages at home
- 58% English-only · Spanish 32% Other Indo-European 4% Other Asian/Pacific 2%
Political lean MEDSL · Orange
- 2024 margin
- D (+13.6) · D 56.1% · R 42.5% · Other 1.3%
- 2008→2024 swing
- -5.0pp toward R · 2008: 18.6pp · 2024: 13.6pp
- All cycles
- 2024: D+13.6 2020: D+23.1 2016: D+24.6 2012: D+18.2 2008: D+18.6
Not yet ingested
- Civics
- —
Market trends
- HPI YoY
- ▲ 0.30%
- Current HPI
- 300.2268
- Rent YoY
- ▼ -3.20%
- Metro
- Orlando-Kissimmee-Sanford, FL
- State GDP YoY
- ▲ 3.28%
- F500 in state
- 36
Industry mix (Fortune 500 HQ in FL)
| Industry | F500 HQs | Revenue |
|---|---|---|
| Industrial Technology | 2 | $29B |
|
||
| Insurance | 2 | $17B |
|
||
| Retail | 1 | $60B |
|
||
| Technology Distribution | 1 | $58B |
|
||
| Homebuilding | 1 | $35B |
|
||
| Technology Manufacturing | 1 | $35B |
|
||
Price history
1 event — show timeline
- 2026-03-04 Listed $109,900 Stellar MLS as Distributed by MLS Grid
Property tax history
+5.3%/yrLatest (2025): $1,581 · +5.5% YoY. Source: county tax records.
Cash-flow waterfall
monthlySold comps — $/sqft
last 12 mo · ≤1 miLoading sold comps…