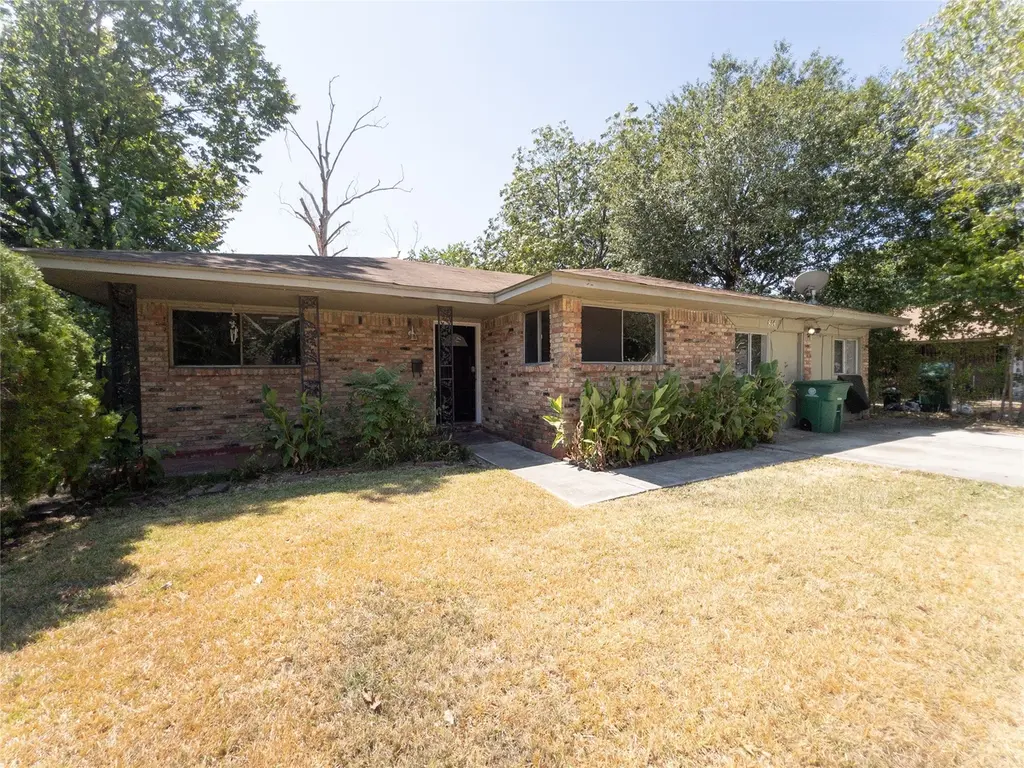
814 Eastlake St · Houston, TX
Flood risk 3/10 · Minor
- FEMA flood zone
- X (unshaded)
- Chance of flooding over 30 yrs
- 0.2%
- Est. flood insurance / yr
- $507 – $1,088
Fire risk 1/10 · Minimal
- Est. fire insurance / yr
- $1,222 – $2,270
Heat risk 10/10 · Severe
- Hot days now (above 109°F)
- 7 days/yr
- Hot days in 30 yrs
- 24 days/yr
Wind risk 9/10 · Severe
- Chance of severe wind over 30 yrs
- 99.0%
Air-quality risk 2/10 · Minimal
- Unhealthy air days now
- 1 days/yr
- Unhealthy air days in 30 yrs
- 2 days/yr
Risk factors via First Street. Map © Google.
Why this score? — see what drove the F grade
The composite is a weighted blend of 9 inputs, each scored 0–100. Each bar is that input's sub-score; the figure is the points it added to the 100-point composite (weight × sub-score).
- ARV discount +14.6/15.0
- Cash flow +6.2/30.0
- Livability +3.7/5.0
- Schools +2.6/10.0
- Condition / age +2.5/5.0
- 1% rule +2.2/10.0
- Rent growth +2.2/5.0
- DSCR +0.5/10.0
- Appreciation +0.0/10.0
$209,000
🖨 Deal sheet 📄 Offer letter ✓ Due diligence
Listing remarks MLS
PRICE REDUCTION!!! This single-story home has a thoughtful layout. There is a large family room with lots of windows allowing natural light to come in. New exterior water plumbing and gas system lines, and New water heater. The roof is only a few years old, granite countertop in the kitchen, and a large backyard. This location is very convenient for shopping, dining, etc. Only 4 minutes walking distance to the elementary school and 5 minutes to the park. Minutes driving to I-45, 610 and Beltway 8.Sell AS-IT.
Key facts
- Large family room
- Large backyard
- Natural light
Tags
Neighborhood map
What this means for you Summary
Snapshot
- This is a 3-bed/2.0-bath single-family listed at $209k.
Deal economics
- At list price, monthly cash flow is $-384 ($-5k/yr) — negative.
- To cash-flow at today's rent, offer at most $141k (32.4% below list).
- To meet the 1% rule (rent ≥ 1% of price), the offer needs to be $151k (27.8% below list).
- Recommended offer: $141k (32.4% below list) — sets the bar for cash-flow.
- Cap rate 4.1% vs local median 3.2% in Houston — meaningfully above typical; check what's discounted (condition, days-on-market, listing class) to confirm the premium yield is real.
Location & tenants
- Location reads 74/100 on livability (#184 in TX, #4,771 nationally) — a middle-class / working-renter tenant base. Strengths: amenities A+, cost of living A+, housing A+; Watch: schools D, crime F.
- Pasadena ISD (suburban): math 29% / reading 32% proficiency, ranked #612 of 826 in TX (top 74%) — families likely to look elsewhere, expect single-tenant / working-renter base with shorter leases; 71% free/reduced lunch — lower-income household profile, screen leases tightly.
- Market conditions: Rents soft (-1.4%/yr); 93 active listings in the ZIP; 12 comparable units currently listed for rent nearby; rentals leasing fast (median 13d on market — plan ~1-2 weeks tenant-placement turnaround); 29,883 units permitted in Harris County in 2024 (8,621 in 5+ unit buildings).
- This rent runs 31% of the median local income ($58k/yr) — at the standard rent-burdened threshold; future hikes will face affordability resistance.
Forward outlook
- Local home prices are declining (-3.0%/yr); year-one equity from $1k of loan paydown is wiped out by about $6k of value loss. Plan a longer hold.
- Harris County population projected at +47% by 2050 — long-run rental-demand tailwind backs the buy-and-hold thesis.
Negotiation context
- It's been on market 391 days — a 12% lower offer ($184k) is reasonable based on typical stale-listing flexibility.
- 5 sale attempts since 7y ago; this cycle's ask has dropped $15k (7%) from the opening price — seller is motivated, your offer sets the floor, not the list.
- Current owner paid $62k; list at $209k implies a 234% gain — meaningful room to come down on a strong offer.
Risks & watch-outs
- Watch-outs: built in 1955 — expect roof / HVAC / electrical / plumbing capex.
- Climate carrying-cost: severe wind risk, 99% chance of damaging wind over 30y; extreme-heat days projected 7→24/yr by 2055 (HVAC capex compounding) — expect insurance premiums to compound above CPI over the hold.
Questions for the listing agent
- What do current leases actually rent for vs. the listed asking? Can we see a recent rent roll and the last 12 months of T-12 income?
- It's been on market 391 days. Have you received any prior offers? Is the seller open to a 32% concession, seller financing, or rate buy-down credit?
- Built in 1955 — when were the roof, HVAC, electrical panel, plumbing, and water heater last replaced?
- Why hasn't it sold? Are there any deal-killer items the seller is aware of (foundation, flood, title, zoning, code violations)?
- Is there a deadline driving the sale (1031 exchange, divorce, estate, relocation)? That informs how much negotiation room exists.
- Schools are D-rated, which usually means shorter tenancies and higher turnover. Who's the typical renter profile here, and what's been the actual vacancy rate?
- Crime grade is F in this area — have there been break-ins, vandalism, or insurance claims at this property in the last 3 years? What carrier currently insures it and at what premium?
- The area grade is low — what's the realistic commute time and amenity access for the typical tenant pool here? Any planned neighborhood developments (good or bad) we should know about?
- What's the average days-on-market for RENTAL listings here right now (not sales)? A rising rental-DOM trend means longer vacancies and softer asking-rent achievability than the comps imply.
- What's the recent tenant-quality profile in this submarket — average credit score on applications, eviction rate, late-payment / NSF rate, and stable-employment percentage? A property-management company in the area should have these aggregated.
- How much new for-sale + rental construction is in the pipeline within 1–3 miles? Heavy new supply typically softens prices + rents 12–24 months out; constrained supply supports both.
Investment metrics
- 1% rule
- 0.72% ✗
- Cap rate
- 4.09%
- Cash-on-cash
- -7.87%
- DSCR
- 0.65
- GRM
- 11.5
CMA / ARV
- ARV (median comp)
- $248,433
- List price
- $209,000
- Delta
- -15.87%
- Verdict
- UNDERPRICED
- Comps
- 20 within 1.0 mi
Show comp detail 12 sales within ~0.75 mi
| Address | Dist | Beds/Ba | Sqft | Sold | Price | $/sf | Match |
|---|---|---|---|---|---|---|---|
| 918 Gilpin St | 0.16mi | 4/2.0 (+1) | 1,812 (-1%) | 7mo | $229,999 | $127 | 80 |
| 910 Eastlake St | 0.09mi | 4/2.0 (+1) | 1,923 (+5%) | 9mo | $250,000 | $130 | 74 |
| 678 Edgebrook Dr | 0.21mi | 4/2.0 (+1) | 1,766 (-3%) | 9mo | $198,000 | $112 | 72 |
| 623 Gilpin St | 0.36mi | 4/2.0 (+1) | 1,878 (+3%) | 3mo | $244,800 | $130 | 70 |
| 9954 Ney St | 0.29mi | 3/2.0 | 1,666 (-9%) | 7mo | $199,990 | $120 | 66 |
| 2115 Boykin St | 0.64mi | 3/3.0 | 1,843 (+1%) | 2mo | $325,000 | $176 | 62 |
| 1127 Roper St | 0.52mi | 4/2.0 (+1) | 1,867 (+2%) | 7mo | $289,876 | $155 | 61 |
| 2146 Minnesota St | 0.55mi | 4/2.0 (+1) | 1,679 (-8%) | 8mo | $169,000 | $101 | 49 |
| 10526 Tolman St | 0.57mi | 4/1.0 (+1) | 1,665 (-9%) | 2mo | $205,000 | $123 | 48 |
| 8511 Freewood St | 0.52mi | 3/2.0 | 2,060 (+13%) | 8mo | $190,000 | $92 | 47 |
| 930 Creager St | 0.48mi | 4/1.0 (+1) | 1,590 (-13%) | 0mo | $190,000 | $119 | 47 |
| 8115 Tarbell Rd | 0.66mi | 4/2.0 (+1) | 1,625 (-11%) | 3mo | $245,900 | $151 | 43 |
Match score weights: distance 35% · size 25% · config 20% · recency 20%. Top-matched comps best support the ARV.
Projected returns pro-forma
-3.0% appreciation · 0.0% rent growth · sell at horizon
- IRR
- -33.8%
- Equity multiple
- -0.07×
- Total profit
- $-62,621
- Equity at exit
- $31,163
- IRR
- -67.5%
- Equity multiple
- -0.75×
- Total profit
- $-102,660
- Equity at exit
- $18,071
Cash invested: $58,520 (down + closing). Projections, not guarantees.
Landlord ↔ Tenant lean methodology
- Overall (STATE)
- 87 Strongly Landlord-Friendly
- State Texas
- 87 Strongly Landlord-Friendly · R+5
- County
- — inherits STATE
- City
- — inherits STATE
ZIP-level market 77034
- Home prices YoY
- -15.1%
- Rents YoY
- -1.4%
- Active inventory
- 93
- Price-to-rent
- 11.5×
Monthly cashflow live
- Estimated rent
- $1,508 high interval (Pro) →
- Mortgage (P&I)
- −$1,096
- Tax from tax record
- −$392 /mo · $4,707/yr
- Insurance
- −$87
- HOA
- −$0
- Vacancy / Maint / Mgmt
- −$317
- Net cashflow
- $-384
Break-even live
UW: 25.0% down · 7.5% · 30yr · 1.5% tax · 5.0% vac · 8.0% maint · 8.0% mgmt
Financing live
Cash to close
- Down payment
- $52,250
- Closing costs
- $6,270
- Reserves months
- —
- Total cash needed
- —
Loan-product check · same deal, 3 products live
Conventional
25% down · 7.5% · 30yr
- Down + closing
- —
- Monthly P&I
- —
- Monthly cashflow
- —
- DSCR
- —
- Eligible?
- —
Personal DTI + credit; lowest rate.
DSCR
20% down · 8.5% · 30yr
- Down + closing
- —
- Monthly P&I
- —
- Monthly cashflow
- —
- DSCR
- —
- Eligible?
- —
No personal income docs; deal must DSCR.
Hard money
10% down · 12.0% · 12mo
- Down + closing
- —
- Monthly P&I
- —
- Monthly cashflow
- —
- DSCR
- —
- Eligible?
- —
Short-term bridge; refi at stabilization.
Rent comps 12 comps
| Address | Beds | Baths | Sqft | Rent | $/sqft | DOM | Units | Dist |
|---|---|---|---|---|---|---|---|---|
| 10915 Gulf Fwy Houston, TX | 3.0 | 3.0 | 1286 | $1,400 | $1.09 | 20d | 1 | 0.59mi |
| 10915 Gulf Fwy Houston, TX | 3.0 | 3.0 | 1286 | $1,400 | $1.09 | 43d | 1 | 0.59mi |
| 3925 Arlington Square Dr Houston, TX | 2.0 | 1.0–2.5 | 930 | $1,190 | $1.28 | 2d | 23 | 0.95mi |
| 9465 Clearwood Dr Unit 9498 Houston, TX | 3.0 | 2.0 | 1232 | $1,375 | $1.12 | 43d | 1 | 0.97mi |
| 9465 Clearwood Dr Unit 3174 Houston, TX | 3.0 | 2.0 | 1232 | $1,332 | $1.08 | 2d | 1 | 0.97mi |
| 3954 Arlington Square Dr Houston, TX | 1.0–4.0 | 1.0–3.0 | 975 | $1,366 | $1.40 | 1d | 23 | 1.04mi |
| 9526 Yearling Branch Dr Houston, TX | 3.0 | 3.0 | 2026 | $1,955 | $0.96 | 24d | 1 | 1.04mi |
| 9130 Arledge St Houston, TX | 3.0 | 2.0 | 1253 | $1,700 | $1.36 | 43d | 1 | 1.18mi |
| 9815 Almeda-Genoa Rd Unit 510 Houston, TX | 3.0 | 2.0 | 1290 | $1,773 | $1.37 | 12d | 1 | 1.20mi |
| 9815 Almeda-Genoa Rd Unit 9848 Houston, TX | 3.0 | 2.0 | 1290 | $1,781 | $1.38 | 2d | 1 | 1.20mi |
| 10100 Almeda-Genoa Rd Unit 3165 Houston, TX | 3.0 | 2.0 | 1230 | $1,946 | $1.58 | 2d | 1 | 1.24mi |
| 10100 Almeda-Genoa Rd Unit 10133 Houston, TX | 3.0 | 2.0 | 1230 | $1,978 | $1.61 | 10d | 1 | 1.24mi |
Listing history 41 events
-
2026-06-18days on market $209,000 Active 391 DOM
-
2026-06-17days on market $209,000 Active 390 DOM
-
2026-06-16days on market $209,000 Active 389 DOM
-
2026-06-15days on market $209,000 Active 388 DOM
-
2026-06-13days on market $209,000 Active 386 DOM
-
2026-06-10days on market $209,000 Active 382 DOM
-
2026-06-08days on market $209,000 Active 381 DOM
-
2026-06-07days on market $209,000 Active 380 DOM
-
2026-06-04days on market $209,000 Active 377 DOM
-
2026-06-03days on market $209,000 Active 376 DOM
-
2026-06-02days on market $209,000 Active 375 DOM
-
2026-06-01days on market $209,000 Active 374 DOM
-
2026-05-31days on market $209,000 Active 373 DOM
-
2026-04-08price $219,000 514-char remark
Show marketing remark (514 chars)
PRICE REDUCTION!!! This single-story home has a thoughtful layout. There is a large family room with lots of windows allowing natural light to come in. New exterior water plumbing and gas system lines, and New water heater. The roof is only a few years old, granite countertop in the kitchen, and a large backyard. This location is very convenient for shopping, dining, etc. Only 4 minutes walking distance to the elementary school and 5 minutes to the park. Minutes driving to I-45, 610 and Beltway 8.Sell AS-IT.
-
2026-01-14price $220,000 514-char remark
Show marketing remark (514 chars)
PRICE REDUCTION!!! This single-story home has a thoughtful layout. There is a large family room with lots of windows allowing natural light to come in. New exterior water plumbing and gas system lines, and New water heater. The roof is only a few years old, granite countertop in the kitchen, and a large backyard. This location is very convenient for shopping, dining, etc. Only 4 minutes walking distance to the elementary school and 5 minutes to the park. Minutes driving to I-45, 610 and Beltway 8.Sell AS-IT.
-
2025-07-01price $222,000 514-char remark
Show marketing remark (514 chars)
PRICE REDUCTION!!! This single-story home has a thoughtful layout. There is a large family room with lots of windows allowing natural light to come in. New exterior water plumbing and gas system lines, and New water heater. The roof is only a few years old, granite countertop in the kitchen, and a large backyard. This location is very convenient for shopping, dining, etc. Only 4 minutes walking distance to the elementary school and 5 minutes to the park. Minutes driving to I-45, 610 and Beltway 8.Sell AS-IT.
-
2025-05-24$224,000 Active 514-char remark
Show marketing remark (514 chars)
PRICE REDUCTION!!! This single-story home has a thoughtful layout. There is a large family room with lots of windows allowing natural light to come in. New exterior water plumbing and gas system lines, and New water heater. The roof is only a few years old, granite countertop in the kitchen, and a large backyard. This location is very convenient for shopping, dining, etc. Only 4 minutes walking distance to the elementary school and 5 minutes to the park. Minutes driving to I-45, 610 and Beltway 8.Sell AS-IT.
-
2025-05-24historical
Show marketing remark (514 chars)
PRICE REDUCTION!!! This single-story home has a thoughtful layout. There is a large family room with lots of windows allowing natural light to come in. New exterior water plumbing and gas system lines, and New water heater. The roof is only a few years old, granite countertop in the kitchen, and a large backyard. This location is very convenient for shopping, dining, etc. Only 4 minutes walking distance to the elementary school and 5 minutes to the park. Minutes driving to I-45, 610 and Beltway 8.Sell AS-IT.
-
2025-03-07price $226,000
-
2025-02-13price $228,000
-
2025-01-30price $233,000
-
2025-01-21$238,000 Active
-
2024-11-07historical
-
2024-01-10price $240,000
-
2023-11-27$250,000 Active
-
2023-11-26historical
-
2023-11-06price $265,000
-
2023-09-18price $270,000
-
2023-08-29$275,000 Active
-
2019-07-19status Pending, Continue to Show
-
2019-07-18historical
-
2019-03-28price $150,000
-
2019-03-19price $145,000
-
2019-03-13price $148,900
-
2019-02-17price $149,900
-
2019-01-21$155,000 Active
-
2004-12-02soldstatus
-
2004-01-07soldstatus
-
1998-06-11soldstatus
-
1998-06-11soldstatus
-
1998-06-01soldstatus $62,500
ⓘ Source: listings_history table (triggers on properties + properties_extension) + one-shot
backfill from property_details.listing_events for pre-trigger history.
Tax reassessment forecast TX · Resets to sale price
- Current annual tax
- $4,707 · $392/mo
- Projected year-2 tax
- $4,707 · $392/mo
- Expected delta
- $0/yr ($0/mo · 0.0%)
ⓘ Screening estimate from a state-policy table — verify with the county assessor before closing.
Climate risk First Street
- Flood 3/10 Moderate FEMA zone X (unshaded) · 20% chance over 30 yrs
- Wildfire 1/10 Low
- Heat 10/10 Extreme 7 d/yr ≥109°F today · 24 d/yr by 30 yrs out
- Wind 9/10 Extreme 99% chance of damaging wind over 30 yrs
- Air quality 2/10 Low 1 unhealthy d/yr today · 2 by 30 yrs out
Nearby sold comps map
Loading sold comps map…
Walkable amenities ~0.75 mi
Loading nearby amenities…
Taxation est. · year 1
- Rental income
- $18,101
- − Mortgage interest
- −$11,707
- − Property taxes
- −$4,707
- − Insurance
- −$1,045
- − Repairs & maintenance
- −$1,448
- − Management
- −$1,448
- − Depreciation
- −$6,080
- Taxable loss
- −$8,334
- Est. tax savings @ 24.0%
- +$2,000
- After-tax cash flow
- $-2,604/yr
For passive investors: Depreciation is non-cash, so a rental often shows a tax loss while cash-flowing — sheltering income. Rental losses are passive: they offset passive income freely, and up to $25,000/yr can offset ordinary (W-2) income if you actively participate and your MAGI is under $100k (phasing out to $0 by $150k); unused losses carry forward. On sale, claimed depreciation is recaptured at up to 25%, and gains may owe capital-gains tax (a 1031 exchange can defer both). Figures are a year-1 estimate at your 24.0% rate — not tax advice; consult a CPA.
Schools (NCES district)
- District
- Pasadena ISD
- NCES district ID
- 4834320
- Math proficiency
- 29% ▼ -17.00%
- Reading proficiency
- 32% ▼ -9.00%
- Median HH income
- $45,163
- Composite
- 26.15/100
- National rank
- #7275
- State rank
- #612 of 826 in TX
Livability — Houston
- Score
- 74/100
- State rank
- #184
- US rank
- #4771
Category grades
Schools grade is shown separately in the Schools card above.
Census & demographics
- Census place
- Houston, TX
- County
- Harris County · 4,702,590 people
- City population
- 3,226,434
- Metro
- Houston-The Woodlands-Sugar Land, TX
- Population (ZIP)
- 36,456
- Household income
- $58,217
- Rent vs Own
- Severe rent burden
- 1809.0
Population outlook (Harris County) Hauer SSP2
- Today (2025)
- 5,571,493 people
- By 2030
- 6,089,821 · +9.3%
- By 2040
- 7,142,806 · +28.2%
- By 2050
- 8,185,864 · +46.9%
- By 2075
- 10,574,329 · +89.8%
- By 2100
- 12,109,958 · +117.4%
Race, ethnicity, and origin ACS 2023
- Neighborhood character
- Predominantly Hispanic (71%)
- Race & ethnicity
- Hispanic / Latino 71% Two or more races 32% Black 11% White 11% Asian 5% Native American 2%
- Hispanic origin (detail)
- Mexican 51% Puerto Rican 1%
- Foreign-born
- 32% · Canada, Vietnam, China
- Languages at home
- 35% English-only · Spanish 60% Vietnamese 2% Other Asian/Pacific 1%
Political lean MEDSL · Harris
- 2024 margin
- Lean D (+5.5) · D 52.0% · R 46.4% · Other 1.6%
- 2008→2024 swing
- +3.9pp toward D · 2008: 1.6pp · 2024: 5.5pp
- All cycles
- 2024: D+5.5 2020: D+13.3 2016: D+12.4 2012: D+0.1 2008: D+1.6
Not yet ingested
- Civics
- —
Market trends
- HPI YoY
- ▼ -48.32%
- Current HPI
- 272.1697
- Rent YoY
- ▼ -1.36%
- Metro
- Houston-The Woodlands-Sugar Land, TX
- State GDP YoY
- ▲ 3.95%
- F500 in state
- 110
Industry mix (Fortune 500 HQ in TX)
| Industry | F500 HQs | Revenue |
|---|---|---|
| Energy | 16 | $1,198B |
|
||
| Technology | 5 | $198B |
|
||
| Engineering / Construction | 4 | $72B |
|
||
| Energy Services | 3 | $60B |
|
||
| Utilities | 3 | $41B |
|
||
| Healthcare | 2 | $330B |
|
||
Price history
+250.4% since first listed28 events — show timeline
- 2026-04-08 Price Changed $219,000 HARMLS
- 2026-01-14 Price Changed $220,000 HARMLS
- 2025-07-01 Price Changed $222,000 HARMLS
- 2025-05-24 Listing Removed — HARMLS
- 2025-05-24 Listed $224,000 HARMLS
- 2025-03-07 Price Changed $226,000 HARMLS
- 2025-02-13 Price Changed $228,000 HARMLS
- 2025-01-30 Price Changed $233,000 HARMLS
- 2025-01-21 Listed $238,000 HARMLS
- 2024-11-07 Listing Removed — HARMLS
- 2024-01-10 Price Changed $240,000 HARMLS
- 2023-11-27 Listed $250,000 HARMLS
- 2023-11-26 Listing Removed — HARMLS
- 2023-11-06 Price Changed $265,000 HARMLS
- 2023-09-18 Price Changed $270,000 HARMLS
- 2023-08-29 Listed $275,000 HARMLS
- 2019-07-19 Pending — HARMLS
- 2019-07-18 Listing Removed — HARMLS
- 2019-03-28 Price Changed $150,000 HARMLS
- 2019-03-19 Price Changed $145,000 HARMLS
- 2019-03-13 Price Changed $148,900 HARMLS
- 2019-02-17 Price Changed $149,900 HARMLS
- 2019-01-21 Listed $155,000 HARMLS
- 2004-12-02 Sold (Public Records) — Public Records
- 2004-01-07 Sold (Public Records) — Public Records
- 1998-06-11 Sold (Public Records) — Public Records
- 1998-06-11 Sold (Public Records) — Public Records
- 1998-06-01 Sold (Public Records) $62,500 Public Records
Property tax history
+6.1%/yrLatest (2025): $4,707 · +11.2% YoY. Source: county tax records.
Cash-flow waterfall
monthlySold comps — $/sqft
last 12 mo · ≤1 miLoading sold comps…