1902 S Fannin St · Amarillo, TX
Flood risk 1/10 · Minimal
- FEMA flood zone
- X (unshaded)
- Chance of flooding over 30 yrs
- 0.0%
- Est. flood insurance / yr
- $507 – $1,088
Fire risk 1/10 · Minimal
- Est. fire insurance / yr
- $1,222 – $2,270
Heat risk 4/10 · Minor
- Hot days now (above 97°F)
- 7 days/yr
- Hot days in 30 yrs
- 20 days/yr
Wind risk 2/10 · Minimal
- Chance of severe wind over 30 yrs
- —
Air-quality risk 2/10 · Minimal
- Unhealthy air days now
- 1 days/yr
- Unhealthy air days in 30 yrs
- 1 days/yr
Risk factors via First Street. Map © Google.
Why this score? — see what drove the D grade
The composite is a weighted blend of 9 inputs, each scored 0–100. Each bar is that input's sub-score; the figure is the points it added to the 100-point composite (weight × sub-score).
- Cash flow +13.7/30.0
- ARV discount +7.5/15.0
- DSCR +4.2/10.0
- 1% rule +4.0/10.0
- Rent growth +3.8/5.0
- Schools +3.6/10.0
- Livability +3.3/5.0
- Condition / age +2.5/5.0
- Appreciation +0.0/10.0
$165,000
🖨 Deal sheet (PDF) 📄 Offer letter ✓ Due diligence
Listing remarks MLS
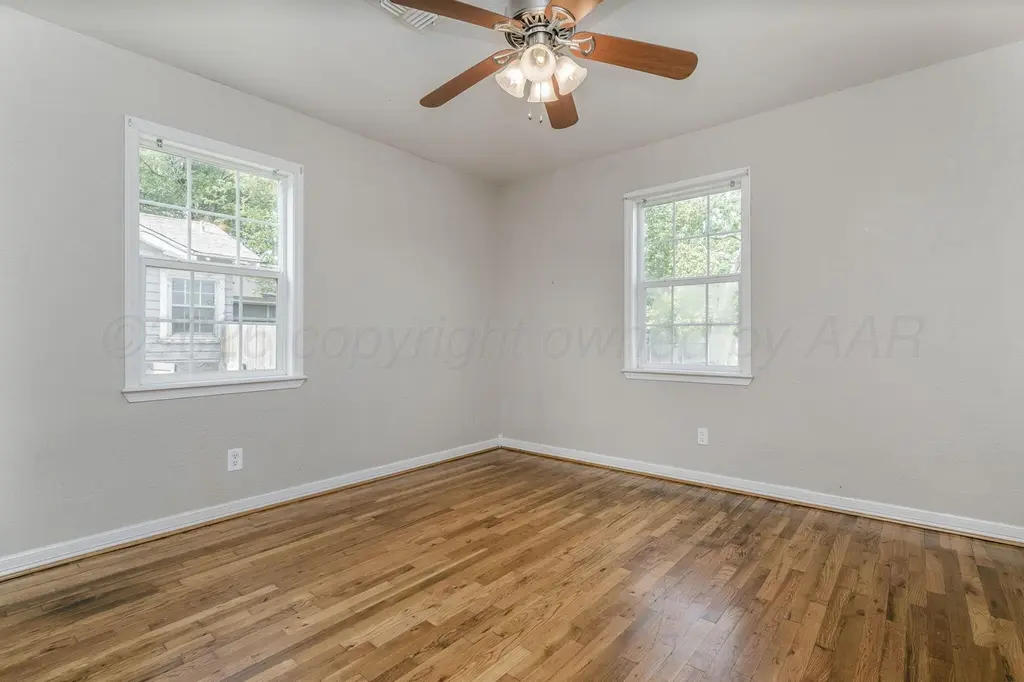
Investor special!!! Needs finishing work. Cute 2 bedroom 1 bath home. Garage has been turned into a large utility room. good size living/dining combo, with nice hardwood floors in entry and dining. Glassed in front porch and some newer windows. Storage out back
Key facts
- Built 1950
- Listed 3 days
Property features AI
Exterior
- Utilities: Public water; Public sewer
- Home design: Single-family residence; One level
- Construction: Wood siding; Pillar/Post/Pier foundation
- Exterior features: Zoned 0200 - SW Amarillo in city limits
Interior
- Kitchen: Oven; Range; Refrigerator; Dishwasher not listed
- Bathrooms: 1 full bathroom; 1 half bathroom
- Heating & cooling: Central air conditioning; Natural gas heating
- Interior features: Washer/Dryer included; Oven; Range; Refrigerator
- Laundry & utility: Washer and dryer
Neighborhood map
What this means for you Summary
Snapshot
- This is a 3-bed/1.0-bath single-family listed at $165k.
Deal economics
- At list price, monthly cash flow is $13 ($161/yr) — positive.
- The deal already cash-flows at list — no discount required.
- To meet the 1% rule (rent ≥ 1% of price), the offer needs to be $149k (9.7% below list).
- Recommended offer: $149k (9.7% below list) — sets the bar for 1% rule.
Location & tenants
- Location reads 66/100 on livability (#624 in TX) — a middle-class / working-renter tenant base. Strengths: cost of living A+, housing A+; Watch: amenities C-, crime F, commute F.
- Amarillo ISD (urban): math 44% / reading 41% proficiency, ranked #336 of 826 in TX (top 41%) — families likely to look elsewhere, expect single-tenant / working-renter base with shorter leases.
- Zoned schools: Bivins El (math 49% / reading 48%, grade D, #950 of 4,322 statewide, top 22%, 439 students, 76% FRL); Austin Middle (math 47% / reading 43%, grade D, #479 of 1,662 statewide, top 29%, 677 students, 63% FRL); Tascosa H S (math 36% / reading 45%, grade F, #798 of 1,632 statewide, top 49%, 2,187 students, 57% FRL).
- Market conditions: Rents rising fast (+5.2%/yr); 157 active listings in the ZIP; 23 comparable units currently listed for rent nearby; rentals at typical pace (median 23d on market — plan ~3-4 weeks tenant-placement turnaround); 1,214 units permitted in Potter County in 2024 (650 in 5+ unit buildings).
Forward outlook
- Local home prices are declining (-3.0%/yr); year-one equity from $1k of loan paydown is wiped out by about $5k of value loss. Plan a longer hold.
Negotiation context
- Only 3 days on market — expect competitive offers; lowballing is unlikely to land.
- 2 sale attempts since 13y ago with the ask held roughly flat each time — persistent listings suggest the price (not the market) is what's stuck; bring a comps-based counter.
Risks & watch-outs
- Watch-outs: built in 1950 — expect roof / HVAC / electrical / plumbing capex.
Questions for the listing agent
- Built in 1950 — when were the roof, HVAC, electrical panel, plumbing, and water heater last replaced?
- Is there a deadline driving the sale (1031 exchange, divorce, estate, relocation)? That informs how much negotiation room exists.
- Schools are D-rated, which usually means shorter tenancies and higher turnover. Who's the typical renter profile here, and what's been the actual vacancy rate?
- Crime grade is F in this area — have there been break-ins, vandalism, or insurance claims at this property in the last 3 years? What carrier currently insures it and at what premium?
- The area grade is low — what's the realistic commute time and amenity access for the typical tenant pool here? Any planned neighborhood developments (good or bad) we should know about?
- What's the average days-on-market for RENTAL listings here right now (not sales)? A rising rental-DOM trend means longer vacancies and softer asking-rent achievability than the comps imply.
- What's the recent tenant-quality profile in this submarket — average credit score on applications, eviction rate, late-payment / NSF rate, and stable-employment percentage? A property-management company in the area should have these aggregated.
- How much new for-sale + rental construction is in the pipeline within 1–3 miles? Heavy new supply typically softens prices + rents 12–24 months out; constrained supply supports both.
Investment metrics
- 1% rule
- 0.90% ✗
- Cap rate
- 6.39%
- Cash-on-cash
- 0.35%
- DSCR
- 1.02
- GRM
- 9.2
CMA / ARV
No comps found within radius.
Projected returns pro-forma
-3.0% appreciation · 5.24% rent growth · sell at horizon
- IRR
- -13.2%
- Equity multiple
- 0.51×
- Total profit
- $-22,415
- Equity at exit
- $24,602
- IRR
- -1.0%
- Equity multiple
- 0.92×
- Total profit
- $-3,521
- Equity at exit
- $14,266
Cash invested: $46,200 (down + closing). Projections, not guarantees.
Landlord ↔ Tenant lean methodology
- Overall (STATE)
- 87 Strongly Landlord-Friendly
- State Texas
- 87 Strongly Landlord-Friendly · R+5
- County
- — inherits STATE
- City
- — inherits STATE
ZIP-level market 79109
- Rents YoY
- 5.2%
- Active inventory
- 157
- Price-to-rent
- 9.2×
Monthly cashflow live
- Estimated rent
- $1,490 high interval (Pro) →
- Mortgage (P&I)
- −$865
- Tax from tax record
- −$230 /mo · $2,757/yr
- Insurance
- −$69
- HOA
- −$0
- Vacancy / Maint / Mgmt
- −$313
- Net cashflow
- $13
Break-even live
Sensitivity live
| Price | -10% $107 | -5% $60 | +0% $13 | +5% $-33 | +10% $-80 |
|---|---|---|---|---|---|
| Rent | -10% $-104 | -5% $-45 | +0% $13 | +5% $72 | +10% $131 |
| Rate | -1.0pp $96 | -0.5pp $55 | base $13 | +0.5pp $-29 | +1.0pp $-73 |
UW: 25.0% down · 7.5% · 30yr · 1.5% tax · 5.0% vac · 8.0% maint · 8.0% mgmt
Financing live
Cash to close
- Down payment
- $41,250
- Closing costs
- $4,950
- Reserves months
- —
- Total cash needed
- —
Loan-product check · same deal, 3 products live
Conventional
25% down · 7.5% · 30yr
- Down + closing
- —
- Monthly P&I
- —
- Monthly cashflow
- —
- DSCR
- —
- Eligible?
- —
Personal DTI + credit; lowest rate.
DSCR
20% down · 8.5% · 30yr
- Down + closing
- —
- Monthly P&I
- —
- Monthly cashflow
- —
- DSCR
- —
- Eligible?
- —
No personal income docs; deal must DSCR.
Hard money
10% down · 12.0% · 12mo
- Down + closing
- —
- Monthly P&I
- —
- Monthly cashflow
- —
- DSCR
- —
- Eligible?
- —
Short-term bridge; refi at stabilization.
Rent comps 23 comps
| Address | Beds | Baths | Sqft | Rent | $/sqft | DOM | Units | Dist |
|---|---|---|---|---|---|---|---|---|
| 2030 Crockett St Amarillo, TX | 3.0 | 1.5 | 1307 | $1,750 | $1.34 | 15d | 1 | 0.28mi |
| 2104 S Travis St Amarillo, TX | 3.0 | 1.0 | 1236 | $1,700 | $1.38 | 23d | 1 | 0.33mi |
| 2103 Parker St Amarillo, TX | 3.0 | 2.0 | 1306 | $2,300 | $1.76 | 23d | 1 | 0.40mi |
| 3118 SW 15th Ave Amarillo, TX | 2.0–3.0 | 1.0–2.0 | 1015 | $900 | $0.89 | 15d | 17 | 0.76mi |
| 913 S Rusk St Amarillo, TX | 3.0 | 2.0 | 1450 | $1,450 | $1.00 | 15d | 1 | 0.87mi |
| 3003 SW 27th Ave Amarillo, TX | 2.0 | 1.5 | 808 | $895 | $1.11 | 15d | 1 | 0.92mi |
| 3005 SW 28th Ave Unit C Amarillo, TX | 3.0 | 2.0 | 1480 | $1,700 | $1.15 | 15d | 1 | 0.96mi |
| 3110 SW 27th Ave Amarillo, TX | 3.0 | 2.0 | 1470 | $1,482 | $1.01 | 23d | 1 | 1.00mi |
| 3110 SW 27th Ave Amarillo, TX | 1.0–3.0 | 1.0–2.0 | 1085 | $1,482 | $1.37 | 15d | 3 | 1.00mi |
| 3019 W 28th Ave Amarillo, TX | 1.0–2.0 | 1.0–2.0 | 795 | $775 | $0.97 | 45d | 1 | 1.00mi |
| 3001 Curtis Dr Unit A Amarillo, TX | 2.0 | 1.0 | 713 | $1,100 | $1.54 | 23d | 1 | 1.01mi |
| 3007 Curtis Dr Unit B Amarillo, TX | 2.0 | 1.0 | 750 | $950 | $1.27 | 45d | 1 | 1.04mi |
| 2601 Linda Cir Amarillo, TX | 1.0–2.0 | 1.0 | 650 | $1,045 | $1.61 | 45d | 1 | 1.04mi |
| 1008 S Mississippi St Amarillo, TX | 3.0 | 2.0 | 1061 | $1,275 | $1.20 | 23d | 1 | 1.05mi |
| 2306 SW 8th Ave Unit 2 Amarillo, TX | 2.0 | 1.0 | 700 | $950 | $1.36 | 45d | 1 | 1.08mi |
| 802 S Kentucky St Amarillo, TX | 2.0 | 1.0 | 970 | $899 | $0.93 | 45d | 1 | 1.16mi |
| 705 S Florida St Amarillo, TX | 2.0 | 1.0 | 1014 | $850 | $0.84 | 23d | 1 | 1.17mi |
| 701 Sunset Ter Amarillo, TX | 3.0 | 1.0 | 1444 | $1,350 | $0.93 | 45d | 1 | 1.22mi |
| 701 Sunset Ter Amarillo, TX | 3.0 | 1.0 | 1444 | $1,350 | $0.93 | 23d | 1 | 1.23mi |
| 3500 Mockingbird Ln Amarillo, TX | 1.0–3.0 | 1.0–2.0 | 834 | $1,095 | $1.31 | 23d | 1 | 1.29mi |
| 1809 Chama St Amarillo, TX | 3.0 | 1.0 | 1396 | $1,600 | $1.15 | 45d | 1 | 1.30mi |
| 3205 S Tyler St Amarillo, TX | 3.0 | 1.0 | 1381 | $1,475 | $1.07 | 15d | 1 | 1.41mi |
| 3703 S Monroe St Amarillo, TX | 2.0 | 1.0 | 750 | $1,100 | $1.47 | 23d | 1 | 1.49mi |
Listing history 3 events
-
2026-06-21days on market $165,000 Active 3 DOM
-
2026-06-18remarks 265-char remark
-
2026-06-18$165,000 Active 1 DOM
ⓘ Source: listings_history table (triggers on properties + properties_extension) + one-shot
backfill from property_details.listing_events for pre-trigger history.
Tax reassessment forecast TX · Resets to sale price
- Current annual tax
- $2,757 · $230/mo
- Projected year-2 tax
- $3,020 · $252/mo
- Expected delta
- +$263/yr (+$22/mo · 9.5%)
ⓘ Screening estimate from a state-policy table — verify with the county assessor before closing.
Climate risk First Street
- Flood 1/10 Low FEMA zone X (unshaded) · 0% chance over 30 yrs
- Wildfire 1/10 Low
- Heat 4/10 Moderate 7 d/yr ≥97°F today · 20 d/yr by 30 yrs out
- Wind 2/10 Low
- Air quality 2/10 Low 1 unhealthy d/yr today · 1 by 30 yrs out
Nearby sold comps map
Loading sold comps map…
Walkable amenities ~0.75 mi
Loading nearby amenities…
Taxation est. · year 1
- Rental income
- $17,881
- − Mortgage interest
- −$9,243
- − Property taxes
- −$2,757
- − Insurance
- −$825
- − Repairs & maintenance
- −$1,430
- − Management
- −$1,430
- − Depreciation
- −$4,800
- Taxable loss
- −$2,605
- Est. tax savings @ 24.0%
- +$625
- After-tax cash flow
- $786/yr
For passive investors: Depreciation is non-cash, so a rental often shows a tax loss while cash-flowing — sheltering income. Rental losses are passive: they offset passive income freely, and up to $25,000/yr can offset ordinary (W-2) income if you actively participate and your MAGI is under $100k (phasing out to $0 by $150k); unused losses carry forward. On sale, claimed depreciation is recaptured at up to 25%, and gains may owe capital-gains tax (a 1031 exchange can defer both). Figures are a year-1 estimate at your 24.0% rate — not tax advice; consult a CPA.
Schools (NCES district)
- District
- Amarillo ISD
- NCES district ID
- 4808130
- Math proficiency
- 44% ▼ -9.00%
- Reading proficiency
- 41% ▼ -3.00%
- Median HH income
- $43,478
- Composite
- 35.96/100
- National rank
- #4798
- State rank
- #336 of 826 in TX
Livability — Amarillo
- Score
- 66/100
- State rank
- #624
- US rank
- #11876
Category grades
Schools grade is shown separately in the Schools card above.
Census & demographics
- Census place
- Amarillo, TX
- County
- Randall County · 137,351 people
- City population
- 185,802
- Metro
- Amarillo, TX
- Population (ZIP)
- 43,578
- Household income
- $70,435
- Rent vs Own
- Severe rent burden
- 1640.0
Population outlook (Potter County) Hauer SSP2
- Today (2025)
- 121,296 people
- By 2030
- 120,883 · -0.3%
- By 2040
- 119,668 · -1.3%
- By 2050
- 117,788 · -2.9%
- By 2075
- 110,250 · -9.1%
- By 2100
- 92,923 · -23.4%
Race, ethnicity, and origin ACS 2023
- Neighborhood character
- Predominantly White (70%)
- Race & ethnicity
- White 70% Hispanic / Latino 19% Two or more races 12% Black 5%
- Hispanic origin (detail)
- Mexican 16%
- Common ancestry
- Italian 3% Slovak 2% Lithuanian 2%
- Foreign-born
- 4% · Canada
- Languages at home
- 89% English-only · Spanish 9% Other Indo-European 1%
Political lean MEDSL · Potter
- 2024 margin
- Solid R (+44.4) · D 27.3% · R 71.7% · Other 1.1%
- 2008→2024 swing
- -5.0pp toward R · 2008: -39.4pp · 2024: -44.4pp
- All cycles
- 2024: R+44.4 2020: R+38.7 2016: R+41.9 2012: R+44.6 2008: R+39.4
Not yet ingested
- Civics
- —
Market trends
- HPI YoY
- ▼ -227.95%
- Current HPI
- 171.6795
- Rent YoY
- ▲ 5.24%
- Metro
- Amarillo, TX
- State GDP YoY
- ▲ 3.95%
- F500 in state
- 110
Industry mix (Fortune 500 HQ in TX)
| Industry | F500 HQs | Revenue |
|---|---|---|
| Energy | 16 | $1,198B |
|
||
| Technology | 5 | $198B |
|
||
| Engineering / Construction | 4 | $72B |
|
||
| Energy Services | 3 | $60B |
|
||
| Utilities | 3 | $41B |
|
||
| Healthcare | 2 | $330B |
|
||
Price history
+302.4% since first listed5 events — show timeline
- 2026-06-16 Listed $165,000 AARMLS
- 2022-08-22 Sold (Public Records) — Public Records
- 2019-03-29 Sold (Public Records) — Public Records
- 2014-01-09 Sold (MLS) — AARMLS
- 2013-11-08 Listed $41,000 AARMLS
Property tax history
+6.9%/yrLatest (2025): $2,757 · +9.3% YoY. Source: county tax records.
Cash-flow waterfall
monthlySold comps — $/sqft
last 12 mo · ≤1 miLoading sold comps…