27298 Grey Fox Run · Tomball, TX
Flood risk 8/10 · Major
- FEMA flood zone
- X (unshaded)
- Chance of flooding over 30 yrs
- 0.99%
- Est. flood insurance / yr
- $507 – $1,088
Fire risk 4/10 · Minor
- Est. fire insurance / yr
- $1,222 – $2,270
Heat risk 8/10 · Major
- Hot days now (above 111°F)
- 7 days/yr
- Hot days in 30 yrs
- 22 days/yr
Wind risk 8/10 · Major
- Chance of severe wind over 30 yrs
- 99.0%
Air-quality risk 2/10 · Minimal
- Unhealthy air days now
- 2 days/yr
- Unhealthy air days in 30 yrs
- 2 days/yr
Risk factors via First Street. Map © Google.
Why this score? — see what drove the D grade
The composite is a weighted blend of 9 inputs, each scored 0–100. Each bar is that input's sub-score; the figure is the points it added to the 100-point composite (weight × sub-score).
- ARV discount +10.0/15.0
- Appreciation +10.0/10.0
- Cash flow +5.9/30.0
- Schools +3.9/10.0
- Livability +3.8/5.0
- 1% rule +2.7/10.0
- Rent growth +2.6/5.0
- Condition / age +2.5/5.0
- DSCR +0.2/10.0
$265,000
🖨 Deal sheet (PDF) 📄 Offer letter ✓ Due diligence
Listing remarks MLS
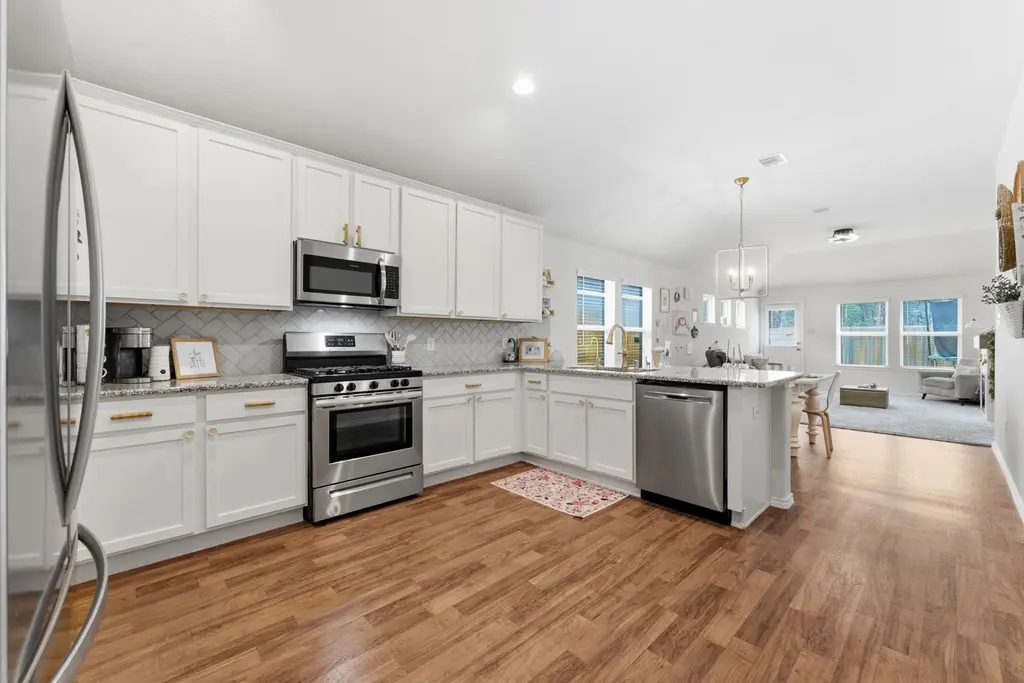
BETTER THAN NEW with no back neighbors!! Charming design at every turn, featuring an upgraded kitchen with granite countertops, stainless steel appliances, herringbone backsplash and wood-look flooring. Living room has plenty of natural light with a beautiful view of the trees. Primary suite impresses with vaulted ceilings and a spacious ensuite, while secondary bedrooms bring fun and function. Pocket office makes working from home a reality, and the spacious back yard is great for playing. Even the laundry is handled - washer and dryer are included! Enjoy a reverse osmosis at the sink and a whole-home water softener already in place. Recently built and immaculately cared for, this is a step above new construction. It's move-in ready, upgraded, and in a great location close to Highway 249, Tomball, and The Woodlands. Just minutes from shopping, dining and entertainment, as well as beautiful parks and walking trails. Enjoy tranquil living with convenient amenities!
Key facts
- Wood-look flooring
- Pocket office
- Natural light
Tags
Neighborhood map
What this means for you Summary
Snapshot
- This is a 3-bed/2.0-bath single-family listed at $265k.
Deal economics
- At list price, monthly cash flow is $-588 ($-7k/yr) — negative.
- To cash-flow at today's rent, offer at most $161k (39.2% below list).
- To meet the 1% rule (rent ≥ 1% of price), the offer needs to be $205k (22.7% below list).
- Recommended offer: $161k (39.2% below list) — sets the bar for cash-flow.
- Cap rate 3.9% vs local median 2.7% in Tomball — top-decile yield for the area; either an underpriced asset or a hidden risk that comps aren't pricing in. Stress-test before assuming the spread holds.
Location & tenants
- Location reads 75/100 on livability (#155 in TX, #4,239 nationally) — a middle-class / working-renter tenant base. Strengths: cost of living A+, housing A+, health & safety B+; Watch: amenities F, commute F.
- Magnolia ISD (rural): math 42% / reading 45% proficiency, ranked #247 of 826 in TX (top 30%) — families likely to look elsewhere, expect single-tenant / working-renter base with shorter leases.
- Zoned schools: Cedric C Smith (math 48% / reading 42%, grade D-, #1,133 of 4,322 statewide, top 27%, 724 students, 55% FRL); Bear Branch J H (math 44% / reading 46%, grade D, #479 of 1,662 statewide, top 29%, 1,076 students, 37% FRL); Magnolia H S (math 47% / reading 62%, grade C-, #379 of 1,632 statewide, top 26%, 2,248 students, 31% FRL) — zoned schools at 41% FRL track the district average.
- Market conditions: Rents flat; 1622 active listings in the ZIP; 2 comparable units currently listed for rent nearby; high-income renter base; 13,259 units permitted in Montgomery County in 2024 (1,402 in 5+ unit buildings).
Forward outlook
- In year one you build about $28k of equity ($2k loan paydown + $26k appreciation (10.0% local appreciation)).
- Montgomery County population projected at +65% by 2050 — long-run rental-demand tailwind backs the buy-and-hold thesis.
- By year 2, paydown + projected appreciation supports a ~$46k cash-out refi (75% LTV) — recoverable capital for the next deal without selling this one.
Negotiation context
- It's been on market 114 days — a 9% lower offer ($241k) is reasonable based on typical stale-listing flexibility.
Risks & watch-outs
- Watch-outs: property tax is 2.7% of price; flood insurance adds $66/mo.
- Climate carrying-cost: severe flood risk; severe wind risk, 99% chance of damaging wind over 30y; extreme-heat days projected 7→22/yr by 2055 (HVAC capex compounding) — expect insurance premiums to compound above CPI over the hold.
Questions for the listing agent
- What do current leases actually rent for vs. the listed asking? Can we see a recent rent roll and the last 12 months of T-12 income?
- It's been on market 114 days. Have you received any prior offers? Is the seller open to a 39% concession, seller financing, or rate buy-down credit?
- Property tax is high relative to price — has the assessment been appealed recently, and will the sale trigger a re-assessment?
- What's the actual annual flood-insurance premium (NFIP or private), and is the property in a SFHA with mandatory coverage?
- What does the HOA fee cover, when was the last increase, and are there any pending special assessments or reserve-fund shortfalls?
- Why hasn't it sold? Are there any deal-killer items the seller is aware of (foundation, flood, title, zoning, code violations)?
- Is there a deadline driving the sale (1031 exchange, divorce, estate, relocation)? That informs how much negotiation room exists.
- Schools are B-rated — typically a magnet for longer-tenancy family renters. What's the average tenant stay here, and is there a school-zone premium baked into asking?
- The area grade is low — what's the realistic commute time and amenity access for the typical tenant pool here? Any planned neighborhood developments (good or bad) we should know about?
- What's the average days-on-market for RENTAL listings here right now (not sales)? A rising rental-DOM trend means longer vacancies and softer asking-rent achievability than the comps imply.
- What's the recent tenant-quality profile in this submarket — average credit score on applications, eviction rate, late-payment / NSF rate, and stable-employment percentage? A property-management company in the area should have these aggregated.
- How much new for-sale + rental construction is in the pipeline within 1–3 miles? Heavy new supply typically softens prices + rents 12–24 months out; constrained supply supports both.
Investment metrics
- 1% rule
- 0.77% ✗
- Cap rate
- 3.93%
- Cash-on-cash
- -8.43%
- DSCR
- 0.62
- GRM
- 10.8
CMA / ARV
- ARV (median comp)
- $280,651
- List price
- $265,000
- Delta
- -5.58%
- Verdict
- FAIR
- Comps
- 20 within 1.0 mi
Show comp detail 12 sales within ~0.75 mi
| Address | Dist | Beds/Ba | Sqft | Sold | Price | $/sf | Match |
|---|---|---|---|---|---|---|---|
| 27219 Mockingbird Terrace Ln | 0.15mi | 3/2.0 | 1,640 (+2%) | 6mo | $279,725 | $171 | 85 |
| 10033 Swift Fox Ct | 0.16mi | 3/2.0 | 1,693 (+5%) | 3mo | $274,900 | $162 | 82 |
| 10010 Cottontail Ct | 0.16mi | 3/2.0 | 1,538 (-4%) | 5mo | $239,990 | $156 | 81 |
| 10288 Badger Run Ln | 0.28mi | 3/2.5 | 1,597 (-1%) | 5mo | $256,724 | $161 | 79 |
| 10249 Badger Run Ln | 0.23mi | 3/2.0 | 1,566 (-3%) | 7mo | $266,475 | $170 | 79 |
| 27394 Axis Deer Trl | 0.19mi | 3/2.0 | 1,689 (+5%) | 6mo | $262,542 | $155 | 78 |
| 10260 Badger Run Ln | 0.26mi | 4/2.0 (+1) | 1,689 (+5%) | 4mo | $281,125 | $166 | 71 |
| 10272 Badger Run Ln | 0.28mi | 3/2.0 | 1,427 (-11%) | 3mo | $280,260 | $196 | 66 |
| 10228 Badger Run Ln | 0.21mi | 3/2.0 | 1,427 (-11%) | 7mo | $249,662 | $175 | 66 |
| 27076 Badger Way | 0.36mi | 3/2.0 | 1,490 (-8%) | 7mo | $249,243 | $167 | 65 |
| 9315 Central Pl | 0.65mi | 3/2.0 | 1,602 (-0%) | 5mo | $265,000 | $165 | 65 |
| 25062 Lindsey Ln | 0.60mi | 3/2.0 | 1,717 (+7%) | 2mo | $300,400 | $175 | 59 |
Match score weights: distance 35% · size 25% · config 20% · recency 20%. Top-matched comps best support the ARV.
Projected returns pro-forma
10.0% appreciation · 0.32% rent growth · sell at horizon
- IRR
- 16.8%
- Equity multiple
- 2.37×
- Total profit
- $101,770
- Equity at exit
- $238,733
- IRR
- 15.5%
- Equity multiple
- 5.31×
- Total profit
- $319,888
- Equity at exit
- $514,837
Cash invested: $74,200 (down + closing). Projections, not guarantees.
Landlord ↔ Tenant lean methodology
- Overall (STATE)
- 87 Strongly Landlord-Friendly
- State Texas
- 87 Strongly Landlord-Friendly · R+5
- County
- — inherits STATE
- City
- — inherits STATE
ZIP-level market 77354
- Home prices YoY
- 2.4%
- Rents YoY
- 0.3%
- Active inventory
- 1622
- Price-to-rent
- 10.8×
Monthly cashflow live
- Estimated rent
- $2,049 medium interval (Pro) →
- Mortgage (P&I)
- −$1,390
- Tax from tax record
- −$602 /mo · $7,225/yr
- Insurance
- −$110
- Flood insurance flood zone
- −$66 /mo · $798/yr
- HOA
- −$38
- Vacancy / Maint / Mgmt
- −$430
- Net cashflow
- $-588
Break-even live
Sensitivity live
| Price | -10% $-438 | -5% $-513 | +0% $-588 | +5% $-663 | +10% $-738 |
|---|---|---|---|---|---|
| Rent | -10% $-750 | -5% $-669 | +0% $-588 | +5% $-507 | +10% $-426 |
| Rate | -1.0pp $-454 | -0.5pp $-520 | base $-588 | +0.5pp $-656 | +1.0pp $-726 |
UW: 25.0% down · 7.5% · 30yr · 1.5% tax · 5.0% vac · 8.0% maint · 8.0% mgmt
Financing live
Cash to close
- Down payment
- $66,250
- Closing costs
- $7,950
- Reserves months
- —
- Total cash needed
- —
Loan-product check · same deal, 3 products live
Conventional
25% down · 7.5% · 30yr
- Down + closing
- —
- Monthly P&I
- —
- Monthly cashflow
- —
- DSCR
- —
- Eligible?
- —
Personal DTI + credit; lowest rate.
DSCR
20% down · 8.5% · 30yr
- Down + closing
- —
- Monthly P&I
- —
- Monthly cashflow
- —
- DSCR
- —
- Eligible?
- —
No personal income docs; deal must DSCR.
Hard money
10% down · 12.0% · 12mo
- Down + closing
- —
- Monthly P&I
- —
- Monthly cashflow
- —
- DSCR
- —
- Eligible?
- —
Short-term bridge; refi at stabilization.
Rent comps 2 comps
| Address | Beds | Baths | Sqft | Rent | $/sqft | DOM | Units | Dist |
|---|---|---|---|---|---|---|---|---|
| 9733 Grosbeak Ln Magnolia, TX | 3.0 | 2.0 | 1302 | $1,798 | $1.38 | 45d | 1 | 0.42mi |
| 9829 Glen Brook Ln Magnolia, TX | 4.0 | 2.0 | 1637 | $1,999 | $1.22 | 4d | 1 | 0.45mi |
HOA detail
- Monthly dues
- $38 · $456/yr
- Likely covers
- water
Listing history 15 events
-
2026-06-21days on market $265,000 Active 114 DOM
-
2026-06-18days on market $265,000 Active 111 DOM
-
2026-06-17days on market $265,000 Active 110 DOM
-
2026-06-16days on market $265,000 Active 109 DOM
-
2026-06-15days on market $265,000 Active 108 DOM
-
2026-06-13days on market $265,000 Active 106 DOM
-
2026-06-09days on market $265,000 Active 102 DOM
-
2026-06-08days on market $265,000 Active 101 DOM
-
2026-06-07days on market $265,000 Active 100 DOM
-
2026-06-04days on market $265,000 Active 97 DOM
-
2026-06-03days on market $265,000 Active 96 DOM
-
2026-06-02days on market $265,000 Active 95 DOM
-
2026-06-01days on market $265,000 Active 94 DOM
-
2026-05-31days on market $265,000 Active 93 DOM
-
2026-02-27$265,000 Active 978-char remark
Show marketing remark (978 chars)
BETTER THAN NEW with no back neighbors!! Charming design at every turn, featuring an upgraded kitchen with granite countertops, stainless steel appliances, herringbone backsplash and wood-look flooring. Living room has plenty of natural light with a beautiful view of the trees. Primary suite impresses with vaulted ceilings and a spacious ensuite, while secondary bedrooms bring fun and function. Pocket office makes working from home a reality, and the spacious back yard is great for playing. Even the laundry is handled - washer and dryer are included! Enjoy a reverse osmosis at the sink and a whole-home water softener already in place. Recently built and immaculately cared for, this is a step above new construction. It's move-in ready, upgraded, and in a great location close to Highway 249, Tomball, and The Woodlands. Just minutes from shopping, dining and entertainment, as well as beautiful parks and walking trails. Enjoy tranquil living with convenient amenities!
ⓘ Source: listings_history table (triggers on properties + properties_extension) + one-shot
backfill from property_details.listing_events for pre-trigger history.
Tax reassessment forecast TX · Resets to sale price
- Current annual tax
- $7,225 · $602/mo
- Projected year-2 tax
- $7,225 · $602/mo
- Expected delta
- $0/yr ($0/mo · 0.0%)
ⓘ Screening estimate from a state-policy table — verify with the county assessor before closing.
Climate risk First Street
- Flood 8/10 Severe FEMA zone X (unshaded) · 99% chance over 30 yrs
- Wildfire 4/10 Moderate
- Heat 8/10 Severe 7 d/yr ≥111°F today · 22 d/yr by 30 yrs out
- Wind 8/10 Severe 99% chance of damaging wind over 30 yrs
- Air quality 2/10 Low 2 unhealthy d/yr today · 2 by 30 yrs out
Nearby sold comps map
Loading sold comps map…
Walkable amenities ~0.75 mi
Loading nearby amenities…
Taxation est. · year 1
- Rental income
- $24,590
- − Mortgage interest
- −$14,844
- − Property taxes
- −$7,225
- − Insurance
- −$2,122
- − Repairs & maintenance
- −$1,967
- − Management
- −$1,967
- − HOA
- −$456
- − Depreciation
- −$7,709
- Taxable loss
- −$11,701
- Est. tax savings @ 24.0%
- +$2,808
- After-tax cash flow
- $-4,245/yr
For passive investors: Depreciation is non-cash, so a rental often shows a tax loss while cash-flowing — sheltering income. Rental losses are passive: they offset passive income freely, and up to $25,000/yr can offset ordinary (W-2) income if you actively participate and your MAGI is under $100k (phasing out to $0 by $150k); unused losses carry forward. On sale, claimed depreciation is recaptured at up to 25%, and gains may owe capital-gains tax (a 1031 exchange can defer both). Figures are a year-1 estimate at your 24.0% rate — not tax advice; consult a CPA.
Schools (NCES district)
- District
- Magnolia ISD
- NCES district ID
- 4828740
- Math proficiency
- 42% ▼ -7.00%
- Reading proficiency
- 45% ▼ -4.00%
- Median HH income
- $71,692
- Composite
- 39.46/100
- National rank
- #3958
- State rank
- #247 of 826 in TX
Livability — Tomball
- Score
- 75/100
- State rank
- #155
- US rank
- #4239
Category grades
Schools grade is shown separately in the Schools card above.
Census & demographics
- County
- Montgomery County · 663,713 people
- City population
- 32,847
- Metro
- Houston-The Woodlands-Sugar Land, TX
- Population (ZIP)
- 44,900
- Household income
- $112,504
- Rent vs Own
- Severe rent burden
- 586.0
Population outlook (Montgomery County) Hauer SSP2
- Today (2025)
- 713,896 people
- By 2030
- 805,263 · +12.8%
- By 2040
- 992,708 · +39.1%
- By 2050
- 1,179,590 · +65.2%
- By 2075
- 1,628,084 · +128.1%
- By 2100
- 1,937,880 · +171.5%
Race, ethnicity, and origin ACS 2023
- Neighborhood character
- Predominantly White (66%)
- Race & ethnicity
- White 66% Hispanic / Latino 25% Two or more races 18% Black 3% Asian 1%
- Hispanic origin (detail)
- Mexican 14% Puerto Rican 1%
- Common ancestry
- Lithuanian 4% Slovak 2% Italian 2%
- Foreign-born
- 11% · Canada, Vietnam
- Languages at home
- 83% English-only · Spanish 15% Other Indo-European 1% German/W. Germanic 1%
Political lean MEDSL · Montgomery
- 2024 margin
- Solid R (+45.5) · D 26.8% · R 72.3%
- 2008→2024 swing
- +7.2pp toward D · 2008: -52.7pp · 2024: -45.5pp
- All cycles
- 2024: R+45.5 2020: R+43.8 2016: R+51.4 2012: R+60.7 2008: R+52.7
Not yet ingested
- Civics
- —
Market trends
- HPI YoY
- ▲ 12.09%
- Current HPI
- 512.87
- Rent YoY
- ▲ 0.32%
- Metro
- Houston-The Woodlands-Sugar Land, TX
- State GDP YoY
- ▲ 3.95%
- F500 in state
- 110
Industry mix (Fortune 500 HQ in TX)
| Industry | F500 HQs | Revenue |
|---|---|---|
| Energy | 16 | $1,198B |
|
||
| Technology | 5 | $198B |
|
||
| Engineering / Construction | 4 | $72B |
|
||
| Energy Services | 3 | $60B |
|
||
| Utilities | 3 | $41B |
|
||
| Healthcare | 2 | $330B |
|
||
Price history
1 event — show timeline
- 2026-02-27 Listed $265,000 HARMLS
Property tax history
+180.9%/yrLatest (2025): $7,225 · +1.6% YoY. Source: county tax records.
Cash-flow waterfall
monthlySold comps — $/sqft
last 12 mo · ≤1 miLoading sold comps…