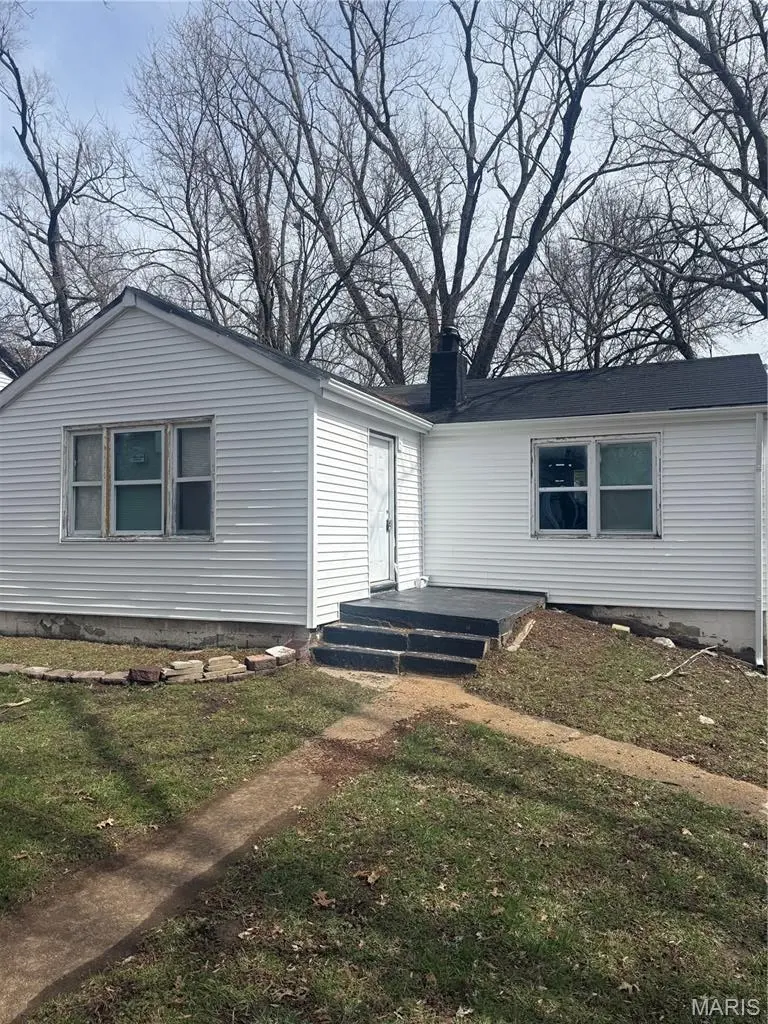
10112 Lord Dr · Castle Point, MO
Flood risk 1/10 · Minimal
- FEMA flood zone
- X (unshaded)
- Chance of flooding over 30 yrs
- 0.0%
- Est. flood insurance / yr
- $473 – $860
Fire risk 1/10 · Minimal
- Est. fire insurance / yr
- $1,054 – $1,958
Heat risk 5/10 · Moderate
- Hot days now (above 107°F)
- 7 days/yr
- Hot days in 30 yrs
- 21 days/yr
Wind risk 2/10 · Minimal
- Chance of severe wind over 30 yrs
- 1.0%
Air-quality risk 4/10 · Minor
- Unhealthy air days now
- 4 days/yr
- Unhealthy air days in 30 yrs
- 5 days/yr
Risk factors via First Street. Map © Google.
Why this score? — see what drove the B grade
The composite is a weighted blend of 9 inputs, each scored 0–100. Each bar is that input's sub-score; the figure is the points it added to the 100-point composite (weight × sub-score).
- Cash flow +30.0/30.0
- 1% rule +10.0/10.0
- DSCR +10.0/10.0
- ARV discount +7.5/15.0
- Appreciation +6.9/10.0
- Rent growth +3.7/5.0
- Livability +3.2/5.0
- Condition / age +2.5/5.0
- Schools +0.4/10.0
$30,000
🖨 Deal sheet 📄 Offer letter ✓ Due diligence
Listing remarks
Great opportunity for an owner-occupant or investor! This 1-bedroom, 1-bath home offers plenty of potential and could easily be converted into a 2-bedroom property. Renovation work has already been started, providing the new owner with a blank canvas to finish the project to their liking. The basement offers additional space and possibilities for storage or future improvements. Bring your vision and build instant equity in this value-add opportunity!
Key facts
- Storage
- Basement
- Additional space
Tags
Property features AI
Exterior
- Utilities: Public water; Public sewer; Electric service by Ameren
- Home design: Single-family residence; One level
- Construction: Aluminum siding
- Exterior features: Front yard
Interior
- Bedrooms: 1 bedroom on the main level
- Bathrooms: 1 full bathroom on the main level
- Heating & cooling: No heating; No cooling
- Interior features: Unfinished concrete basement
Neighborhood map
What this means for you Summary
Snapshot
- This is a 1-bed/1.0-bath single-family listed at $30k.
Deal economics
- At list price, monthly cash flow is $564 ($7k/yr) — positive.
- The deal already cash-flows at list — no discount required.
- Meets the 1% rule at list price ($995 rent vs $30k).
- Cap rate 28.9% vs local median 13.0% in Castle Point — top-decile yield for the area; either an underpriced asset or a hidden risk that comps aren't pricing in. Stress-test before assuming the spread holds.
Location & tenants
- Location reads 64/100 on livability (#313 in MO) — a middle-class / working-renter tenant base. Strengths: cost of living A+, crime B; Watch: amenities F, commute F, employment F.
- Riverview Gardens (suburban): math 2% / reading 9% proficiency, ranked #324 of 324 in MO (top 100%) — low school quality limits family demand, transient renter base, plan for 1-2y turnover; 90% free/reduced lunch — lower-income household profile, screen leases tightly.
- Zoned schools: Lewis And Clark Elem. (math 2% / reading 2%, grade F, #1,099 of 1,115 statewide, top 100%, 145 students, 98% FRL); Riverview Gardens Sr. High (math 2% / reading 18%, grade F, #501 of 521 statewide, top 97%, 1,331 students, 100% FRL).
- Market conditions: Rents rising fast (+5.0%/yr); 372 active listings in the ZIP; lower-income renter base — watch delinquency; 920 units permitted in St. Louis County in 2024 (250 in 5+ unit buildings).
Forward outlook
- In year one you build about $1k of equity ($207 loan paydown + $1k appreciation (3.8% local appreciation)).
- At projected returns (3.8% appreciation + 5.0% rent growth), your $8k cash investment doubles in ~2 years — after that, you're playing with house money.
Negotiation context
- Only 13 days on market — expect competitive offers; lowballing is unlikely to land.
Risks & watch-outs
- Watch-outs: built in 1930 — expect roof / HVAC / electrical / plumbing capex.
- Climate carrying-cost: extreme-heat days projected 7→21/yr by 2055 (HVAC capex compounding) — expect insurance premiums to compound above CPI over the hold.
Questions for the listing agent
- Built in 1930 — when were the roof, HVAC, electrical panel, plumbing, and water heater last replaced?
- Is there a deadline driving the sale (1031 exchange, divorce, estate, relocation)? That informs how much negotiation room exists.
- Schools are F-rated, which usually means shorter tenancies and higher turnover. Who's the typical renter profile here, and what's been the actual vacancy rate?
- What's the average days-on-market for RENTAL listings here right now (not sales)? A rising rental-DOM trend means longer vacancies and softer asking-rent achievability than the comps imply.
- What's the recent tenant-quality profile in this submarket — average credit score on applications, eviction rate, late-payment / NSF rate, and stable-employment percentage? A property-management company in the area should have these aggregated.
- How much new for-sale + rental construction is in the pipeline within 1–3 miles? Heavy new supply typically softens prices + rents 12–24 months out; constrained supply supports both.
Investment metrics
- 1% rule
- 3.32% ✓
- Cap rate
- 28.87%
- Cash-on-cash
- 80.62%
- DSCR
- 4.59
- GRM
- 2.5
CMA / ARV
- ARV (on-the-fly)
- $78,848
- Comps found
- 12
Show comp detail 12 sales within ~0.75 mi
| Address | Dist | Beds/Ba | Sqft | Sold | Price | $/sf | Match |
|---|---|---|---|---|---|---|---|
| 10040 Lord Dr | 0.11mi | 2/1.0 (+1) | 672 (-4%) | 4mo | $10,000 | $15 | 79 |
| 10182 Count Dr | 0.20mi | 2/1.0 (+1) | 702 (-0%) | 17mo | $90,000 | $128 | 71 |
| 10417 Lord Dr | 0.42mi | 2/1.0 (+1) | 702 (-0%) | 11mo | $79,000 | $113 | 66 |
| 10167 Count Dr | 0.16mi | 2/1.0 (+1) | 624 (-11%) | 7mo | $69,900 | $112 | 63 |
| 10353 Lord Dr | 0.34mi | 2/1.0 (+1) | 729 (+4%) | 14mo | $1,113,000 | $1,527 | 61 |
| 10019 Lord Dr | 0.15mi | 2/1.0 (+1) | 795 (+13%) | 7mo | $37,999 | $48 | 60 |
| 10437 Lord Dr | 0.45mi | 2/1.0 (+1) | 702 (-0%) | 17mo | $63,000 | $90 | 59 |
| 10429 Earl Dr | 0.45mi | 2/1.0 (+1) | 770 (+9%) | 1mo | $35,000 | $45 | 58 |
| 10417 Duke Dr | 0.43mi | 2/1.0 (+1) | 770 (+9%) | 7mo | $35,000 | $45 | 53 |
| 10404 Earl Dr | 0.40mi | 2/1.0 (+1) | 770 (+9%) | 16mo | $69,900 | $91 | 48 |
| 10504 Duke Dr | 0.55mi | 2/1.0 (+1) | 770 (+9%) | 9mo | $115,000 | $149 | 46 |
| 10076 Ashbrook Dr NE | 0.73mi | 2/1.0 (+1) | 792 (+12%) | 10mo | $105,000 | $133 | 32 |
Match score weights: distance 35% · size 25% · config 20% · recency 20%. Top-matched comps best support the ARV.
Projected returns pro-forma
3.79% appreciation · 4.97% rent growth · sell at horizon
- IRR
- 87.7%
- Equity multiple
- 6.10×
- Total profit
- $42,864
- Equity at exit
- $14,844
- IRR
- 87.2%
- Equity multiple
- 13.37×
- Total profit
- $103,921
- Equity at exit
- $23,990
Cash invested: $8,400 (down + closing). Projections, not guarantees.
Landlord ↔ Tenant lean methodology
- Overall (STATE)
- 81 Strongly Landlord-Friendly
- State Missouri
- 81 Strongly Landlord-Friendly · R+10
- County
- — inherits STATE
- City
- — inherits STATE
ZIP-level market 63136
- Home prices YoY
- 0.9%
- Rents YoY
- 5.0%
- Active inventory
- 372
- Price-to-rent
- 2.5×
Monthly cashflow live
- Estimated rent
- $995 medium interval (Pro) →
- Mortgage (P&I)
- −$157
- Tax from tax record
- −$52 /mo · $625/yr
- Insurance
- −$12
- HOA
- −$0
- Vacancy / Maint / Mgmt
- −$209
- Net cashflow
- $564
Break-even live
UW: 25.0% down · 7.5% · 30yr · 1.5% tax · 5.0% vac · 8.0% maint · 8.0% mgmt
Financing live
Cash to close
- Down payment
- $7,500
- Closing costs
- $900
- Reserves months
- —
- Total cash needed
- —
Loan-product check · same deal, 3 products live
Conventional
25% down · 7.5% · 30yr
- Down + closing
- —
- Monthly P&I
- —
- Monthly cashflow
- —
- DSCR
- —
- Eligible?
- —
Personal DTI + credit; lowest rate.
DSCR
20% down · 8.5% · 30yr
- Down + closing
- —
- Monthly P&I
- —
- Monthly cashflow
- —
- DSCR
- —
- Eligible?
- —
No personal income docs; deal must DSCR.
Hard money
10% down · 12.0% · 12mo
- Down + closing
- —
- Monthly P&I
- —
- Monthly cashflow
- —
- DSCR
- —
- Eligible?
- —
Short-term bridge; refi at stabilization.
Listing history 10 events
-
2026-06-18days on market $30,000 Active 13 DOM
-
2026-06-17days on market $30,000 Active 12 DOM
-
2026-06-16days on market $30,000 Active 11 DOM
-
2026-06-15days on market $30,000 Active 10 DOM
-
2026-06-13days on market $30,000 Active 8 DOM
-
2026-06-13days on market $30,000 Active 7 DOM
-
2026-06-09days on market $30,000 Active 4 DOM
-
2026-06-08days on market $30,000 Active 3 DOM
-
2026-06-07remarks 454-char remark
-
2026-06-07$30,000 Active 2 DOM
ⓘ Source: listings_history table (triggers on properties + properties_extension) + one-shot
backfill from property_details.listing_events for pre-trigger history.
Tax reassessment forecast MO · Resets to sale price
- Current annual tax
- $625 · $52/mo
- Projected year-2 tax
- $625 · $52/mo
- Expected delta
- $0/yr ($0/mo · 0.0%)
ⓘ Screening estimate from a state-policy table — verify with the county assessor before closing.
Climate risk First Street
- Flood 1/10 Low FEMA zone X (unshaded) · 0% chance over 30 yrs
- Wildfire 1/10 Low
- Heat 5/10 Major 7 d/yr ≥107°F today · 21 d/yr by 30 yrs out
- Wind 2/10 Low 100% chance of damaging wind over 30 yrs
- Air quality 4/10 Moderate 4 unhealthy d/yr today · 5 by 30 yrs out
Nearby sold comps map
Loading sold comps map…
Walkable amenities ~0.75 mi
Loading nearby amenities…
Taxation est. · year 1
- Rental income
- $11,943
- − Mortgage interest
- −$1,680
- − Property taxes
- −$625
- − Insurance
- −$150
- − Repairs & maintenance
- −$955
- − Management
- −$955
- − Depreciation
- −$873
- Taxable income
- $6,704
- Est. tax owed @ 24.0%
- −$1,609
- After-tax cash flow
- $5,163/yr
For passive investors: Depreciation is non-cash, so a rental often shows a tax loss while cash-flowing — sheltering income. Rental losses are passive: they offset passive income freely, and up to $25,000/yr can offset ordinary (W-2) income if you actively participate and your MAGI is under $100k (phasing out to $0 by $150k); unused losses carry forward. On sale, claimed depreciation is recaptured at up to 25%, and gains may owe capital-gains tax (a 1031 exchange can defer both). Figures are a year-1 estimate at your 24.0% rate — not tax advice; consult a CPA.
Schools (NCES district)
- District
- Riverview Gardens
- NCES district ID
- 2926670
- Math proficiency
- 2% ▼ -6.00%
- Reading proficiency
- 9% ▼ -6.00%
- Median HH income
- $32,759
- Composite
- 4.22/100
- National rank
- #10058
- State rank
- #324 of 324 in MO
Livability — Castle Point
- Score
- 64/100
- State rank
- #313
- US rank
- #14373
Category grades
Schools grade is shown separately in the Schools card above.
Census & demographics
- Census place
- Castle Point, MO
- County
- Saint Louis County · 888,823 people
- Metro
- St. Louis, MO-IL
- Population (ZIP)
- 40,929
- Household income
- $41,154
- Rent vs Own
- Severe rent burden
- 3085.0
Population outlook (St. Louis County) Hauer SSP2
- Today (2025)
- 1,025,227 people
- By 2030
- 1,028,023 · +0.3%
- By 2040
- 1,020,940 · -0.4%
- By 2050
- 1,007,280 · -1.8%
- By 2075
- 987,277 · -3.7%
- By 2100
- 921,984 · -10.1%
Race, ethnicity, and origin ACS 2023
- Neighborhood character
- Predominantly Black (90%)
- Race & ethnicity
- Black 90% White 5% Two or more races 3%
- Foreign-born
- 1% · Canada
Political lean MEDSL · St. Louis
- 2024 margin
- Strong D (+23.4) · D 60.8% · R 37.4% · Other 1.7%
- 2008→2024 swing
- +3.5pp toward D · 2008: 19.9pp · 2024: 23.4pp
- All cycles
- 2024: D+23.4 2020: D+24.0 2016: D+16.2 2012: D+13.7 2008: D+19.9
Not yet ingested
- Civics
- —
Market trends
- HPI YoY
- ▲ 3.79%
- Current HPI
- 420.28
- Rent YoY
- ▲ 4.97%
- Metro
- St. Louis, MO-IL
- State GDP YoY
- ▲ 1.84%
- F500 in state
- 20
Industry mix (Fortune 500 HQ in MO)
| Industry | F500 HQs | Revenue |
|---|---|---|
| Healthcare | 1 | $163B |
|
||
| Insurance | 1 | $21B |
|
||
| Industrial Technology | 1 | $17B |
|
||
| Retail | 1 | $16B |
|
||
| Industrial Distribution | 1 | $10B |
|
||
| Utilities | 1 | $9B |
|
||
Price history
4 events — show timeline
- 2026-06-05 Listed $30,000 MARIS as Distributed by MLS Grid
- 1992-06-24 Sold (Public Records) — Public Records
- 1992-06-24 Sold (Public Records) — Public Records
- 1987-10-01 Sold (Public Records) — Public Records
Property tax history
+7.8%/yrLatest (2022): $625 · +0.4% YoY. Source: county tax records.
Cash-flow waterfall
monthlySold comps — $/sqft
last 12 mo · ≤1 miLoading sold comps…