7484 Kickapoo Trl #9 · Yucca Valley, CA
Flood risk 4/10 · Minor
- FEMA flood zone
- A
- Chance of flooding over 30 yrs
- 0.24%
- Est. flood insurance / yr
- $1,009 – $1,996
Fire risk 5/10 · Moderate
- Est. fire insurance / yr
- $659 – $1,223
Heat risk 6/10 · Moderate
- Hot days now (above 97°F)
- 7 days/yr
- Hot days in 30 yrs
- 19 days/yr
Wind risk 1/10 · Minimal
- Chance of severe wind over 30 yrs
- —
Air-quality risk 6/10 · Moderate
- Unhealthy air days now
- 12 days/yr
- Unhealthy air days in 30 yrs
- 14 days/yr
Risk factors via First Street. Map © Google.
Why this score? — see what drove the B+ grade
The composite is a weighted blend of 9 inputs, each scored 0–100. Each bar is that input's sub-score; the figure is the points it added to the 100-point composite (weight × sub-score).
- Cash flow +30.0/30.0
- ARV discount +15.0/15.0
- 1% rule +10.0/10.0
- DSCR +10.0/10.0
- Rent growth +3.5/5.0
- Livability +3.0/5.0
- Schools +2.2/10.0
- Condition / age +2.2/5.0
- Appreciation +0.0/10.0
$46,999
🖨 Deal sheet 📄 Offer letter ✓ Due diligence
Listing remarks MLS
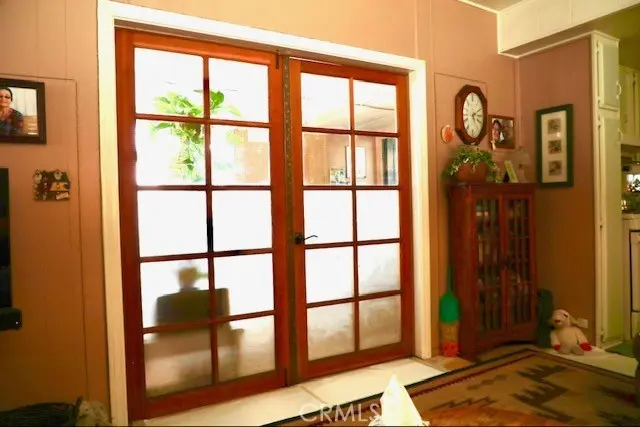
Charming 2-Bedroom Home in the Desirable 55+ Royal Crest Community Welcome to your sunny desert retreat! This inviting 2-bedroom, 2-bath manufactured home is located in the sought-after Royal Crest Mobile Home Park and offers comfort, character, and convenience all in one. The bright and open floor plan seamlessly connects the living, dining, and kitchen areas, creating a warm and welcoming space perfect for everyday living and entertaining. Enjoy abundant cabinet storage, a dedicated laundry area, and your own covered porch—ideal for relaxing and taking in the peaceful desert surroundings. A storage shed is also included for added convenience. Residents of this well-maintained community enjoy great amenities, including a sparkling pool, spa. The affordable monthly space rent (subject to park approval) adds to the appeal. Centrally located in Yucca Valley, you’re just minutes from shopping, dining, and local conveniences, as well as close to local golf courses for those who enjoy an active lifestyle with easy access to Joshua Tree National Park, Desert Hot Springs, and Palm Springs. Don’t miss this wonderful opportunity to own a home in one of the area’s most welcoming senior communities!
Key facts
- Covered porch
- Spa
- Storage shed
Tags
Neighborhood map
What this means for you Summary
Snapshot
- This is a 2-bed/2.0-bath manufactured listed at $47k. Condition is rated fair.
Deal economics
- At list price, monthly cash flow is $984 ($12k/yr) — positive.
- The deal already cash-flows at list — no discount required.
- Meets the 1% rule at list price ($2k rent vs $47k).
- Recommended offer: $43k (9.0% below list) — sets the bar for market timing.
- Cap rate 34.6% vs local median 3.6% in Yucca Valley — top-decile yield for the area; either an underpriced asset or a hidden risk that comps aren't pricing in. Stress-test before assuming the spread holds.
Location & tenants
- Location reads 60/100 on livability (#566 in CA) — a middle-class / working-renter tenant base. Strengths: commute A+, housing A+; Watch: cost of living D+, schools F, crime D-.
- Morongo Unified (town): math 15% / reading 38% proficiency, ranked #395 of 517 in CA (top 76%) — low school quality limits family demand, transient renter base, plan for 1-2y turnover.
- Market conditions: Rents rising fast (+4.1%/yr); 563 active listings in the ZIP; 7 comparable units currently listed for rent nearby; rentals lingering (median 44d on market — plan ~5-8 weeks vacancy on turnover, expect pricing pressure); 57% of comp listings sitting > 30 days — soft ceiling on asking rent; 5,458 units permitted in San Bernardino County in 2024 (1,500 in 5+ unit buildings).
- This rent runs 37% of the median local income ($58k/yr) — at the standard rent-burdened threshold; future hikes will face affordability resistance.
Forward outlook
- Local home prices are declining (-3.0%/yr); year-one equity from $325 of loan paydown is wiped out by about $1k of value loss. Plan a longer hold.
- San Bernardino County population projected at +15% by 2050 — modest demand growth; plan on rents tracking national, not racing it.
- At projected returns (-3.0% appreciation + 4.1% rent growth), your $13k cash investment doubles in ~2 years — after that, you're playing with house money.
Negotiation context
- It's been on market 91 days — a 9% lower offer ($43k) is reasonable based on typical stale-listing flexibility.
Risks & watch-outs
- Watch-outs: flood insurance adds $125/mo.
- Climate carrying-cost: in FEMA flood zone A (mandatory federal flood insurance); moderate wildfire risk; extreme-heat days projected 7→19/yr by 2055 (HVAC capex compounding) — expect insurance premiums to compound above CPI over the hold.
Questions for the listing agent
- It's been on market 91 days. Have you received any prior offers? Is the seller open to a 9% concession, seller financing, or rate buy-down credit?
- Have any recent inspections been done? Can we get a copy of the seller's disclosures and any deferred-maintenance estimates?
- Built in 1972 — when were the roof, HVAC, electrical panel, plumbing, and water heater last replaced?
- What's the actual annual flood-insurance premium (NFIP or private), and is the property in a SFHA with mandatory coverage?
- Why hasn't it sold? Are there any deal-killer items the seller is aware of (foundation, flood, title, zoning, code violations)?
- Is there a deadline driving the sale (1031 exchange, divorce, estate, relocation)? That informs how much negotiation room exists.
- Schools are F-rated, which usually means shorter tenancies and higher turnover. Who's the typical renter profile here, and what's been the actual vacancy rate?
- Crime grade is D in this area — have there been break-ins, vandalism, or insurance claims at this property in the last 3 years? What carrier currently insures it and at what premium?
- What's the average days-on-market for RENTAL listings here right now (not sales)? A rising rental-DOM trend means longer vacancies and softer asking-rent achievability than the comps imply.
- What's the recent tenant-quality profile in this submarket — average credit score on applications, eviction rate, late-payment / NSF rate, and stable-employment percentage? A property-management company in the area should have these aggregated.
- How much new for-sale + rental construction is in the pipeline within 1–3 miles? Heavy new supply typically softens prices + rents 12–24 months out; constrained supply supports both.
Investment metrics
- 1% rule
- 3.86% ✓
- Cap rate
- 34.60%
- Cash-on-cash
- 101.11%
- DSCR
- 5.50
- GRM
- 2.2
CMA / ARV
- ARV (median comp)
- $68,905
- List price
- $46,999
- Delta
- -31.79%
- Verdict
- UNDERPRICED
- Comps
- 10 within 1.0 mi
Show comp detail 12 sales within ~0.75 mi
| Address | Dist | Beds/Ba | Sqft | Sold | Price | $/sf | Match |
|---|---|---|---|---|---|---|---|
| 54999 Martinez Trl #49 | 0.33mi | 2/2.0 | 1,400 (+6%) | 3mo | $79,900 | $57 | 72 |
| 54999 Martinez Trl #109 | 0.33mi | 2/2.0 | 1,248 (-6%) | 11mo | $88,500 | $71 | 67 |
| 54999 Martinez Trl #65 | 0.33mi | 2/2.0 | 1,440 (+9%) | 4mo | $44,500 | $31 | 66 |
| 54999 Martinez Trl #9 | 0.33mi | 2/2.0 | 1,296 (-2%) | 19mo | $65,000 | $50 | 66 |
| 54999-54999 Martinez #80 | 0.33mi | 2/2.0 | 1,200 (-9%) | 5mo | $61,810 | $52 | 65 |
| 54999 Martinez | 0.32mi | 2/2.0 | 1,200 (-9%) | 6mo | $30,000 | $25 | 65 |
| 54999 Martinez Trl #79 | 0.33mi | 2/2.0 | 1,510 (+14%) | 0mo | $15,000 | $10 | 61 |
| 54999 Martinez Trl Spc 10 | 0.44mi | 2/2.0 | 1,248 (-6%) | 12mo | $80,000 | $64 | 61 |
| 54999 Martinez Trl #54 | 0.33mi | 2/2.0 | 1,440 (+9%) | 12mo | $80,825 | $56 | 60 |
| 54999 Martinez Trl #94 | 0.33mi | 2/2.0 | 1,200 (-9%) | 16mo | $72,000 | $60 | 56 |
| 55524 Yucca Trl #65 | 0.41mi | 2/2.0 | 1,248 (-6%) | 20mo | $83,000 | $67 | 55 |
| 55524 Yucca Trl #2 | 0.50mi | 2/2.0 | 1,440 (+9%) | 20mo | $58,500 | $41 | 44 |
Match score weights: distance 35% · size 25% · config 20% · recency 20%. Top-matched comps best support the ARV.
Projected returns pro-forma
-3.0% appreciation · 4.12% rent growth · sell at horizon
- IRR
- 91.8%
- Equity multiple
- 5.35×
- Total profit
- $57,204
- Equity at exit
- $7,008
- IRR
- 94.9%
- Equity multiple
- 11.61×
- Total profit
- $139,586
- Equity at exit
- $4,064
Cash invested: $13,160 (down + closing). Projections, not guarantees.
Landlord ↔ Tenant lean methodology
- Overall (STATE)
- 18 Strongly Tenant-Friendly
- State California
- 18 Strongly Tenant-Friendly · D+13
- County
- — inherits STATE
- City
- — inherits STATE
ZIP-level market 92284
- Home prices YoY
- -33.1%
- Rents YoY
- 4.1%
- Active inventory
- 563
- Price-to-rent
- 2.2×
Monthly cashflow live
- Estimated rent
- $1,815 high interval (Pro) →
- Mortgage (P&I)
- −$246
- Tax est. 1.5%
- −$59 /mo · $705/yr
- Insurance
- −$20
- Flood insurance flood zone
- −$125 /mo · $1,502/yr
- HOA
- −$0
- Vacancy / Maint / Mgmt
- −$381
- Net cashflow
- $984
Break-even live
UW: 25.0% down · 7.5% · 30yr · 1.5% tax · 5.0% vac · 8.0% maint · 8.0% mgmt
Financing live
Cash to close
- Down payment
- $11,750
- Closing costs
- $1,410
- Reserves months
- —
- Total cash needed
- —
Loan-product check · same deal, 3 products live
Conventional
25% down · 7.5% · 30yr
- Down + closing
- —
- Monthly P&I
- —
- Monthly cashflow
- —
- DSCR
- —
- Eligible?
- —
Personal DTI + credit; lowest rate.
DSCR
20% down · 8.5% · 30yr
- Down + closing
- —
- Monthly P&I
- —
- Monthly cashflow
- —
- DSCR
- —
- Eligible?
- —
No personal income docs; deal must DSCR.
Hard money
10% down · 12.0% · 12mo
- Down + closing
- —
- Monthly P&I
- —
- Monthly cashflow
- —
- DSCR
- —
- Eligible?
- —
Short-term bridge; refi at stabilization.
Rent comps 7 comps
| Address | Beds | Baths | Sqft | Rent | $/sqft | DOM | Units | Dist |
|---|---|---|---|---|---|---|---|---|
| 55220 Airlane Dr Unit 14A Yucca Valley, CA | 2.0 | 2.0 | 954 | $1,510 | $1.58 | 43d | 1 | 0.05mi |
| 7420 Geronimo Trl Yucca Valley, CA | 3.0 | 1.0 | 1280 | $1,700 | $1.33 | 43d | 1 | 0.50mi |
| 54822 El Prado Trl Yucca Valley, CA | 3.0 | 2.0 | 1494 | $2,595 | $1.74 | 43d | 1 | 0.53mi |
| 55897 Santa Fe Trl Yucca Valley, CA | 3.0 | 2.0 | 1701 | $2,300 | $1.35 | 2d | 1 | 0.79mi |
| 7592 Pinon Dr Yucca Valley, CA | 3.0 | 2.0 | 1542 | $2,200 | $1.43 | 1d | 1 | 0.81mi |
| 7616 Apache Trl Yucca Valley, CA | 2.0 | 1.0 | 1008 | $1,900 | $1.88 | 43d | 1 | 1.06mi |
| 7496 Church St Yucca Valley, CA | 2.0 | 2.0 | 987 | $1,850 | $1.87 | 18d | 1 | 1.28mi |
Listing history 16 events
-
2026-06-18days on market $46,999 Active 91 DOM
-
2026-06-17days on market $46,999 Active 90 DOM
-
2026-06-16days on market $46,999 Active 89 DOM
-
2026-06-15days on market $46,999 Active 88 DOM
-
2026-06-13days on market $46,999 Active 86 DOM
-
2026-06-13days on market $46,999 Active 85 DOM
-
2026-06-09days on market $46,999 Active 82 DOM
-
2026-06-08days on market $46,999 Active 81 DOM
-
2026-06-07days on market $46,999 Active 80 DOM
-
2026-06-04days on market $46,999 Active 77 DOM
-
2026-06-03days on market $46,999 Active 76 DOM
-
2026-06-02days on market $46,999 Active 75 DOM
-
2026-06-01days on market $46,999 Active 74 DOM
-
2026-05-31days on market $46,999 Active 73 DOM
-
2026-05-02price $46,999 1232-char remark
Show marketing remark (1232 chars)
Charming 2-Bedroom Home in the Desirable 55+ Royal Crest Community Welcome to your sunny desert retreat! This inviting 2-bedroom, 2-bath manufactured home is located in the sought-after Royal Crest Mobile Home Park and offers comfort, character, and convenience all in one. The bright and open floor plan seamlessly connects the living, dining, and kitchen areas, creating a warm and welcoming space perfect for everyday living and entertaining. Enjoy abundant cabinet storage, a dedicated laundry area, and your own covered porch—ideal for relaxing and taking in the peaceful desert surroundings. A storage shed is also included for added convenience. Residents of this well-maintained community enjoy great amenities, including a sparkling pool, spa. The affordable monthly space rent (subject to park approval) adds to the appeal. Centrally located in Yucca Valley, you’re just minutes from shopping, dining, and local conveniences, as well as close to local golf courses for those who enjoy an active lifestyle with easy access to Joshua Tree National Park, Desert Hot Springs, and Palm Springs. Don’t miss this wonderful opportunity to own a home in one of the area’s most welcoming senior communities!
-
2026-03-19$70,000 Active 1232-char remark
Show marketing remark (1232 chars)
Charming 2-Bedroom Home in the Desirable 55+ Royal Crest Community Welcome to your sunny desert retreat! This inviting 2-bedroom, 2-bath manufactured home is located in the sought-after Royal Crest Mobile Home Park and offers comfort, character, and convenience all in one. The bright and open floor plan seamlessly connects the living, dining, and kitchen areas, creating a warm and welcoming space perfect for everyday living and entertaining. Enjoy abundant cabinet storage, a dedicated laundry area, and your own covered porch—ideal for relaxing and taking in the peaceful desert surroundings. A storage shed is also included for added convenience. Residents of this well-maintained community enjoy great amenities, including a sparkling pool, spa. The affordable monthly space rent (subject to park approval) adds to the appeal. Centrally located in Yucca Valley, you’re just minutes from shopping, dining, and local conveniences, as well as close to local golf courses for those who enjoy an active lifestyle with easy access to Joshua Tree National Park, Desert Hot Springs, and Palm Springs. Don’t miss this wonderful opportunity to own a home in one of the area’s most welcoming senior communities!
ⓘ Source: listings_history table (triggers on properties + properties_extension) + one-shot
backfill from property_details.listing_events for pre-trigger history.
Climate risk First Street
- Flood 4/10 Moderate FEMA zone A · 24% chance over 30 yrs
- Wildfire 5/10 Major
- Heat 6/10 Major 7 d/yr ≥97°F today · 19 d/yr by 30 yrs out
- Wind 1/10 Low
- Air quality 6/10 Major 12 unhealthy d/yr today · 14 by 30 yrs out
Nearby sold comps map
Loading sold comps map…
Walkable amenities ~0.75 mi
Loading nearby amenities…
Taxation est. · year 1
- Rental income
- $21,777
- − Mortgage interest
- −$2,633
- − Property taxes
- −$705
- − Insurance
- −$1,737
- − Repairs & maintenance
- −$1,742
- − Management
- −$1,742
- − Depreciation
- −$1,367
- Taxable income
- $11,850
- Est. tax owed @ 24.0%
- −$2,844
- After-tax cash flow
- $8,960/yr
For passive investors: Depreciation is non-cash, so a rental often shows a tax loss while cash-flowing — sheltering income. Rental losses are passive: they offset passive income freely, and up to $25,000/yr can offset ordinary (W-2) income if you actively participate and your MAGI is under $100k (phasing out to $0 by $150k); unused losses carry forward. On sale, claimed depreciation is recaptured at up to 25%, and gains may owe capital-gains tax (a 1031 exchange can defer both). Figures are a year-1 estimate at your 24.0% rate — not tax advice; consult a CPA.
Condition & rehab AI · 12 photos
This home requires moderate repairs and maintenance to improve its condition and increase its value. The interior walls, kitchen cabinets, and bathroom fixtures are in need of replacement, while the exterior siding and landscaping can be improved with some work.
Repairs flagged
- Minor kitchen cabinets — Light wear and tear.
- Minor bathroom fixtures — Some wear and tear.
- Minor HVAC ductwork — Visible and may need cleaning.
- Minor exterior siding — Some signs of wear.
- Minor interior walls — Paint chipping in some areas.
- Minor landscaping — Minimal landscaping with some plants visible in the front yard.
Value-add opportunities
- Both Paint interior walls — Fresh paint can improve the overall appearance and value of the home.
- Both Replace worn-out carpet — New carpet can improve the living space and increase the home's value.
- Both Replace worn-out kitchen cabinets — New cabinets can improve the kitchen's functionality and appearance.
- Both Replace worn-out bathroom fixtures — New fixtures can improve the bathroom's functionality and appearance.
- Both Replace worn-out blinds — New blinds can improve the home's curb appeal and functionality.
- Both Landscaping — New landscaping can improve the home's curb appeal and increase its value.
Renovation cost estimate screening
| Repair item | Severity | Est. cost |
|---|---|---|
| kitchen cabinets · Light wear and tear. | Minor | $500–3,000 |
| bathroom fixtures · Some wear and tear. | Minor | $500–3,000 |
| HVAC ductwork · Visible and may need cleaning. | Minor | $500–3,000 |
| exterior siding · Some signs of wear. | Minor | $500–3,000 |
| interior walls · Paint chipping in some areas. | Minor | $500–3,000 |
| landscaping · Minimal landscaping with some plants visible in the front yard. | Minor | $500–3,000 |
| Total estimated repair cost · 6 items | $3,000–18,000 |
Value-add ROI direction
- Both Paint interior walls — Fresh paint can improve the overall appearance and value of the home. ↑
- Both Replace worn-out carpet — New carpet can improve the living space and increase the home's value. ↑
- Both Replace worn-out kitchen cabinets — New cabinets can improve the kitchen's functionality and appearance. ↑
- Both Replace worn-out bathroom fixtures — New fixtures can improve the bathroom's functionality and appearance. ↑
- Both Replace worn-out blinds — New blinds can improve the home's curb appeal and functionality. ↑
- Both Landscaping — New landscaping can improve the home's curb appeal and increase its value. ↑
ⓘ Cost ranges are severity-bucket heuristics (US national rule-of-thumb). Get contractor quotes + a written scope before underwriting a rehab budget.
Schools (NCES district)
- District
- Morongo Unified
- NCES district ID
- 0625860
- Math proficiency
- 15% ▼ -12.00%
- Reading proficiency
- 38% ▼ -3.00%
- Median HH income
- $39,399
- Composite
- 22.19/100
- National rank
- #8156
- State rank
- #395 of 517 in CA
Livability — Yucca Valley
- Score
- 60/100
- State rank
- #566
- US rank
- #18584
Category grades
Schools grade is shown separately in the Schools card above.
Census & demographics
- Census place
- Yucca Valley, CA
- County
- San Bernardino County · 2,030,291 people
- City population
- 25,415
- Metro
- Riverside-San Bernardino-Ontario, CA
- Population (ZIP)
- 25,415
- Household income
- $58,373
- Rent vs Own
- Severe rent burden
- 1132.0
Population outlook (San Bernardino County) Hauer SSP2
- Today (2025)
- 2,300,329 people
- By 2030
- 2,378,907 · +3.4%
- By 2040
- 2,523,137 · +9.7%
- By 2050
- 2,642,388 · +14.9%
- By 2075
- 2,880,769 · +25.2%
- By 2100
- 2,909,436 · +26.5%
Race, ethnicity, and origin ACS 2023
- Neighborhood character
- Diverse neighborhood (Simpson 0.55)
- Race & ethnicity
- White 62% Hispanic / Latino 25% Two or more races 18% Black 2% Native American 2% Asian 2% Pacific Islander 1%
- Hispanic origin (detail)
- Mexican 20%
- Common ancestry
- Italian 4% Romanian 2% Slovak 2%
- Foreign-born
- 9% · Canada
- Languages at home
- 82% English-only · Spanish 14% Other Indo-European 1% Other Asian/Pacific 1%
Political lean MEDSL · San Bernardino
- 2024 margin
- Toss-up / Even · D 47.5% · R 49.7% · Other 2.8%
- 2008→2024 swing
- -8.5pp toward R · 2008: 6.3pp · 2024: -2.1pp
- All cycles
- 2024: R+2.1 2020: D+10.7 2016: D+9.8 2012: D+5.4 2008: D+6.3
Not yet ingested
- Civics
- —
Market trends
- HPI YoY
- ▼ -241.13%
- Current HPI
- 486.7185
- Rent YoY
- ▲ 4.12%
- Metro
- Riverside-San Bernardino-Ontario, CA
- State GDP YoY
- ▲ 3.21%
- F500 in state
- 116
Industry mix (Fortune 500 HQ in CA)
| Industry | F500 HQs | Revenue |
|---|---|---|
| Technology | 27 | $1,492B |
|
||
| Financial Services | 3 | $174B |
|
||
| Retail | 3 | $44B |
|
||
| Insurance | 3 | $26B |
|
||
| Media / Entertainment | 2 | $115B |
|
||
| Pharmaceuticals / Biotech | 2 | $62B |
|
||
Price history
-32.9% since first listed2 events — show timeline
- 2026-05-02 Price Changed $46,999 CRMLS
- 2026-03-19 Listed $70,000 CRMLS
Cash-flow waterfall
monthlySold comps — $/sqft
last 12 mo · ≤1 miLoading sold comps…