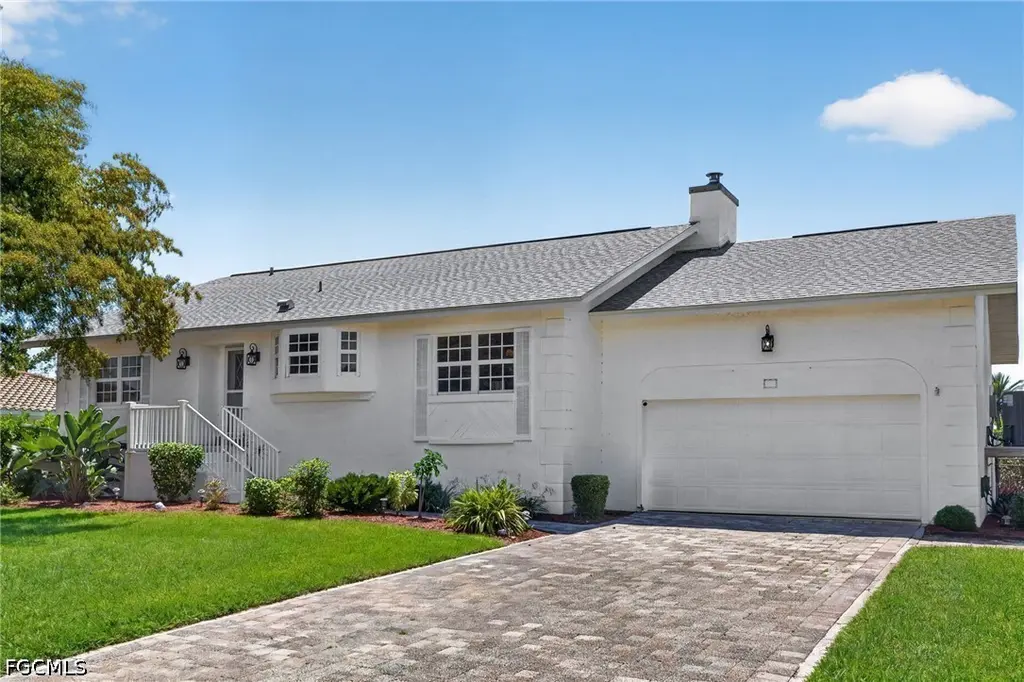
713 Durion Ct · Sanibel, FL
Flood risk 9/10 · Severe
- FEMA flood zone
- AE
- Chance of flooding over 30 yrs
- 0.99%
- Est. flood insurance / yr
- $1,737 – $8,500
Fire risk 3/10 · Minor
- Est. fire insurance / yr
- $947 – $1,759
Heat risk 10/10 · Severe
- Hot days now (above 112°F)
- 7 days/yr
- Hot days in 30 yrs
- 25 days/yr
Wind risk 10/10 · Severe
- Chance of severe wind over 30 yrs
- 99.0%
Air-quality risk 2/10 · Minimal
- Unhealthy air days now
- 1 days/yr
- Unhealthy air days in 30 yrs
- 1 days/yr
Risk factors via First Street. Map © Google.
Why this score? — see what drove the C grade
The composite is a weighted blend of 9 inputs, each scored 0–100. Each bar is that input's sub-score; the figure is the points it added to the 100-point composite (weight × sub-score).
- Cash flow +26.5/30.0
- DSCR +9.0/10.0
- 1% rule +6.7/10.0
- Schools +4.1/10.0
- Livability +3.4/5.0
- Rent growth +2.5/5.0
- Condition / age +2.5/5.0
- ARV discount +1.1/15.0
- Appreciation +0.0/10.0
$899,000
🖨 Deal sheet 📄 Offer letter ✓ Due diligence
Listing remarks
This near beach beautifully renovated elevated pool home has gorgeous western views over the pool and lake. The den easily functions as a third bedroom with direct access to the deck and pool area. New roof and interior renovation in 2023. White shaker style cabinets, quartz counters and stainless steel appliances. French doors line the living room, connecting it to the spacious covered porch. With a large pool and tropical landscaping, the waterfront backyard is ideal for enjoying sunny days and evening sunsets. Beach access is nearby, making this your perfect new beach house!
Key facts
- Quartz counters
- New roof
- 0.29 acre lot
Tags
Property features AI
Finance
- Financial info: Pets allowed
- HOA & community: Non-gated community; Community beach access and beach rights; 82 units in the community
Exterior
- Parking: Attached 2-car garage with garage door opener
- Utilities: Public water; Public sewer; Cable available
- Home design: Single-story home; Entry level 1; Faces east; Raised foundation; Resale property
- Construction: Built with stucco and wood frame; Shingle roof
- Exterior features: Open porch; Patio; Rectangular lot with pond on lot; West exposure; Lakefront view; Has a view
Interior
- Kitchen: Dishwasher; Range; Microwave; Refrigerator
- Bedrooms: Den; Great room
- Flooring: Tile; Vinyl
- Bathrooms: 2 full bathrooms
- Heating & cooling: Central heating (electric); Central air conditioning (electric); Ceiling fans
- Interior features: Breakfast bar; Entrance foyer; Fireplace; Combined living/dining area; Shower-only bath with separate shower; Vaulted ceilings; Single-hung windows; Unfurnished
- Laundry & utility: Washer and Dryer (inside laundry)
Neighborhood map
What this means for you Summary
Snapshot
- This is a 2-bed/2.0-bath single-family listed at $899k.
Deal economics
- At list price, monthly cash flow is $2k ($23k/yr) — positive.
- The deal already cash-flows at list — no discount required.
- Meets the 1% rule at list price ($10k rent vs $899k).
- Recommended offer: $886k (1.5% below list) — sets the bar for market timing.
- Cap rate 9.4% vs local median 3.8% in Sanibel — top-decile yield for the area; either an underpriced asset or a hidden risk that comps aren't pricing in. Stress-test before assuming the spread holds.
Location & tenants
- Location reads 67/100 on livability (#541 in FL) — a middle-class / working-renter tenant base. Strengths: schools A+, crime A+, employment A+; Watch: housing D+, amenities F, commute F.
- Lee (suburban): math 47% / reading 50% proficiency, ranked #42 of 73 in FL (top 58%) — families likely to look elsewhere, expect single-tenant / working-renter base with shorter leases.
- Market conditions: 526 active listings in the ZIP; 2 comparable units currently listed for rent nearby; 15,411 units permitted in Lee County in 2024 (4,686 in 5+ unit buildings).
Forward outlook
- Local home prices are declining (-3.0%/yr); year-one equity from $6k of loan paydown is wiped out by about $27k of value loss. Plan a longer hold.
- Lee County population projected at +44% by 2050 — long-run rental-demand tailwind backs the buy-and-hold thesis.
Negotiation context
- It's been on market 23 days — a 2% lower offer ($886k) is reasonable based on typical stale-listing flexibility.
- 5 sale attempts since 2y ago; this cycle's ask has dropped $96k (10%) from the opening price — seller is motivated, your offer sets the floor, not the list.
- Current owner paid $500k; list at $899k implies a 80% gain — meaningful room to come down on a strong offer.
Risks & watch-outs
- Watch-outs: flood insurance adds $427/mo.
- Climate carrying-cost: in FEMA flood zone AE (mandatory federal flood insurance); severe wind risk, 99% chance of damaging wind over 30y; extreme-heat days projected 7→25/yr by 2055 (HVAC capex compounding) — expect insurance premiums to compound above CPI over the hold.
Questions for the listing agent
- What's the actual annual flood-insurance premium (NFIP or private), and is the property in a SFHA with mandatory coverage?
- Is there a deadline driving the sale (1031 exchange, divorce, estate, relocation)? That informs how much negotiation room exists.
- Schools are A-rated — typically a magnet for longer-tenancy family renters. What's the average tenant stay here, and is there a school-zone premium baked into asking?
- What's the average days-on-market for RENTAL listings here right now (not sales)? A rising rental-DOM trend means longer vacancies and softer asking-rent achievability than the comps imply.
- What's the recent tenant-quality profile in this submarket — average credit score on applications, eviction rate, late-payment / NSF rate, and stable-employment percentage? A property-management company in the area should have these aggregated.
- How much new for-sale + rental construction is in the pipeline within 1–3 miles? Heavy new supply typically softens prices + rents 12–24 months out; constrained supply supports both.
Investment metrics
- 1% rule
- 1.17% ✓
- Cap rate
- 9.45%
- Cash-on-cash
- 11.27%
- DSCR
- 1.50
- GRM
- 7.1
CMA / ARV
- ARV (on-the-fly)
- $786,751
- Comps found
- 4
Show comp detail 4 sales within ~0.75 mi
| Address | Dist | Beds/Ba | Sqft | Sold | Price | $/sf | Match |
|---|---|---|---|---|---|---|---|
| 731 Durion Ct | 0.05mi | 3/2.0 (+1) | 1,748 (+10%) | 6mo | $999,000 | $572 | 71 |
| 4049 Coquina Dr | 0.35mi | 3/2.0 (+1) | 1,670 (+6%) | 12mo | $350,000 | $210 | 60 |
| 575 Hideaway Ct | 0.28mi | 3/2.5 (+1) | 1,430 (-10%) | 13mo | $607,500 | $425 | 53 |
| 547 Chert Ct | 0.26mi | 3/2.5 (+1) | 1,790 (+13%) | 21mo | $889,000 | $497 | 41 |
Match score weights: distance 35% · size 25% · config 20% · recency 20%. Top-matched comps best support the ARV.
Projected returns pro-forma
-3.0% appreciation · 3.0% rent growth · sell at horizon
- IRR
- -2.3%
- Equity multiple
- 0.91×
- Total profit
- $-22,050
- Equity at exit
- $134,044
- IRR
- 7.4%
- Equity multiple
- 1.56×
- Total profit
- $140,659
- Equity at exit
- $77,729
Cash invested: $251,720 (down + closing). Projections, not guarantees.
Landlord ↔ Tenant lean methodology
- Overall (STATE)
- 87 Strongly Landlord-Friendly
- State Florida
- 87 Strongly Landlord-Friendly · R+3
- County
- — inherits STATE
- City
- — inherits STATE
ZIP-level market 33957
- Home prices YoY
- -15.7%
- Active inventory
- 526
- Price-to-rent
- 7.1×
Monthly cashflow live
- Estimated rent
- $10,488 medium interval (Pro) →
- Mortgage (P&I)
- −$4,714
- Tax from tax record
- −$833 /mo · $9,996/yr
- Insurance
- −$375
- Flood insurance flood zone
- −$427 /mo · $5,118/yr
- HOA
- −$0
- Vacancy / Maint / Mgmt
- −$2,203
- Net cashflow
- $1,937
Break-even live
UW: 25.0% down · 7.5% · 30yr · 1.5% tax · 5.0% vac · 8.0% maint · 8.0% mgmt
Financing live
Cash to close
- Down payment
- $224,750
- Closing costs
- $26,970
- Reserves months
- —
- Total cash needed
- —
Loan-product check · same deal, 3 products live
Conventional
25% down · 7.5% · 30yr
- Down + closing
- —
- Monthly P&I
- —
- Monthly cashflow
- —
- DSCR
- —
- Eligible?
- —
Personal DTI + credit; lowest rate.
DSCR
20% down · 8.5% · 30yr
- Down + closing
- —
- Monthly P&I
- —
- Monthly cashflow
- —
- DSCR
- —
- Eligible?
- —
No personal income docs; deal must DSCR.
Hard money
10% down · 12.0% · 12mo
- Down + closing
- —
- Monthly P&I
- —
- Monthly cashflow
- —
- DSCR
- —
- Eligible?
- —
Short-term bridge; refi at stabilization.
Rent comps 2 comps
| Address | Beds | Baths | Sqft | Rent | $/sqft | DOM | Units | Dist |
|---|---|---|---|---|---|---|---|---|
| 707 Durion Ct Sanibel, FL | 3.0 | 2.5 | 1306 | $12,000 | $9.19 | 23d | 1 | 0.05mi |
| 548 Boulder Dr Sanibel, FL | 3.0 | 3.0 | 1969 | $6,500 | $3.30 | 23d | 1 | 0.26mi |
Listing history 26 events
-
2026-06-17days on market $899,000 Active 23 DOM
-
2026-06-16days on market $899,000 Active 22 DOM
-
2026-06-15days on market $899,000 Active 21 DOM
-
2026-06-13pricedays on market $899,000 Active 19 DOM
-
2026-06-10days on market $995,000 Active 16 DOM
-
2026-06-09days on market $995,000 Active 15 DOM
-
2026-06-08days on market $995,000 Active 14 DOM
-
2026-06-07days on market $995,000 Active 13 DOM
-
2026-06-03days on market $995,000 Active 9 DOM
-
2026-06-02days on market $995,000 Active 8 DOM
-
2026-06-01days on market $995,000 Active 7 DOM
-
2026-05-31days on market $995,000 Active 6 DOM
-
2026-05-25$995,000 Active
-
2025-12-31historical
-
2025-06-01historical $4,200
-
2025-05-05price $1,400,000
-
2025-03-24$850,000 Active
-
2025-02-06$4,200
-
2024-10-02historical $7,400
-
2024-06-05historical $7,400
-
2024-06-05$7,400
-
2024-04-08$7,400
-
2004-03-16soldstatus $500,000
-
2004-02-19soldstatus $500,000
-
2003-12-17price $525,000
-
1996-04-03soldstatus $230,000
ⓘ Source: listings_history table (triggers on properties + properties_extension) + one-shot
backfill from property_details.listing_events for pre-trigger history.
Tax reassessment forecast FL · Resets to sale price
- Current annual tax
- $9,996 · $833/mo
- Projected year-2 tax
- $9,996 · $833/mo
- Expected delta
- $0/yr ($0/mo · 0.0%)
ⓘ Screening estimate from a state-policy table — verify with the county assessor before closing.
Climate risk First Street
- Flood 9/10 Extreme FEMA zone AE · 99% chance over 30 yrs
- Wildfire 3/10 Moderate
- Heat 10/10 Extreme 7 d/yr ≥112°F today · 25 d/yr by 30 yrs out
- Wind 10/10 Extreme 99% chance of damaging wind over 30 yrs
- Air quality 2/10 Low 1 unhealthy d/yr today · 1 by 30 yrs out
Nearby sold comps map
Loading sold comps map…
Walkable amenities ~0.75 mi
Loading nearby amenities…
Taxation est. · year 1
- Rental income
- $125,861
- − Mortgage interest
- −$50,358
- − Property taxes
- −$9,996
- − Insurance
- −$9,614
- − Repairs & maintenance
- −$10,069
- − Management
- −$10,069
- − Depreciation
- −$26,153
- Taxable income
- $9,603
- Est. tax owed @ 24.0%
- −$2,305
- After-tax cash flow
- $20,942/yr
For passive investors: Depreciation is non-cash, so a rental often shows a tax loss while cash-flowing — sheltering income. Rental losses are passive: they offset passive income freely, and up to $25,000/yr can offset ordinary (W-2) income if you actively participate and your MAGI is under $100k (phasing out to $0 by $150k); unused losses carry forward. On sale, claimed depreciation is recaptured at up to 25%, and gains may owe capital-gains tax (a 1031 exchange can defer both). Figures are a year-1 estimate at your 24.0% rate — not tax advice; consult a CPA.
Schools (NCES district)
- District
- Lee
- NCES district ID
- 1201080
- Math proficiency
- 47% ▼ -11.00%
- Reading proficiency
- 50% ▼ -4.00%
- Median HH income
- $49,518
- Composite
- 41.49/100
- National rank
- #3458
- State rank
- #42 of 73 in FL
Livability — Sanibel
- Score
- 67/100
- State rank
- #541
- US rank
- #10166
Category grades
Schools grade is shown separately in the Schools card above.
Census & demographics
- Census place
- Sanibel, FL
- City population
- 6,402
- Population (ZIP)
- 6,402
Population outlook (Lee County) Hauer SSP2
- Today (2025)
- 871,946 people
- By 2030
- 955,468 · +9.6%
- By 2040
- 1,113,587 · +27.7%
- By 2050
- 1,256,891 · +44.1%
- By 2075
- 1,560,270 · +78.9%
- By 2100
- 1,726,848 · +98.0%
Race, ethnicity, and origin ACS 2023
- Neighborhood character
- Predominantly White (95%)
- Race & ethnicity
- White 95% Two or more races 2% Asian 1%
- Common ancestry
- Italian 4% Romanian 4% Slovak 2%
- Foreign-born
- 5% · Canada, China
- Languages at home
- 96% English-only · German/W. Germanic 1% Spanish 1% French/Haitian/Cajun 1%
Political lean MEDSL · Lee
- 2024 margin
- Strong R (+28.4) · D 35.5% · R 63.9%
- 2008→2024 swing
- -18.0pp toward R · 2008: -10.4pp · 2024: -28.4pp
- All cycles
- 2024: R+28.4 2020: R+19.2 2016: R+20.4 2012: R+16.6 2008: R+10.4
Not yet ingested
- Civics
- —
Market trends
- HPI YoY
- ▼ -93.08%
- Current HPI
- 501.0
- Rent YoY
- —
- Metro
- —
- State GDP YoY
- ▲ 3.28%
- F500 in state
- 36
Industry mix (Fortune 500 HQ in FL)
| Industry | F500 HQs | Revenue |
|---|---|---|
| Industrial Technology | 2 | $29B |
|
||
| Insurance | 2 | $17B |
|
||
| Retail | 1 | $60B |
|
||
| Technology Distribution | 1 | $58B |
|
||
| Homebuilding | 1 | $35B |
|
||
| Technology Manufacturing | 1 | $35B |
|
||
Price history
+332.6% since first listed14 events — show timeline
- 2026-05-25 Listed $995,000 FORTMLS
- 2025-12-31 Listing Removed — FORTMLS
- 2025-06-01 Rental Removed $4,200 FORTMLS
- 2025-05-05 Price Changed $1,400,000 FORTMLS
- 2025-03-24 Listed $850,000 FORTMLS
- 2025-02-06 Listed for Rent $4,200 FORTMLS
- 2024-10-02 Rental Removed $7,400 NAPLESMLS
- 2024-06-05 Rental Removed $7,400 FORTMLS
- 2024-06-05 Listed for Rent $7,400 NAPLESMLS
- 2024-04-08 Listed for Rent $7,400 FORTMLS
- 2004-03-16 Sold (Public Records) $500,000 Public Records
- 2004-02-19 Sold (MLS) $500,000 FORTMLS
- 2003-12-17 Price Changed $525,000 FORTMLS
- 1996-04-03 Sold (Public Records) $230,000 Public Records
Property tax history
+3.8%/yrLatest (2025): $9,996 · +10.4% YoY. Source: county tax records.
Cash-flow waterfall
monthlySold comps — $/sqft
last 12 mo · ≤1 miLoading sold comps…