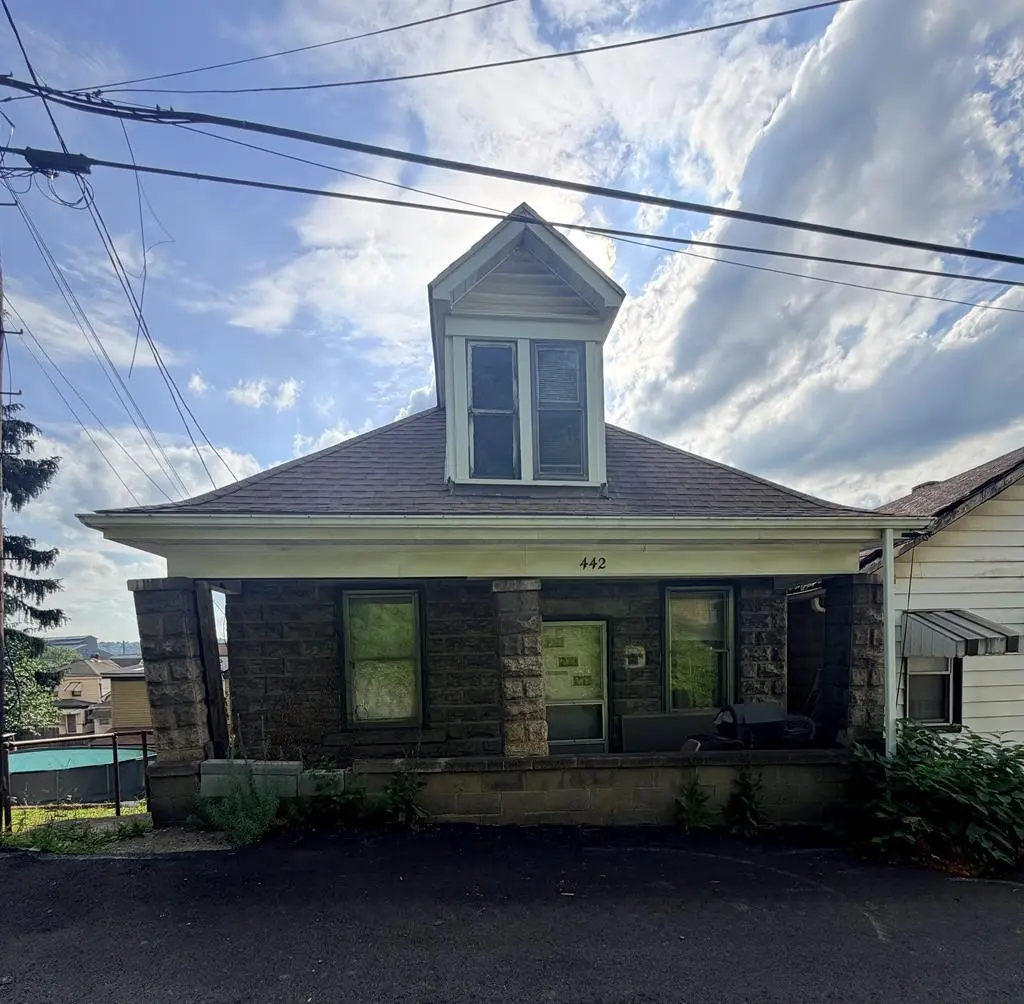
442 Rose St · Follansbee, WV
Flood risk 9/10 · Severe
- FEMA flood zone
- X (unshaded)
- Chance of flooding over 30 yrs
- 0.99%
- Est. flood insurance / yr
- $473 – $860
Fire risk 1/10 · Minimal
- Est. fire insurance / yr
- $787 – $1,461
Heat risk 3/10 · Minor
- Hot days now (above 97°F)
- 7 days/yr
- Hot days in 30 yrs
- 18 days/yr
Wind risk 1/10 · Minimal
- Chance of severe wind over 30 yrs
- —
Air-quality risk 2/10 · Minimal
- Unhealthy air days now
- 1 days/yr
- Unhealthy air days in 30 yrs
- 2 days/yr
Risk factors via First Street. Map © Google.
Why this score? — see what drove the B grade
The composite is a weighted blend of 9 inputs, each scored 0–100. Each bar is that input's sub-score; the figure is the points it added to the 100-point composite (weight × sub-score).
- Cash flow +30.0/30.0
- 1% rule +10.0/10.0
- DSCR +10.0/10.0
- ARV discount +7.5/15.0
- Appreciation +4.8/10.0
- Livability +3.6/5.0
- Schools +2.6/10.0
- Rent growth +2.5/5.0
- Condition / age +2.5/5.0
$45,000
🖨 Deal sheet 📄 Offer letter ✓ Due diligence
Listing remarks
Calling all investors, flippers, and savvy buyers! Opportunity knocks at 442 Rose St. , Follansbee, WV. This 3-bedroom, 1.5-bath fixer-upper is packed with potential and ready for your vision. Featuring a fenced-in yard and plenty of space to add value, this property is an excellent candidate for a renovation project, rental investment, or affordable home makeover. With the right updates, this hidden gem could truly shine. Property is being sold as-is. All room sizes, square footage, and measurements are approximate and should be independently verified by the buyer.
Key facts
- Rental investment
- Fenced-in yard
- 2,500 sq ft lot
Tags
Property features AI
Exterior
- Utilities: Public water; Public sewer
- Home design: Single-family residence (Traditional); 2 stories
- Construction: Residential construction
- Exterior features: Front porch; Shingle roof
Interior
- Kitchen: Range; Refrigerator
- Bedrooms: Total rooms: 6
- Bathrooms: 1 full bathroom; 1 half bathroom
- Heating & cooling: Natural gas heating; Ceiling fan(s) for cooling
- Interior features: Range, Refrigerator, Gas water heater; Full basement
- Laundry & utility: Gas water heater
Neighborhood map
What this means for you Summary
Snapshot
- This is a 3-bed/2.0-bath single-family listed at $45k.
Deal economics
- At list price, monthly cash flow is $629 ($8k/yr) — positive.
- The deal already cash-flows at list — no discount required.
- Meets the 1% rule at list price ($1k rent vs $45k).
Location & tenants
- Location reads 72/100 on livability (#49 in WV) — a middle-class / working-renter tenant base. Strengths: crime A+, commute A+, cost of living A+; Watch: schools D+, amenities F, employment D-.
- Brooke County Schools (rural): math 26% / reading 35% proficiency, ranked #26 of 55 in WV (top 47%) — families likely to look elsewhere, expect single-tenant / working-renter base with shorter leases.
- Market conditions: 24 active listings in the ZIP; 2 units permitted in Brooke County in 2024 (0 in 5+ unit buildings).
Forward outlook
- In year one you build about $157 of equity ($311 loan paydown + $-154 appreciation (-0.3% local appreciation)).
- Brooke County population projected at -19% by 2050 — secular population decline; favor cash flow + early exit over multi-decade hold.
- At projected returns (-0.3% appreciation + 3.0% rent growth), your $13k cash investment doubles in ~2 years — after that, you're playing with house money.
Negotiation context
- Only 8 days on market — expect competitive offers; lowballing is unlikely to land.
Risks & watch-outs
- Watch-outs: flood insurance adds $56/mo; built in 1930 — expect roof / HVAC / electrical / plumbing capex.
- Climate carrying-cost: severe flood risk — expect insurance premiums to compound above CPI over the hold.
Questions for the listing agent
- Built in 1930 — when were the roof, HVAC, electrical panel, plumbing, and water heater last replaced?
- What's the actual annual flood-insurance premium (NFIP or private), and is the property in a SFHA with mandatory coverage?
- Is there a deadline driving the sale (1031 exchange, divorce, estate, relocation)? That informs how much negotiation room exists.
- Schools are D-rated, which usually means shorter tenancies and higher turnover. Who's the typical renter profile here, and what's been the actual vacancy rate?
- What's the average days-on-market for RENTAL listings here right now (not sales)? A rising rental-DOM trend means longer vacancies and softer asking-rent achievability than the comps imply.
- What's the recent tenant-quality profile in this submarket — average credit score on applications, eviction rate, late-payment / NSF rate, and stable-employment percentage? A property-management company in the area should have these aggregated.
- How much new for-sale + rental construction is in the pipeline within 1–3 miles? Heavy new supply typically softens prices + rents 12–24 months out; constrained supply supports both.
Investment metrics
- 1% rule
- 2.76% ✓
- Cap rate
- 24.55%
- Cash-on-cash
- 65.20%
- DSCR
- 3.90
- GRM
- 3.0
CMA / ARV
- ARV (on-the-fly)
- $135,520
- Comps found
- 6
Show comp detail 6 sales within ~0.75 mi
| Address | Dist | Beds/Ba | Sqft | Sold | Price | $/sf | Match |
|---|---|---|---|---|---|---|---|
| 304 Overlook Dr | 0.25mi | 3/2.0 | 1,760 (+4%) | 12mo | $139,999 | $80 | 72 |
| 766 Clifton St | 0.28mi | 3/2.0 | 1,736 (+2%) | 22mo | $72,000 | $41 | 64 |
| 232 Vine St | 0.41mi | 4/1.0 (+1) | 1,691 (-0%) | 13mo | $155,500 | $92 | 61 |
| 848 Neville St | 0.36mi | 3/1.0 | 1,439 (-15%) | 2mo | $18,000 | $13 | 53 |
| 111 4th St | 0.37mi | 3/2.5 | 1,860 (+10%) | 20mo | $205,000 | $110 | 48 |
| 938 Clifton St | 0.48mi | 2/1.5 (-1) | 1,540 (-9%) | 23mo | $115,000 | $75 | 36 |
Match score weights: distance 35% · size 25% · config 20% · recency 20%. Top-matched comps best support the ARV.
Projected returns pro-forma
-0.34% appreciation · 3.0% rent growth · sell at horizon
- IRR
- 61.4%
- Equity multiple
- 4.02×
- Total profit
- $38,076
- Equity at exit
- $12,301
- IRR
- 63.8%
- Equity multiple
- 8.15×
- Total profit
- $90,031
- Equity at exit
- $14,189
Cash invested: $12,600 (down + closing). Projections, not guarantees.
Landlord ↔ Tenant lean methodology
- Overall (STATE)
- 83 Strongly Landlord-Friendly
- State West Virginia
- 83 Strongly Landlord-Friendly · R+22
- County
- — inherits STATE
- City
- — inherits STATE
ZIP-level market 26037
- Home prices YoY
- -0.2%
- Active inventory
- 24
- Price-to-rent
- 3.0×
Monthly cashflow live
- Estimated rent
- $1,242 medium interval (Pro) →
- Mortgage (P&I)
- −$236
- Tax from tax record
- −$42 /mo · $500/yr
- Insurance
- −$19
- Flood insurance flood zone
- −$56 /mo · $666/yr
- HOA
- −$0
- Vacancy / Maint / Mgmt
- −$261
- Net cashflow
- $629
Break-even live
UW: 25.0% down · 7.5% · 30yr · 1.5% tax · 5.0% vac · 8.0% maint · 8.0% mgmt
Financing live
Cash to close
- Down payment
- $11,250
- Closing costs
- $1,350
- Reserves months
- —
- Total cash needed
- —
Loan-product check · same deal, 3 products live
Conventional
25% down · 7.5% · 30yr
- Down + closing
- —
- Monthly P&I
- —
- Monthly cashflow
- —
- DSCR
- —
- Eligible?
- —
Personal DTI + credit; lowest rate.
DSCR
20% down · 8.5% · 30yr
- Down + closing
- —
- Monthly P&I
- —
- Monthly cashflow
- —
- DSCR
- —
- Eligible?
- —
No personal income docs; deal must DSCR.
Hard money
10% down · 12.0% · 12mo
- Down + closing
- —
- Monthly P&I
- —
- Monthly cashflow
- —
- DSCR
- —
- Eligible?
- —
Short-term bridge; refi at stabilization.
Listing history 9 events
-
2026-06-19days on market $45,000 Active 8 DOM
-
2026-06-18price $45,000 Active 7 DOM
-
2026-06-18days on market $50,000 Active 7 DOM
-
2026-06-17days on market $50,000 Active 6 DOM
-
2026-06-16days on market $50,000 Active 5 DOM
-
2026-06-15days on market $50,000 Active 4 DOM
-
2026-06-14days on market $50,000 Active 2 DOM
-
2026-06-12remarks 572-char remark
-
2026-06-12$50,000 Active 1 DOM
ⓘ Source: listings_history table (triggers on properties + properties_extension) + one-shot
backfill from property_details.listing_events for pre-trigger history.
Tax reassessment forecast WV · Resets to sale price
- Current annual tax
- $500 · $42/mo
- Projected year-2 tax
- $500 · $42/mo
- Expected delta
- $0/yr ($0/mo · 0.0%)
ⓘ Screening estimate from a state-policy table — verify with the county assessor before closing.
Climate risk First Street
- Flood 9/10 Extreme FEMA zone X (unshaded) · 99% chance over 30 yrs
- Wildfire 1/10 Low
- Heat 3/10 Moderate 7 d/yr ≥97°F today · 18 d/yr by 30 yrs out
- Wind 1/10 Low
- Air quality 2/10 Low 1 unhealthy d/yr today · 2 by 30 yrs out
Nearby sold comps map
Loading sold comps map…
Walkable amenities ~0.75 mi
Loading nearby amenities…
Taxation est. · year 1
- Rental income
- $14,902
- − Mortgage interest
- −$2,521
- − Property taxes
- −$500
- − Insurance
- −$891
- − Repairs & maintenance
- −$1,192
- − Management
- −$1,192
- − Depreciation
- −$1,309
- Taxable income
- $7,296
- Est. tax owed @ 24.0%
- −$1,751
- After-tax cash flow
- $5,798/yr
For passive investors: Depreciation is non-cash, so a rental often shows a tax loss while cash-flowing — sheltering income. Rental losses are passive: they offset passive income freely, and up to $25,000/yr can offset ordinary (W-2) income if you actively participate and your MAGI is under $100k (phasing out to $0 by $150k); unused losses carry forward. On sale, claimed depreciation is recaptured at up to 25%, and gains may owe capital-gains tax (a 1031 exchange can defer both). Figures are a year-1 estimate at your 24.0% rate — not tax advice; consult a CPA.
Schools (NCES district)
- District
- Brooke County Schools
- NCES district ID
- 5400150
- Math proficiency
- 26% ▼ -6.00%
- Reading proficiency
- 35% ▲ 1.00%
- Median HH income
- $43,826
- Composite
- 26.0/100
- National rank
- #7319
- State rank
- #26 of 55 in WV
Livability — Follansbee
- Score
- 72/100
- State rank
- #49
- US rank
- #5909
Category grades
Schools grade is shown separately in the Schools card above.
Census & demographics
- Census place
- Follansbee, WV
- City population
- 5,727
- Population (ZIP)
- 5,727
Population outlook (Brooke County) Hauer SSP2
- Today (2025)
- 22,250 people
- By 2030
- 21,459 · -3.6%
- By 2040
- 19,659 · -11.6%
- By 2050
- 18,029 · -19.0%
- By 2075
- 15,076 · -32.2%
- By 2100
- 12,164 · -45.3%
Race, ethnicity, and origin ACS 2023
- Neighborhood character
- Predominantly White (95%)
- Race & ethnicity
- White 95% Two or more races 4% Hispanic / Latino 1%
- Common ancestry
- Romanian 4% Slovak 4% Serbian 3%
- Foreign-born
- 2%
- Languages at home
- 99% English-only · German/W. Germanic 1%
Political lean MEDSL · Brooke
- 2024 margin
- Solid R (+44.6) · D 26.8% · R 71.4% · Other 1.8%
- 2008→2024 swing
- -42.2pp toward R · 2008: -2.5pp · 2024: -44.6pp
- All cycles
- 2024: R+44.6 2020: R+43.1 2016: R+42.2 2012: R+11.2 2008: R+2.5
Not yet ingested
- Civics
- —
Market trends
- HPI YoY
- ▼ -0.34%
- Current HPI
- 219.1118
- Rent YoY
- —
- Metro
- —
- State GDP YoY
- —
- F500 in state
- 0
Price history
1 event — show timeline
- 2026-06-11 Listed $50,000 WBOR
Property tax history
+2.5%/yrLatest (2025): $500 · +3.3% YoY. Source: county tax records.
Cash-flow waterfall
monthlySold comps — $/sqft
last 12 mo · ≤1 miLoading sold comps…