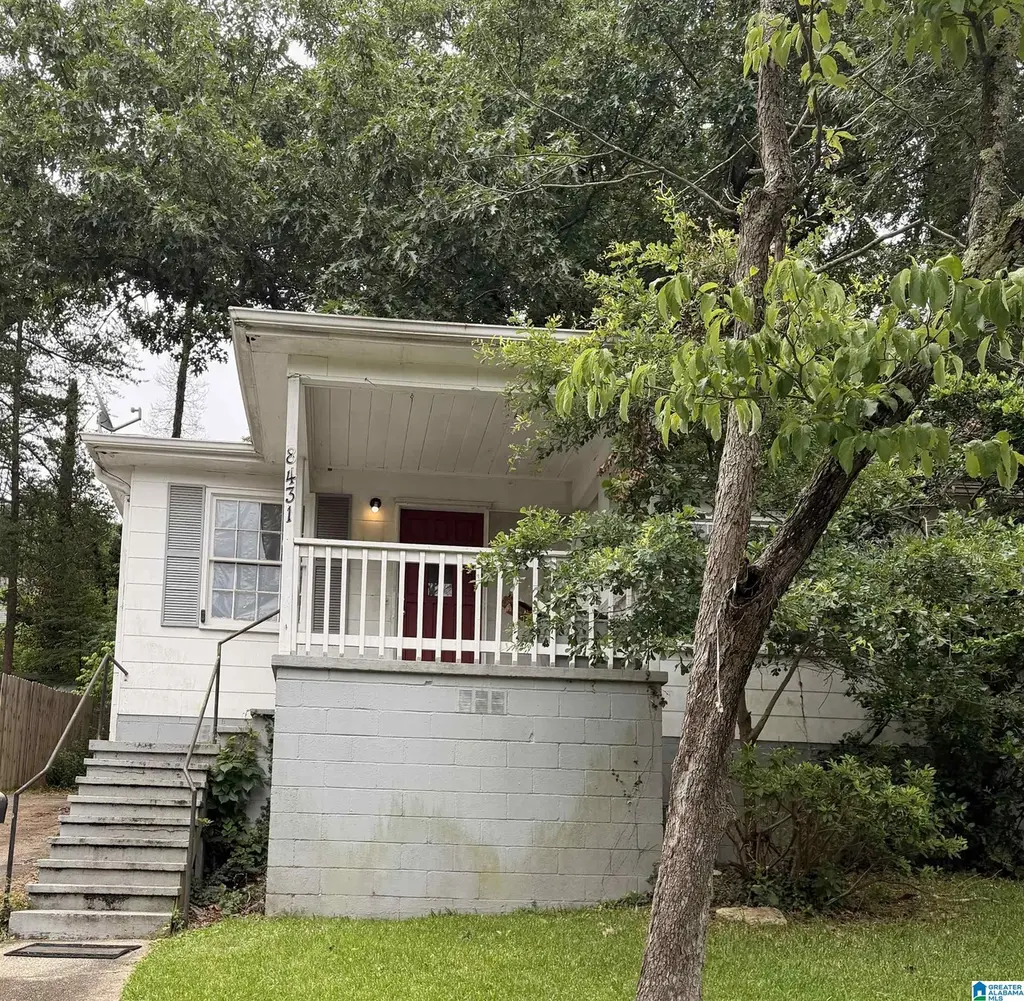
8431 10th Ave S · Birmingham, AL
Flood risk 1/10 · Minimal
- FEMA flood zone
- X (unshaded)
- Chance of flooding over 30 yrs
- 0.0%
- Est. flood insurance / yr
- $507 – $1,088
Fire risk 2/10 · Minimal
- Est. fire insurance / yr
- $916 – $1,700
Heat risk 5/10 · Moderate
- Hot days now (above 106°F)
- 7 days/yr
- Hot days in 30 yrs
- 18 days/yr
Wind risk 6/10 · Moderate
- Chance of severe wind over 30 yrs
- 27.0%
Air-quality risk 5/10 · Moderate
- Unhealthy air days now
- 7 days/yr
- Unhealthy air days in 30 yrs
- 9 days/yr
Risk factors via First Street. Map © Google.
Why this score? — see what drove the C+ grade
The composite is a weighted blend of 9 inputs, each scored 0–100. Each bar is that input's sub-score; the figure is the points it added to the 100-point composite (weight × sub-score).
- Cash flow +30.0/30.0
- 1% rule +10.0/10.0
- DSCR +10.0/10.0
- Livability +3.4/5.0
- Rent growth +3.0/5.0
- Condition / age +2.5/5.0
- ARV discount +1.2/15.0
- Schools +0.9/10.0
- Appreciation +0.0/10.0
$59,000
🖨 Deal sheet (PDF) 📄 Offer letter ✓ Due diligence
Listing remarks
Investor special with great potential! This 925 sq. ft. home has already had some demo work completed, giving you a head start on your next renovation project. Perfect opportunity for investors, flippers, or buyers looking to customize a property to their vision. With solid potential and room for improvement, this home is ready for its transformation. Bring your ideas and make it shine!
Key facts
- 0.28 acre lot
- Built 1953
- Listed 5 days
Property features AI
Finance
- Other: Subdivision: Lakewood; Approximately 0.28 acres
- Financial info: No financial or investor details provided
- HOA & community: No HOA information provided
Exterior
- Parking: Driveway parking
- Security: No security features listed
- Utilities: Public water; Connected sewer; Gas water heater; Internet service availability unknown
- Home design: Existing construction; One-story living areas (rooms listed at level 1)
- Construction: Siding (other); Crawl space foundation
- Exterior features: No waterfront; No pool; No patio; No garden/patio; No decks; Lot view: None noted
Interior
- Kitchen: Kitchen on the main level
- Bedrooms: Three bedrooms on the main level
- Flooring: Hardwood floors
- Bathrooms: One full bathroom
- Heating & cooling: No heat; No air conditioning
- Interior features: Smooth ceilings; No additional interior features listed
- Laundry & utility: Washer hookup; Electric dryer hookup; Laundry located on the main level; Attic present (additional laundry space described as 'Other')
Neighborhood map
What this means for you Summary
Snapshot
- This is a 3-bed/1.0-bath single-family listed at $59k.
Deal economics
- At list price, monthly cash flow is $459 ($6k/yr) — positive.
- The deal already cash-flows at list — no discount required.
- Meets the 1% rule at list price ($1k rent vs $59k).
- Cap rate 15.6% vs local median 6.2% in Birmingham — top-decile yield for the area; either an underpriced asset or a hidden risk that comps aren't pricing in. Stress-test before assuming the spread holds.
Location & tenants
- Location reads 67/100 on livability (#78 in AL) — a middle-class / working-renter tenant base. Strengths: commute A+, cost of living A+, housing A+; Watch: amenities C-, crime F, employment F.
- Birmingham City (urban): math 4% / reading 20% proficiency, ranked #116 of 129 in AL (top 90%) — low school quality limits family demand, transient renter base, plan for 1-2y turnover; 82% free/reduced lunch — lower-income household profile, screen leases tightly.
- Zoned schools: Robinson Elementary School (math 2% / reading 12%, grade F, #601 of 627 statewide, top 98%, 344 students, 85% FRL); Huffman High Schoolmagnet (math 2% / reading 2%, grade F, #291 of 305 statewide, top 100%, 1,147 students, 72% FRL) — zoned schools at 78% FRL track the district average.
- Market conditions: Rents rising (+1.8%/yr); 128 active listings in the ZIP; 37 comparable units currently listed for rent nearby; rentals lingering (median 44d on market — plan ~5-8 weeks vacancy on turnover, expect pricing pressure); 57% of comp listings sitting > 30 days — soft ceiling on asking rent; lower-income renter base — watch delinquency; 2,114 units permitted in Jefferson County in 2024 (556 in 5+ unit buildings).
- This rent runs 32% of the median local income ($43k/yr) — at the standard rent-burdened threshold; future hikes will face affordability resistance.
Forward outlook
- Local home prices are declining (-3.0%/yr); year-one equity from $408 of loan paydown is wiped out by about $2k of value loss. Plan a longer hold.
- Jefferson County population projected to shrink 4% by 2050 — rents likely to lag national; underwrite the cash flow, not the appreciation.
- At projected returns (-3.0% appreciation + 1.8% rent growth), your $17k cash investment doubles in ~4 years — after that, you're playing with house money.
Negotiation context
- Only 5 days on market — expect competitive offers; lowballing is unlikely to land.
Risks & watch-outs
- Watch-outs: built in 1953 — expect roof / HVAC / electrical / plumbing capex.
- Climate carrying-cost: major wind risk, 27% chance of damaging wind over 30y; extreme-heat days projected 7→18/yr by 2055 (HVAC capex compounding) — expect insurance premiums to compound above CPI over the hold.
Questions for the listing agent
- Built in 1953 — when were the roof, HVAC, electrical panel, plumbing, and water heater last replaced?
- Is there a deadline driving the sale (1031 exchange, divorce, estate, relocation)? That informs how much negotiation room exists.
- Schools are F-rated, which usually means shorter tenancies and higher turnover. Who's the typical renter profile here, and what's been the actual vacancy rate?
- Crime grade is F in this area — have there been break-ins, vandalism, or insurance claims at this property in the last 3 years? What carrier currently insures it and at what premium?
- What's the average days-on-market for RENTAL listings here right now (not sales)? A rising rental-DOM trend means longer vacancies and softer asking-rent achievability than the comps imply.
- What's the recent tenant-quality profile in this submarket — average credit score on applications, eviction rate, late-payment / NSF rate, and stable-employment percentage? A property-management company in the area should have these aggregated.
- How much new for-sale + rental construction is in the pipeline within 1–3 miles? Heavy new supply typically softens prices + rents 12–24 months out; constrained supply supports both.
Investment metrics
- 1% rule
- 1.92% ✓
- Cap rate
- 15.62%
- Cash-on-cash
- 33.32%
- DSCR
- 2.48
- GRM
- 4.3
CMA / ARV
- ARV (on-the-fly)
- $51,800
- Comps found
- 12
Show comp detail 12 sales within ~0.75 mi
| Address | Dist | Beds/Ba | Sqft | Sold | Price | $/sf | Match |
|---|---|---|---|---|---|---|---|
| 8609 10th Ave S | 0.13mi | 3/1.0 | 1,040 (+12%) | 6mo | $134,900 | $130 | 68 |
| 429 86th Pl S | 0.59mi | 2/1.0 (-1) | 936 (+1%) | 2mo | $45,000 | $48 | 64 |
| 732 S 84th St | 0.29mi | 3/1.0 | 1,036 (+12%) | 6mo | $65,000 | $63 | 61 |
| 8200 Rugby Ave | 0.58mi | 2/1.0 (-1) | 927 (+0%) | 11mo | $52,000 | $56 | 59 |
| 518 84th St S | 0.56mi | 2/1.0 (-1) | 993 (+7%) | 4mo | $45,500 | $46 | 54 |
| 7808 Vienna Ave | 0.73mi | 2/1.0 (-1) | 904 (-2%) | 5mo | $51,000 | $56 | 53 |
| 8214 6th Ave S | 0.62mi | 3/1.0 | 900 (-3%) | 17mo | $45,000 | $50 | 53 |
| 636 83rd Pl | 0.44mi | 3/1.0 | 1,062 (+15%) | 8mo | $40,000 | $38 | 48 |
| 8215 Rugby Ave | 0.57mi | 3/1.0 | 1,002 (+8%) | 19mo | $95,000 | $95 | 44 |
| 783 80th St | 0.63mi | 2/1.0 (-1) | 1,006 (+9%) | 10mo | $52,000 | $52 | 43 |
| 8334 4th Ave S | 0.70mi | 2/1.0 (-1) | 1,029 (+11%) | 11mo | $128,750 | $125 | 35 |
| 706 80th Pl S | 0.71mi | 2/1.0 (-1) | 828 (-10%) | 13mo | $130,000 | $157 | 34 |
Match score weights: distance 35% · size 25% · config 20% · recency 20%. Top-matched comps best support the ARV.
Projected returns pro-forma
-3.0% appreciation · 1.82% rent growth · sell at horizon
- IRR
- 27.2%
- Equity multiple
- 2.11×
- Total profit
- $18,357
- Equity at exit
- $8,797
- IRR
- 34.0%
- Equity multiple
- 3.93×
- Total profit
- $48,417
- Equity at exit
- $5,101
Cash invested: $16,520 (down + closing). Projections, not guarantees.
Landlord ↔ Tenant lean methodology
- Overall (STATE)
- 90 Strongly Landlord-Friendly
- State Alabama
- 90 Strongly Landlord-Friendly · R+15
- County
- — inherits STATE
- City
- — inherits STATE
ZIP-level market 35206
- Home prices YoY
- -32.0%
- Rents YoY
- 1.8%
- Active inventory
- 128
- Price-to-rent
- 4.3×
Monthly cashflow live
- Estimated rent
- $1,131 high interval (Pro) →
- Mortgage (P&I)
- −$309
- Tax from tax record
- −$101 /mo · $1,211/yr
- Insurance
- −$25
- HOA
- −$0
- Vacancy / Maint / Mgmt
- −$238
- Net cashflow
- $459
Break-even live
Sensitivity live
| Price | -10% $492 | -5% $475 | +0% $459 | +5% $442 | +10% $425 |
|---|---|---|---|---|---|
| Rent | -10% $369 | -5% $414 | +0% $459 | +5% $503 | +10% $548 |
| Rate | -1.0pp $488 | -0.5pp $474 | base $459 | +0.5pp $443 | +1.0pp $428 |
UW: 25.0% down · 7.5% · 30yr · 1.5% tax · 5.0% vac · 8.0% maint · 8.0% mgmt
Financing live
Cash to close
- Down payment
- $14,750
- Closing costs
- $1,770
- Reserves months
- —
- Total cash needed
- —
Loan-product check · same deal, 3 products live
Conventional
25% down · 7.5% · 30yr
- Down + closing
- —
- Monthly P&I
- —
- Monthly cashflow
- —
- DSCR
- —
- Eligible?
- —
Personal DTI + credit; lowest rate.
DSCR
20% down · 8.5% · 30yr
- Down + closing
- —
- Monthly P&I
- —
- Monthly cashflow
- —
- DSCR
- —
- Eligible?
- —
No personal income docs; deal must DSCR.
Hard money
10% down · 12.0% · 12mo
- Down + closing
- —
- Monthly P&I
- —
- Monthly cashflow
- —
- DSCR
- —
- Eligible?
- —
Short-term bridge; refi at stabilization.
Rent comps 37 comps
| Address | Beds | Baths | Sqft | Rent | $/sqft | DOM | Units | Dist |
|---|---|---|---|---|---|---|---|---|
| 8229 9th Ave S Birmingham, AL | 2.0 | 1.0 | 997 | $1,195 | $1.20 | 3d | 1 | 0.30mi |
| 636 83rd Pl S Birmingham, AL | 2.0 | 2.0 | 1062 | $1,175 | $1.11 | 44d | 1 | 0.42mi |
| 624 83rd Pl S Birmingham, AL | 2.0 | 1.0 | 780 | $975 | $1.25 | 44d | 1 | 0.45mi |
| 730 82nd Pl S Birmingham, AL | 3.0 | 1.0 | 896 | $1,023 | $1.14 | 3d | 1 | 0.45mi |
| 8122 Rugby Ave Unit B Birmingham, AL | 2.0 | 1.0 | 900 | $795 | $0.88 | 44d | 1 | 0.54mi |
| 8211 Rugby Ave Birmingham, AL | 4.0 | 1.0 | 966 | $1,250 | $1.29 | 44d | 1 | 0.54mi |
| 764 81st St S Unit B Birmingham, AL | 2.0 | 1.0 | 800 | $800 | $1.00 | 44d | 1 | 0.57mi |
| 8408 5th Ave S Birmingham, AL | 3.0 | 1.0 | 1100 | $1,528 | $1.39 | 44d | 1 | 0.58mi |
| 8408 5th Ave S Birmingham, AL | 3.0 | 1.0 | 890 | $1,295 | $1.46 | 11d | 1 | 0.58mi |
| 425 87th St S Birmingham, AL | 2.0 | 1.0 | 890 | $1,077 | $1.21 | 44d | 1 | 0.58mi |
| 832 79th Pl S Birmingham, AL | 3.0 | 1.0 | 960 | $1,250 | $1.30 | 24d | 1 | 0.69mi |
| 7808 Vienna Ave Birmingham, AL | 2.0 | 1.0 | 904 | $850 | $0.94 | 44d | 1 | 0.74mi |
| 7825 Rugby Ct Birmingham, AL | 2.0 | 1.0 | 929 | $875 | $0.94 | 21d | 1 | 0.83mi |
| 8035 4th Ave S Birmingham, AL | 3.0 | 2.0 | 1096 | $1,050 | $0.96 | 44d | 1 | 0.83mi |
| 8240 2nd Ave S Birmingham, AL | 2.0 | 1.0 | 990 | $875 | $0.88 | 24d | 1 | 0.85mi |
| 7823 Rugby Ave Birmingham, AL | 3.0 | 1.0 | 1023 | $1,175 | $1.15 | 44d | 1 | 0.85mi |
| 8129 2nd Ave S Unit B Birmingham, AL | 2.0 | 1.0 | 900 | $800 | $0.89 | 44d | 1 | 0.89mi |
| 836 Vanderbilt St Birmingham, AL | 3.0 | 1.0 | 1072 | $850 | $0.79 | 24d | 1 | 0.92mi |
| 756 Vanderbilt St Birmingham, AL | 3.0 | 2.0 | 1096 | $1,000 | $0.91 | 44d | 1 | 0.97mi |
| 8021 1st Ave S Unit A Birmingham, AL | 3.0 | 1.0 | 980 | $950 | $0.97 | 24d | 1 | 1.03mi |
| 7829 3rd Ave S Birmingham, AL | 3.0 | 1.5 | 1005 | $1,025 | $1.02 | 44d | 1 | 1.04mi |
| 7740 Rugby Ave Unit 2 Birmingham, AL | 2.0 | 1.0 | 800 | $1,000 | $1.25 | 44d | 1 | 1.07mi |
| 7740 Rugby Ave Unit b Birmingham, AL | 2.0 | 1.0 | 800 | $1,100 | $1.38 | 44d | 1 | 1.07mi |
| 8917 Roebuck Blvd Apt 11 Birmingham, AL | 2.0 | 1.0 | 880 | $725 | $0.82 | 16d | 1 | 1.09mi |
| 7801 3rd Ave S Unit B Birmingham, AL | 2.0 | 1.5 | 1100 | $1,000 | $0.91 | 44d | 1 | 1.10mi |
| 7701 7th Ave S Birmingham, AL | 2.0 | 1.0 | 800 | $850 | $1.06 | 24d | 1 | 1.10mi |
| 7728 Rugby Ave Birmingham, AL | 2.0 | 1.0 | 700 | $850 | $1.21 | 44d | 1 | 1.11mi |
| 7341 Rome Ave Birmingham, AL | 3.0 | 1.0 | 1000 | $1,300 | $1.30 | 44d | 1 | 1.14mi |
| 7341 Rome Ave Birmingham, AL | 3.0 | 1.0 | 1000 | $1,275 | $1.27 | 3d | 1 | 1.14mi |
| 630 77th St S Birmingham, AL | 2.0 | 2.0 | 1100 | $983 | $0.89 | 3d | 1 | 1.16mi |
| 7404 Paris Ave Birmingham, AL | 3.0 | 1.5 | 802 | $1,200 | $1.50 | 44d | 1 | 1.19mi |
| 7313 Paris Ave Birmingham, AL | 3.0 | 2.0 | 1000 | $1,395 | $1.40 | 3d | 1 | 1.26mi |
| 7721 1st Ave S Birmingham, AL | 3.0 | 1.0 | 956 | $949 | $0.99 | 24d | 1 | 1.28mi |
| 7728 1st Ave S Apt C Birmingham, AL | 2.0 | 1.0 | 950 | $950 | $1.00 | 44d | 1 | 1.30mi |
| 7216 Paris Ave Birmingham, AL | 3.0 | 1.5 | 966 | $1,125 | $1.16 | 19d | 1 | 1.37mi |
| 7213 Naples Ave Birmingham, AL | 3.0 | 1.5 | 937 | $1,100 | $1.17 | 12d | 1 | 1.43mi |
| 7213 Naples Ave Birmingham, AL | 3.0 | 1.5 | 925 | $1,100 | $1.19 | 44d | 1 | 1.43mi |
Listing history 4 events
-
2026-06-07statusdays on market $59,000 Pending 5 DOM
-
2026-06-03days on market $59,000 Active 4 DOM
-
2026-06-02days on market $59,000 Active 3 DOM
-
2026-06-01days on market $59,000 Active 2 DOM
ⓘ Source: listings_history table (triggers on properties + properties_extension) + one-shot
backfill from property_details.listing_events for pre-trigger history.
Tax reassessment forecast AL · Resets to sale price
- Current annual tax
- $1,211 · $101/mo
- Projected year-2 tax
- $1,211 · $101/mo
- Expected delta
- $0/yr ($0/mo · 0.0%)
ⓘ Screening estimate from a state-policy table — verify with the county assessor before closing.
Climate risk First Street
- Flood 1/10 Low FEMA zone X (unshaded) · 0% chance over 30 yrs
- Wildfire 2/10 Low
- Heat 5/10 Major 7 d/yr ≥106°F today · 18 d/yr by 30 yrs out
- Wind 6/10 Major 27% chance of damaging wind over 30 yrs
- Air quality 5/10 Major 7 unhealthy d/yr today · 9 by 30 yrs out
Nearby sold comps map
Loading sold comps map…
Walkable amenities ~0.75 mi
Loading nearby amenities…
Taxation est. · year 1
- Rental income
- $13,572
- − Mortgage interest
- −$3,305
- − Property taxes
- −$1,211
- − Insurance
- −$295
- − Repairs & maintenance
- −$1,086
- − Management
- −$1,086
- − Depreciation
- −$1,716
- Taxable income
- $4,874
- Est. tax owed @ 24.0%
- −$1,170
- After-tax cash flow
- $4,334/yr
For passive investors: Depreciation is non-cash, so a rental often shows a tax loss while cash-flowing — sheltering income. Rental losses are passive: they offset passive income freely, and up to $25,000/yr can offset ordinary (W-2) income if you actively participate and your MAGI is under $100k (phasing out to $0 by $150k); unused losses carry forward. On sale, claimed depreciation is recaptured at up to 25%, and gains may owe capital-gains tax (a 1031 exchange can defer both). Figures are a year-1 estimate at your 24.0% rate — not tax advice; consult a CPA.
Schools (NCES district)
- District
- Birmingham City
- NCES district ID
- 0100390
- Math proficiency
- 4% ▼ -17.00%
- Reading proficiency
- 20% ▼ -4.00%
- Median HH income
- $31,988
- Composite
- 9.49/100
- National rank
- #9850
- State rank
- #116 of 129 in AL
Livability — Birmingham
- Score
- 67/100
- State rank
- #78
- US rank
- #10412
Category grades
Schools grade is shown separately in the Schools card above.
Census & demographics
- Census place
- Birmingham, AL
- County
- Jefferson County · 527,445 people
- City population
- 210,422
- Metro
- Birmingham-Hoover, AL
- Population (ZIP)
- 15,621
- Household income
- $42,549
- Rent vs Own
- Severe rent burden
- 1169.0
Population outlook (Jefferson County) Hauer SSP2
- Today (2025)
- 669,185 people
- By 2030
- 669,694 · +0.1%
- By 2040
- 661,388 · -1.2%
- By 2050
- 643,086 · -3.9%
- By 2075
- 577,267 · -13.7%
- By 2100
- 474,758 · -29.1%
Race, ethnicity, and origin ACS 2023
- Neighborhood character
- Predominantly Black (73%)
- Race & ethnicity
- Black 73% White 22% Two or more races 3% Hispanic / Latino 2%
- Common ancestry
- Slovak 1%
- Foreign-born
- 3% · Canada
- Languages at home
- 97% English-only · Spanish 2% Other Indo-European 0%
Political lean MEDSL · Jefferson
- 2024 margin
- D (+10.4) · D 54.6% · R 44.2% · Other 1.2%
- 2008→2024 swing
- +5.4pp toward D · 2008: 5.1pp · 2024: 10.4pp
- All cycles
- 2024: D+10.4 2020: D+13.2 2016: D+7.2 2012: D+6.0 2008: D+5.1
Not yet ingested
- Civics
- —
Market trends
- HPI YoY
- ▼ -68.70%
- Current HPI
- 146.2168
- Rent YoY
- ▲ 1.82%
- Metro
- Birmingham-Hoover, AL
- State GDP YoY
- ▲ 2.94%
- F500 in state
- 4
Industry mix (Fortune 500 HQ in AL)
| Industry | F500 HQs | Revenue |
|---|---|---|
| Financial Services | 1 | $8B |
|
||
| Healthcare | 1 | $5B |
|
||
Price history
+60.0% since first listed6 events — show timeline
- 2026-05-30 Listed $59,000 Greater Alabama MLS
- 2013-12-02 Sold (Public Records) $136,600 Public Records
- 2010-10-01 Sold (Public Records) $10,300 Public Records
- 2010-10-01 Sold (Public Records) $10,300 Public Records
- 1993-04-30 Sold (Public Records) $32,390 Public Records
- 1980-06-01 Sold (Public Records) $36,875 Public Records
Property tax history
+5.1%/yrLatest (2025): $1,211 · +2.6% YoY. Source: county tax records.
Cash-flow waterfall
monthlySold comps — $/sqft
last 12 mo · ≤1 miLoading sold comps…