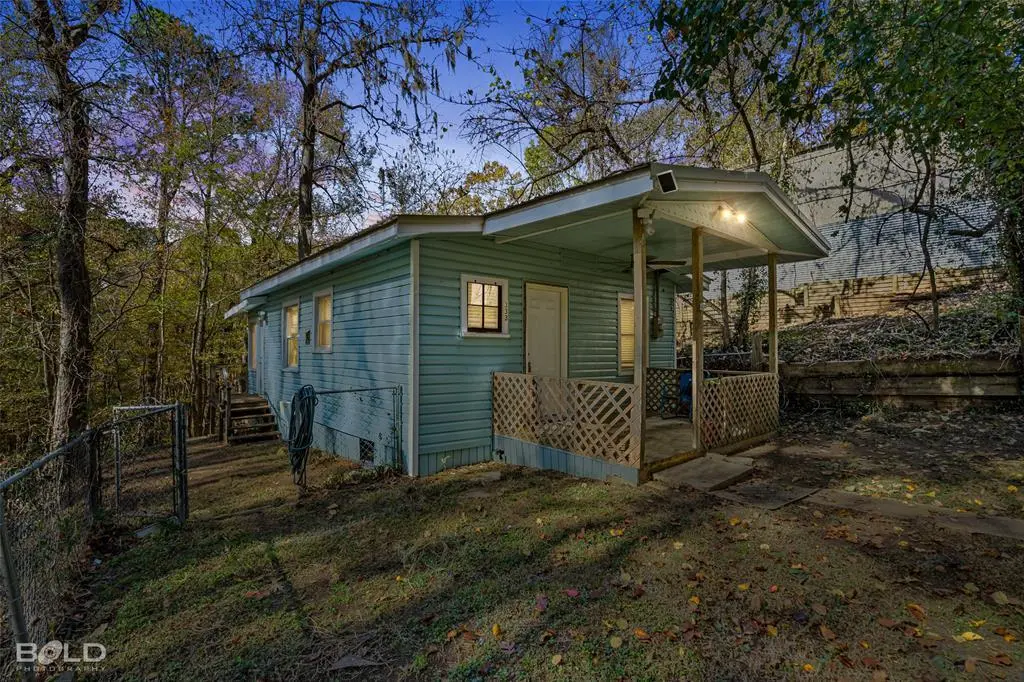
333 Canal St · Ringgold, LA
Flood risk 1/10 · Minimal
- FEMA flood zone
- X (unshaded)
- Chance of flooding over 30 yrs
- 0.0%
- Est. flood insurance / yr
- $507 – $1,088
Fire risk 4/10 · Minor
- Est. fire insurance / yr
- $1,269 – $2,357
Heat risk 7/10 · Major
- Hot days now (above 110°F)
- 7 days/yr
- Hot days in 30 yrs
- 22 days/yr
Wind risk 6/10 · Moderate
- Chance of severe wind over 30 yrs
- 70.0%
Air-quality risk 1/10 · Minimal
- Unhealthy air days now
- 0 days/yr
- Unhealthy air days in 30 yrs
- 0 days/yr
Risk factors via First Street. Map © Google.
Why this score? — see what drove the B+ grade
The composite is a weighted blend of 9 inputs, each scored 0–100. Each bar is that input's sub-score; the figure is the points it added to the 100-point composite (weight × sub-score).
- Cash flow +30.0/30.0
- ARV discount +15.0/15.0
- DSCR +10.0/10.0
- 1% rule +8.8/10.0
- Appreciation +5.0/10.0
- Livability +2.8/5.0
- Schools +2.6/10.0
- Rent growth +2.5/5.0
- Condition / age +2.5/5.0
$55,000
🖨 Deal sheet 📄 Offer letter ✓ Due diligence
Listing remarks
This cozy 1-bed, 1-bath updated camp house offers a serene retreat near Lake Bistineau. With an open-concept layout, the space is flooded with natural light, and the main area boasts sleek vinyl flooring. The updated bathroom features a new vanity and lighting, enhancing its modern appeal. A full kitchen provides all the essentials, while recent upgrades include a new 40-gallon water heater (installed November 2023), all-new plumbing (January 2023), and a new wood stove (November 2023) for added comfort.
Key facts
- New lighting
- Vinyl flooring
- New vanity
Tags
Property features AI
Finance
- HOA & community: No HOA
Exterior
- Parking: Gravel parking
- Utilities: City water; Electricity available; Septic
- Home design: Single-family residence; Residential property; One story; Not attached
- Construction: Built in 1967; Metal roof
- Exterior features: Many trees on the lot
Interior
- Kitchen: Microwave; Refrigerator; Eat-in kitchen
- Bedrooms: Primary bedroom on main level; 1 bedroom total
- Flooring: Vinyl flooring
- Bathrooms: 1 full bathroom
- Interior features: Open floorplan; Eat-in kitchen; Decorative lighting; Cable TV available; High-speed internet available; 3 total rooms; 1 living area; 1 dining area; One-level layout
- Laundry & utility: Washer; Dryer
Neighborhood map
What this means for you Summary
Snapshot
- This is a 1-bed/1.0-bath single-family listed at $55k.
Deal economics
- At list price, monthly cash flow is $225 ($3k/yr) — positive.
- The deal already cash-flows at list — no discount required.
- Meets the 1% rule at list price ($759 rent vs $55k).
- Recommended offer: $53k (3.0% below list) — sets the bar for market timing.
Location & tenants
- Location reads 56/100 on livability (#336 in LA) — a working-class tenant base; expect higher turnover. Strengths: cost of living A+, housing A-; Watch: schools D, amenities F, commute F.
- Bienville Parish (rural): math 27% / reading 37% proficiency, ranked #42 of 98 in LA (top 43%) — families likely to look elsewhere, expect single-tenant / working-renter base with shorter leases; 66% free/reduced lunch — lower-income household profile, screen leases tightly.
- Market conditions: 10 active listings in the ZIP; 18 units permitted in Bienville Parish in 2024 (0 in 5+ unit buildings).
Forward outlook
- In year one you build about $2k of equity ($380 loan paydown + $2k appreciation (3.0% local appreciation)).
- Bienville County population projected at -19% by 2050 — secular population decline; favor cash flow + early exit over multi-decade hold.
- At projected returns (3.0% appreciation + 3.0% rent growth), your $15k cash investment doubles in ~4 years — after that, you're playing with house money.
Negotiation context
- It's been on market 38 days — a 3% lower offer ($53k) is reasonable based on typical stale-listing flexibility.
- 8 sale attempts since 5y ago with the ask held roughly flat each time — persistent listings suggest the price (not the market) is what's stuck; bring a comps-based counter.
Risks & watch-outs
- Climate carrying-cost: major wind risk, 70% chance of damaging wind over 30y; extreme-heat days projected 7→22/yr by 2055 (HVAC capex compounding) — expect insurance premiums to compound above CPI over the hold.
Questions for the listing agent
- It's been on market 38 days. Have you received any prior offers? Is the seller open to a 3% concession, seller financing, or rate buy-down credit?
- Built in 1967 — when were the roof, HVAC, electrical panel, plumbing, and water heater last replaced?
- Is there a deadline driving the sale (1031 exchange, divorce, estate, relocation)? That informs how much negotiation room exists.
- Schools are D-rated, which usually means shorter tenancies and higher turnover. Who's the typical renter profile here, and what's been the actual vacancy rate?
- What's the average days-on-market for RENTAL listings here right now (not sales)? A rising rental-DOM trend means longer vacancies and softer asking-rent achievability than the comps imply.
- What's the recent tenant-quality profile in this submarket — average credit score on applications, eviction rate, late-payment / NSF rate, and stable-employment percentage? A property-management company in the area should have these aggregated.
- How much new for-sale + rental construction is in the pipeline within 1–3 miles? Heavy new supply typically softens prices + rents 12–24 months out; constrained supply supports both.
Investment metrics
- 1% rule
- 1.38% ✓
- Cap rate
- 11.20%
- Cash-on-cash
- 17.53%
- DSCR
- 1.78
- GRM
- 6.0
CMA / ARV
- ARV (median comp)
- $80,779
- List price
- $55,000
- Delta
- -31.91%
- Verdict
- UNDERPRICED
- Comps
- 2 within 1.0 mi
Projected returns pro-forma
3.0% appreciation · 3.0% rent growth · sell at horizon
- IRR
- 24.0%
- Equity multiple
- 2.36×
- Total profit
- $20,959
- Equity at exit
- $24,730
- IRR
- 24.8%
- Equity multiple
- 4.54×
- Total profit
- $54,556
- Equity at exit
- $38,112
Cash invested: $15,400 (down + closing). Projections, not guarantees.
Landlord ↔ Tenant lean methodology
- Overall (STATE)
- 90 Strongly Landlord-Friendly
- State Louisiana
- 90 Strongly Landlord-Friendly · R+12
- County
- — inherits STATE
- City
- — inherits STATE
ZIP-level market 71068
- Active inventory
- 10
- Price-to-rent
- 6.0×
Monthly cashflow live
- Estimated rent
- $759 medium interval (Pro) →
- Mortgage (P&I)
- −$288
- Tax from tax record
- −$63 /mo · $756/yr
- Insurance
- −$23
- HOA
- −$0
- Vacancy / Maint / Mgmt
- −$159
- Net cashflow
- $225
Break-even live
UW: 25.0% down · 7.5% · 30yr · 1.5% tax · 5.0% vac · 8.0% maint · 8.0% mgmt
Financing live
Cash to close
- Down payment
- $13,750
- Closing costs
- $1,650
- Reserves months
- —
- Total cash needed
- —
Loan-product check · same deal, 3 products live
Conventional
25% down · 7.5% · 30yr
- Down + closing
- —
- Monthly P&I
- —
- Monthly cashflow
- —
- DSCR
- —
- Eligible?
- —
Personal DTI + credit; lowest rate.
DSCR
20% down · 8.5% · 30yr
- Down + closing
- —
- Monthly P&I
- —
- Monthly cashflow
- —
- DSCR
- —
- Eligible?
- —
No personal income docs; deal must DSCR.
Hard money
10% down · 12.0% · 12mo
- Down + closing
- —
- Monthly P&I
- —
- Monthly cashflow
- —
- DSCR
- —
- Eligible?
- —
Short-term bridge; refi at stabilization.
Listing history 38 events
-
2026-06-19days on market $55,000 Active 38 DOM
-
2026-06-18days on market $55,000 Active 37 DOM
-
2026-06-17days on market $55,000 Active 36 DOM
-
2026-06-16days on market $55,000 Active 35 DOM
-
2026-06-15days on market $55,000 Active 34 DOM
-
2026-06-14days on market $55,000 Active 32 DOM
-
2026-06-12days on market $55,000 Active 31 DOM
-
2026-06-09days on market $55,000 Active 28 DOM
-
2026-06-09price $55,000 Active 27 DOM
-
2026-06-08days on market $57,000 Active 27 DOM
-
2026-06-07days on market $57,000 Active 26 DOM
-
2026-06-05days on market $57,000 Active 23 DOM
-
2026-06-03days on market $57,000 Active 22 DOM
-
2026-06-02days on market $57,000 Active 21 DOM
-
2026-06-01days on market $57,000 Active 20 DOM
-
2026-05-31days on market $57,000 Active 19 DOM
-
2026-05-30days on market $57,000 Active 18 DOM
-
2026-05-12$57,000 Active 509-char remark
-
2026-05-11historical
-
2026-05-11$57,000 Active
-
2026-04-30historical
-
2026-03-03price $57,000
-
2025-10-24$62,500 Active
-
2025-09-30historical
-
2025-03-03$62,500 Active
-
2025-02-28historical
-
2024-12-19price $62,500
-
2024-09-10$65,000 Active
-
2024-09-02historical
-
2024-08-16status Active
-
2024-08-13historical
-
2024-07-05price $65,000
-
2024-04-19price $68,500
-
2023-12-18$70,000 Active
-
2022-02-02soldstatus $62,500
-
2022-01-24soldstatus Sold
-
2021-12-21historical Active Contingent
-
2021-12-02$65,000 Active
ⓘ Source: listings_history table (triggers on properties + properties_extension) + one-shot
backfill from property_details.listing_events for pre-trigger history.
Tax reassessment forecast LA · Resets to sale price
- Current annual tax
- $756 · $63/mo
- Projected year-2 tax
- $756 · $63/mo
- Expected delta
- $0/yr ($0/mo · 0.0%)
ⓘ Screening estimate from a state-policy table — verify with the county assessor before closing.
Climate risk First Street
- Flood 1/10 Low FEMA zone X (unshaded) · 0% chance over 30 yrs
- Wildfire 4/10 Moderate
- Heat 7/10 Severe 7 d/yr ≥110°F today · 22 d/yr by 30 yrs out
- Wind 6/10 Major 70% chance of damaging wind over 30 yrs
- Air quality 1/10 Low 0 unhealthy d/yr today · 0 by 30 yrs out
Nearby sold comps map
Loading sold comps map…
Walkable amenities ~0.75 mi
Loading nearby amenities…
Taxation est. · year 1
- Rental income
- $9,103
- − Mortgage interest
- −$3,081
- − Property taxes
- −$756
- − Insurance
- −$275
- − Repairs & maintenance
- −$728
- − Management
- −$728
- − Depreciation
- −$1,600
- Taxable income
- $1,935
- Est. tax owed @ 24.0%
- −$464
- After-tax cash flow
- $2,235/yr
For passive investors: Depreciation is non-cash, so a rental often shows a tax loss while cash-flowing — sheltering income. Rental losses are passive: they offset passive income freely, and up to $25,000/yr can offset ordinary (W-2) income if you actively participate and your MAGI is under $100k (phasing out to $0 by $150k); unused losses carry forward. On sale, claimed depreciation is recaptured at up to 25%, and gains may owe capital-gains tax (a 1031 exchange can defer both). Figures are a year-1 estimate at your 24.0% rate — not tax advice; consult a CPA.
Schools (NCES district)
- District
- Bienville Parish
- NCES district ID
- 2200210
- Math proficiency
- 27% ▼ -35.00%
- Reading proficiency
- 37% ▼ -29.00%
- Median HH income
- $31,737
- Composite
- 26.08/100
- National rank
- #7296
- State rank
- #42 of 98 in LA
Livability — Ringgold
- Score
- 56/100
- State rank
- #336
- US rank
- #22547
Category grades
Schools grade is shown separately in the Schools card above.
Census & demographics
- Population (ZIP)
- 3,325
Population outlook (Bienville County) Hauer SSP2
- Today (2025)
- 13,109 people
- By 2030
- 12,626 · -3.7%
- By 2040
- 11,620 · -11.4%
- By 2050
- 10,647 · -18.8%
- By 2075
- 8,555 · -34.7%
- By 2100
- 6,717 · -48.8%
Race, ethnicity, and origin ACS 2023
- Neighborhood character
- Majority White (60%)
- Race & ethnicity
- White 60% Black 34% Hispanic / Latino 4% Two or more races 2%
- Common ancestry
- Lithuanian 3% Serbian 2% Italian 1%
- Foreign-born
- 1% · Canada
- Languages at home
- 95% English-only · Spanish 4% Other Indo-European 1%
Political lean MEDSL · Bienville
- 2024 margin
- R (+18.0) · D 40.5% · R 58.5% · Other 1.0%
- 2008→2024 swing
- -15.5pp toward R · 2008: -2.5pp · 2024: -18.0pp
- All cycles
- 2024: R+18.0 2020: R+11.7 2016: R+8.9 2012: R+2.1 2008: R+2.5
Not yet ingested
- Civics
- —
Market trends
- HPI YoY
- —
- Current HPI
- —
- Rent YoY
- —
- Metro
- —
- State GDP YoY
- ▲ 3.29%
- F500 in state
- 10
Industry mix (Fortune 500 HQ in LA)
| Industry | F500 HQs | Revenue |
|---|---|---|
| Telecommunications | 2 | $23B |
|
||
| Utilities | 1 | $12B |
|
||
| Wholesale / Distribution | 1 | $5B |
|
||
| Advertising | 1 | $2B |
|
||
Price history
-15.4% since first listed22 events — show timeline
- 2026-06-08 Price Changed $55,000 NTREIS
- 2026-05-12 Listed $57,000 NTREIS
- 2026-05-11 Listed $57,000 NTREIS
- 2026-05-11 Listing Removed — NTREIS
- 2026-04-30 Listing Removed — NTREIS
- 2026-03-03 Price Changed $57,000 NTREIS
- 2025-10-24 Listed $62,500 NTREIS
- 2025-09-30 Listing Removed — NTREIS
- 2025-03-03 Listed $62,500 NTREIS
- 2025-02-28 Listing Removed — NTREIS
- 2024-12-19 Price Changed $62,500 NTREIS
- 2024-09-10 Listed $65,000 NTREIS
- 2024-09-02 Listing Removed — NTREIS
- 2024-08-16 Relisted — NTREIS
- 2024-08-13 Listing Removed — NTREIS
- 2024-07-05 Price Changed $65,000 NTREIS
- 2024-04-19 Price Changed $68,500 NTREIS
- 2023-12-18 Listed $70,000 NTREIS
- 2022-02-02 Sold (Public Records) $62,500 Public Records
- 2022-01-24 Sold (MLS) — NTREIS
- 2021-12-21 Contingent — NTREIS
- 2021-12-02 Listed $65,000 NTREIS
Property tax history
+19.6%/yrLatest (2024): $756 · +162.7% YoY. Source: county tax records.
Cash-flow waterfall
monthlySold comps — $/sqft
last 12 mo · ≤1 miLoading sold comps…