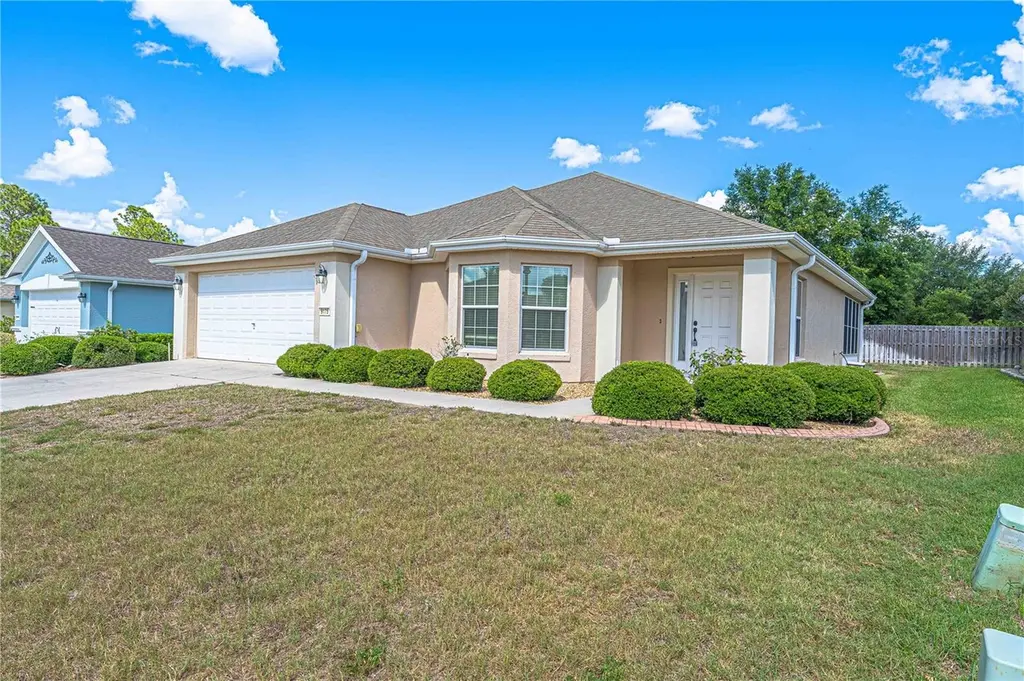
9175 SE 118th Loop · Silver Springs Shores, FL
Flood risk 1/10 · Minimal
- FEMA flood zone
- X (unshaded)
- Chance of flooding over 30 yrs
- 0.0%
- Est. flood insurance / yr
- $507 – $1,088
Fire risk 5/10 · Moderate
- Est. fire insurance / yr
- $947 – $1,759
Heat risk 9/10 · Severe
- Hot days now (above 109°F)
- 7 days/yr
- Hot days in 30 yrs
- 22 days/yr
Wind risk 9/10 · Severe
- Chance of severe wind over 30 yrs
- 99.0%
Air-quality risk 3/10 · Minor
- Unhealthy air days now
- 2 days/yr
- Unhealthy air days in 30 yrs
- 2 days/yr
Risk factors via First Street. Map © Google.
Why this score? — see what drove the D- grade
The composite is a weighted blend of 9 inputs, each scored 0–100. Each bar is that input's sub-score; the figure is the points it added to the 100-point composite (weight × sub-score).
- ARV discount +15.0/15.0
- Cash flow +7.8/30.0
- Schools +3.6/10.0
- Livability +3.4/5.0
- 1% rule +2.9/10.0
- Rent growth +2.5/5.0
- Condition / age +2.5/5.0
- DSCR +1.9/10.0
- Appreciation +0.0/10.0
$239,990
🖨 Deal sheet 📄 Offer letter ✓ Due diligence
Listing remarks
Seller is Motivated with an Affordable Home! Welcome to Summerfield, Florida! NEW ROOF and Home Appliance Warranty with American Home Shield for extra peace of mind. This move-in ready 2-bedroom, 2-bath home with a 2-car garage features recent updates include a NEW ROOF, updated kitchen cabinets fixtures, NEW water heater, newer appliances, and a Lennox HVAC system (2020). Inside, you’ll find no carpet, an eat-in kitchen, formal dining room, spacious family room, and an inside laundry room. New owners have the option of acquiring the home: Furnished or Unfurnished! The enclosed lanai with glass windows and screens is perfect for relaxing and enjoying Florida’s seasonal breezes y
Key facts
- Lennox hvac system
- New roof
- Indoor lap pool
Tags
Property features AI
Finance
- Other: Property type: Residential, Single Family Residence; Lot dimensions approximately 60 x 100 (0.14 acres); Living area reported as 1,488 square feet; Building area total reported as 2,168 square feet; Property listed as furnished; No CDD; Zoning: PUD
- Financial info: Total annual association fees: $2,532
- HOA & community: HOA managed by LELAND MANAGEMENT; Monthly HOA fee of $211; Association amenities: Clubhouse, Pool, Gated community; Pets allowed: Cats and dogs; Senior community
Exterior
- Parking: Attached garage with 2 spaces
- Security: Gated community
- Utilities: Private water; Private sewer; Electricity connected; Cable available; Other utilities available
- Home design: Single-family residence; Planned Unit Development (PUD); One story; Faces west; Entry level: One
- Construction: Block construction; Shingle roof; Block foundation; Built as single-story
- Exterior features: Sliding doors; Paved road access
Interior
- Kitchen: Cooktop; Dishwasher; Refrigerator
- Bedrooms: 2 bedrooms
- Flooring: Laminate flooring; Tile flooring
- Bathrooms: 2 full bathrooms
- Heating & cooling: Central heating; Central air conditioning
- Interior features: Ceiling fans; Open floor plan
- Laundry & utility: Dedicated laundry room
Neighborhood map
What this means for you Summary
Snapshot
- This is a 2-bed/2.0-bath single-family listed at $240k.
Deal economics
- At list price, monthly cash flow is $-265 ($-3k/yr) — negative.
- To cash-flow at today's rent, offer at most $193k (19.5% below list).
- To meet the 1% rule (rent ≥ 1% of price), the offer needs to be $189k (21.4% below list).
- Recommended offer: $189k (21.4% below list) — sets the bar for 1% rule.
Location & tenants
- Location reads 68/100 on livability (#527 in FL) — a middle-class / working-renter tenant base. Strengths: cost of living A+, housing A+, health & safety A-; Watch: crime C-, employment D, schools F.
- Marion (rural): math 42% / reading 43% proficiency, ranked #61 of 73 in FL (top 84%) — families likely to look elsewhere, expect single-tenant / working-renter base with shorter leases; 61% free/reduced lunch — lower-income household profile, screen leases tightly.
- Market conditions: 705 active listings in the ZIP; 5 comparable units currently listed for rent nearby; rentals at typical pace (median 22d on market — plan ~3-4 weeks tenant-placement turnaround); 7,071 units permitted in Marion County in 2024 (534 in 5+ unit buildings).
- This rent runs 34% of the median local income ($67k/yr) — at the standard rent-burdened threshold; future hikes will face affordability resistance.
Forward outlook
- Local home prices are declining (-3.0%/yr); year-one equity from $2k of loan paydown is wiped out by about $7k of value loss. Plan a longer hold.
- Marion County population projected at +13% by 2050 — modest demand growth; plan on rents tracking national, not racing it.
Negotiation context
- It's been on market 49 days — a 3% lower offer ($233k) is reasonable based on typical stale-listing flexibility.
- 4 sale attempts; this cycle's ask has dropped $30k (11%) from the opening price — seller is motivated, your offer sets the floor, not the list.
Risks & watch-outs
- Climate carrying-cost: severe wind risk, 99% chance of damaging wind over 30y; moderate wildfire risk; extreme-heat days projected 7→22/yr by 2055 (HVAC capex compounding) — expect insurance premiums to compound above CPI over the hold.
Questions for the listing agent
- What do current leases actually rent for vs. the listed asking? Can we see a recent rent roll and the last 12 months of T-12 income?
- It's been on market 49 days. Have you received any prior offers? Is the seller open to a 21% concession, seller financing, or rate buy-down credit?
- What does the HOA fee cover, when was the last increase, and are there any pending special assessments or reserve-fund shortfalls?
- Is there a deadline driving the sale (1031 exchange, divorce, estate, relocation)? That informs how much negotiation room exists.
- Schools are F-rated, which usually means shorter tenancies and higher turnover. Who's the typical renter profile here, and what's been the actual vacancy rate?
- The area grade is low — what's the realistic commute time and amenity access for the typical tenant pool here? Any planned neighborhood developments (good or bad) we should know about?
- What's the average days-on-market for RENTAL listings here right now (not sales)? A rising rental-DOM trend means longer vacancies and softer asking-rent achievability than the comps imply.
- What's the recent tenant-quality profile in this submarket — average credit score on applications, eviction rate, late-payment / NSF rate, and stable-employment percentage? A property-management company in the area should have these aggregated.
- How much new for-sale + rental construction is in the pipeline within 1–3 miles? Heavy new supply typically softens prices + rents 12–24 months out; constrained supply supports both.
Investment metrics
- 1% rule
- 0.79% ✗
- Cap rate
- 4.97%
- Cash-on-cash
- -4.73%
- DSCR
- 0.79
- GRM
- 10.6
CMA / ARV
- ARV (median comp)
- $287,613
- List price
- $239,990
- Delta
- -16.56%
- Verdict
- UNDERPRICED
- Comps
- 20 within 1.0 mi
Show comp detail 9 sales within ~0.75 mi
| Address | Dist | Beds/Ba | Sqft | Sold | Price | $/sf | Match |
|---|---|---|---|---|---|---|---|
| 11804 SE 91st Cir | 0.40mi | 2/2.0 | 1,468 (-1%) | 10mo | $275,000 | $187 | 71 |
| 12133 SE 89th Ave | 0.37mi | 3/2.0 (+1) | 1,380 (-7%) | 3mo | $247,320 | $179 | 63 |
| 11960 SE 91st Cir | 0.29mi | 2/2.0 | 1,575 (+6%) | 18mo | $319,000 | $203 | 62 |
| 9123 SE 125th Loop | 0.39mi | 2/2.0 | 1,618 (+9%) | 7mo | $380,000 | $235 | 61 |
| 12164 SE 89th Ter | 0.36mi | 3/2.0 (+1) | 1,473 (-1%) | 20mo | $280,000 | $190 | 60 |
| 9397 SE 124th Pl | 0.47mi | 2/2.0 | 1,425 (-4%) | 15mo | $260,000 | $182 | 58 |
| 9031 SE 120th Loop | 0.48mi | 2/2.0 | 1,346 (-10%) | 9mo | $270,000 | $201 | 54 |
| 12458 SE 92nd Ave | 0.44mi | 2/2.0 | 1,283 (-14%) | 10mo | $246,000 | $192 | 48 |
| 9533 SE 124th Loop | 0.70mi | 2/2.0 | 1,407 (-5%) | 20mo | $245,000 | $174 | 42 |
Match score weights: distance 35% · size 25% · config 20% · recency 20%. Top-matched comps best support the ARV.
Projected returns pro-forma
-3.0% appreciation · 3.0% rent growth · sell at horizon
- IRR
- -24.3%
- Equity multiple
- 0.17×
- Total profit
- $-55,670
- Equity at exit
- $35,783
- IRR
- -19.5%
- Equity multiple
- -0.04×
- Total profit
- $-69,843
- Equity at exit
- $20,750
Cash invested: $67,197 (down + closing). Projections, not guarantees.
Landlord ↔ Tenant lean methodology
- Overall (STATE)
- 87 Strongly Landlord-Friendly
- State Florida
- 87 Strongly Landlord-Friendly · R+3
- County
- — inherits STATE
- City
- — inherits STATE
ZIP-level market 34491
- Home prices YoY
- -35.0%
- Active inventory
- 705
- Price-to-rent
- 10.6×
Monthly cashflow live
- Estimated rent
- $1,885 high interval (Pro) →
- Mortgage (P&I)
- −$1,259
- Tax from tax record
- −$185 /mo · $2,216/yr
- Insurance
- −$100
- HOA
- −$211
- Vacancy / Maint / Mgmt
- −$396
- Net cashflow
- $-265
Break-even live
UW: 25.0% down · 7.5% · 30yr · 1.5% tax · 5.0% vac · 8.0% maint · 8.0% mgmt
Financing live
Cash to close
- Down payment
- $59,998
- Closing costs
- $7,200
- Reserves months
- —
- Total cash needed
- —
Loan-product check · same deal, 3 products live
Conventional
25% down · 7.5% · 30yr
- Down + closing
- —
- Monthly P&I
- —
- Monthly cashflow
- —
- DSCR
- —
- Eligible?
- —
Personal DTI + credit; lowest rate.
DSCR
20% down · 8.5% · 30yr
- Down + closing
- —
- Monthly P&I
- —
- Monthly cashflow
- —
- DSCR
- —
- Eligible?
- —
No personal income docs; deal must DSCR.
Hard money
10% down · 12.0% · 12mo
- Down + closing
- —
- Monthly P&I
- —
- Monthly cashflow
- —
- DSCR
- —
- Eligible?
- —
Short-term bridge; refi at stabilization.
Rent comps 5 comps
| Address | Beds | Baths | Sqft | Rent | $/sqft | DOM | Units | Dist |
|---|---|---|---|---|---|---|---|---|
| 9484 SE 124th Loop Summerfield, FL | 2.0 | 2.0 | 1475 | $1,949 | $1.32 | 21d | 1 | 0.58mi |
| 12257 SE 100th Ave Belleview, FL | 3.0 | 2.0 | 1555 | $1,650 | $1.06 | 14d | 1 | 0.86mi |
| 12495 SE 100th Ave Belleview, FL | 3.0 | 2.0 | 1568 | $1,850 | $1.18 | 14d | 1 | 0.99mi |
| 9375 SE 134th St Summerfield, FL | 2.0 | 2.0 | 1284 | $2,300 | $1.79 | 21d | 1 | 1.34mi |
| 13421 SE 92nd Court Rd Summerfield, FL | 2.0 | 2.0 | 1374 | $1,800 | $1.31 | 21d | 1 | 1.39mi |
HOA detail
- Monthly dues
- $211 · $2,532/yr
- Likely covers
- water
Listing history 26 events
-
2026-06-18days on market $239,990 Active 49 DOM
-
2026-06-17days on market $239,990 Active 48 DOM
-
2026-06-16days on market $239,990 Active 47 DOM
-
2026-06-15days on market $239,990 Active 46 DOM
-
2026-06-14pricedays on market $239,990 Active 44 DOM
-
2026-06-13days on market $244,499 Active 43 DOM
-
2026-06-10days on market $244,499 Active 41 DOM
-
2026-06-09days on market $244,499 Active 40 DOM
-
2026-06-08days on market $244,499 Active 39 DOM
-
2026-06-07pricedays on market $244,499 Active 38 DOM
-
2026-06-03days on market $247,490 Active 34 DOM
-
2026-06-02days on market $247,490 Active 33 DOM
-
2026-06-01days on market $247,490 Active 32 DOM
-
2026-05-31pricedays on market $247,490 Active 31 DOM
-
2026-05-30days on market $249,990 Active 30 DOM
-
2026-05-15price $259,947 1631-char remark
-
2026-05-09price $264,947 1631-char remark
-
2026-04-30status Active 1631-char remark
-
2026-04-29$269,947 Active 1631-char remark
-
2026-04-29historical 1631-char remark
-
2026-03-01historical
-
2026-01-01price $249,900
-
2025-11-14$269,900 Active
-
2025-10-31historical
-
2025-09-27price $279,900
-
2025-04-21$289,900 Active
ⓘ Source: listings_history table (triggers on properties + properties_extension) + one-shot
backfill from property_details.listing_events for pre-trigger history.
Tax reassessment forecast FL · Resets to sale price
- Current annual tax
- $2,216 · $185/mo
- Projected year-2 tax
- $2,216 · $185/mo
- Expected delta
- $0/yr ($0/mo · 0.0%)
ⓘ Screening estimate from a state-policy table — verify with the county assessor before closing.
Climate risk First Street
- Flood 1/10 Low FEMA zone X (unshaded) · 0% chance over 30 yrs
- Wildfire 5/10 Major
- Heat 9/10 Extreme 7 d/yr ≥109°F today · 22 d/yr by 30 yrs out
- Wind 9/10 Extreme 99% chance of damaging wind over 30 yrs
- Air quality 3/10 Moderate 2 unhealthy d/yr today · 2 by 30 yrs out
Nearby sold comps map
Loading sold comps map…
Walkable amenities ~0.75 mi
Loading nearby amenities…
Taxation est. · year 1
- Rental income
- $22,623
- − Mortgage interest
- −$13,443
- − Property taxes
- −$2,216
- − Insurance
- −$1,200
- − Repairs & maintenance
- −$1,810
- − Management
- −$1,810
- − HOA
- −$2,532
- − Depreciation
- −$6,982
- Taxable loss
- −$7,369
- Est. tax savings @ 24.0%
- +$1,769
- After-tax cash flow
- $-1,410/yr
For passive investors: Depreciation is non-cash, so a rental often shows a tax loss while cash-flowing — sheltering income. Rental losses are passive: they offset passive income freely, and up to $25,000/yr can offset ordinary (W-2) income if you actively participate and your MAGI is under $100k (phasing out to $0 by $150k); unused losses carry forward. On sale, claimed depreciation is recaptured at up to 25%, and gains may owe capital-gains tax (a 1031 exchange can defer both). Figures are a year-1 estimate at your 24.0% rate — not tax advice; consult a CPA.
Schools (NCES district)
- District
- Marion
- NCES district ID
- 1201260
- Math proficiency
- 42% ▼ -7.00%
- Reading proficiency
- 43% ▼ -4.00%
- Median HH income
- $40,015
- Composite
- 35.61/100
- National rank
- #4890
- State rank
- #61 of 73 in FL
Livability — Silver Springs Shores
- Score
- 68/100
- State rank
- #527
- US rank
- #9854
Category grades
Schools grade is shown separately in the Schools card above.
Census & demographics
- County
- Marion County · 315,796 people
- City population
- 83,973
- Metro
- Ocala, FL
- Population (ZIP)
- 33,318
- Household income
- $66,679
- Rent vs Own
- Severe rent burden
- 256.0
Population outlook (Marion County) Hauer SSP2
- Today (2025)
- 365,905 people
- By 2030
- 376,768 · +3.0%
- By 2040
- 396,555 · +8.4%
- By 2050
- 412,723 · +12.8%
- By 2075
- 446,090 · +21.9%
- By 2100
- 436,193 · +19.2%
Race, ethnicity, and origin ACS 2023
- Neighborhood character
- Predominantly White (77%)
- Race & ethnicity
- White 77% Hispanic / Latino 14% Two or more races 9% Black 4% Asian 2%
- Hispanic origin (detail)
- Mexican 3% Puerto Rican 6% Cuban 1%
- Common ancestry
- Lithuanian 3% Slovak 2% Romanian 2%
- Foreign-born
- 8% · Canada, Vietnam, Jamaica
- Languages at home
- 85% English-only · Spanish 11% Vietnamese 1% French/Haitian/Cajun 1%
Political lean MEDSL · Marion
- 2024 margin
- Solid R (+31.6) · D 33.8% · R 65.5%
- 2008→2024 swing
- -20.0pp toward R · 2008: -11.6pp · 2024: -31.6pp
- All cycles
- 2024: R+31.6 2020: R+25.9 2016: R+26.2 2012: R+16.2 2008: R+11.6
Not yet ingested
- Civics
- —
Market trends
- HPI YoY
- ▼ -107.67%
- Current HPI
- 200.0792
- Rent YoY
- —
- Metro
- Ocala, FL
- State GDP YoY
- ▲ 3.28%
- F500 in state
- 36
Industry mix (Fortune 500 HQ in FL)
| Industry | F500 HQs | Revenue |
|---|---|---|
| Industrial Technology | 2 | $29B |
|
||
| Insurance | 2 | $17B |
|
||
| Retail | 1 | $60B |
|
||
| Technology Distribution | 1 | $58B |
|
||
| Homebuilding | 1 | $35B |
|
||
| Technology Manufacturing | 1 | $35B |
|
||
Price history
-17.2% since first listed16 events — show timeline
- 2026-06-13 Price Changed $239,990 Stellar MLS as Distributed by MLS Grid
- 2026-06-04 Price Changed $244,499 Stellar MLS as Distributed by MLS Grid
- 2026-05-31 Price Changed $247,490 Stellar MLS as Distributed by MLS Grid
- 2026-05-24 Price Changed $249,990 Stellar MLS as Distributed by MLS Grid
- 2026-05-21 Price Changed $254,947 Stellar MLS as Distributed by MLS Grid
- 2026-05-15 Price Changed $259,947 Stellar MLS as Distributed by MLS Grid
- 2026-05-09 Price Changed $264,947 Stellar MLS as Distributed by MLS Grid
- 2026-04-30 Relisted — Stellar MLS as Distributed by MLS Grid
- 2026-04-29 Listed $269,947 Stellar MLS as Distributed by MLS Grid
- 2026-04-29 Listing Removed — Stellar MLS as Distributed by MLS Grid
- 2026-03-01 Listing Removed — Stellar MLS as Distributed by MLS Grid
- 2026-01-01 Price Changed $249,900 Stellar MLS as Distributed by MLS Grid
- 2025-11-14 Listed $269,900 Stellar MLS as Distributed by MLS Grid
- 2025-10-31 Listing Removed — Stellar MLS as Distributed by MLS Grid
- 2025-09-27 Price Changed $279,900 Stellar MLS as Distributed by MLS Grid
- 2025-04-21 Listed $289,900 Stellar MLS as Distributed by MLS Grid
Property tax history
+3.4%/yrLatest (2025): $2,216 · +12.4% YoY. Source: county tax records.
Cash-flow waterfall
monthlySold comps — $/sqft
last 12 mo · ≤1 miLoading sold comps…