1717 NW 69th St · Gladeview, FL
Flood risk 1/10 · Minimal
- FEMA flood zone
- X (unshaded)
- Chance of flooding over 30 yrs
- 0.0%
- Est. flood insurance / yr
- $507 – $1,088
Fire risk 1/10 · Minimal
- Est. fire insurance / yr
- $947 – $1,759
Heat risk 10/10 · Severe
- Hot days now (above 104°F)
- 7 days/yr
- Hot days in 30 yrs
- 29 days/yr
Wind risk 10/10 · Severe
- Chance of severe wind over 30 yrs
- 99.0%
Air-quality risk 2/10 · Minimal
- Unhealthy air days now
- 1 days/yr
- Unhealthy air days in 30 yrs
- 1 days/yr
Risk factors via First Street. Map © Google.
Why this score? — see what drove the C grade
The composite is a weighted blend of 9 inputs, each scored 0–100. Each bar is that input's sub-score; the figure is the points it added to the 100-point composite (weight × sub-score).
- Cash flow +23.2/30.0
- ARV discount +7.5/15.0
- DSCR +7.4/10.0
- 1% rule +6.5/10.0
- Schools +4.2/10.0
- Livability +4.0/5.0
- Condition / age +2.5/5.0
- Rent growth +2.3/5.0
- Appreciation +0.0/10.0
$240,000
🖨 Deal sheet 📄 Offer letter ✓ Due diligence
Listing remarks
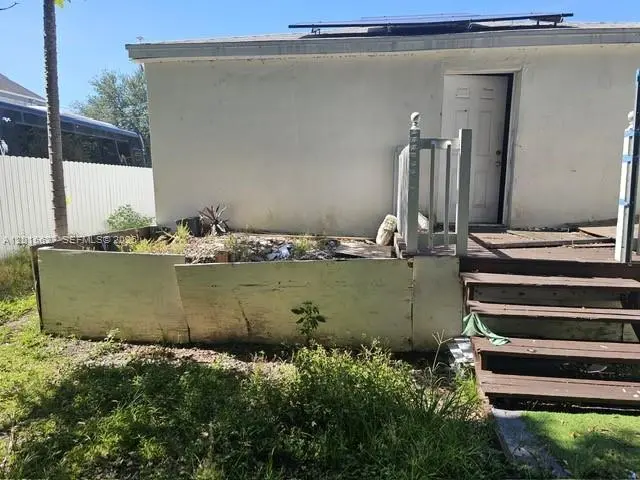
Investor special in the heart of Miami! This property presents a prime opportunity for investors, contractors, or buyers looking for a full renovation project. The home has been vandalized and requires a complete rehab. The property is being sold as-is with significant repairs needed throughout. Buyer to assume responsibility for conducting all due diligence regarding condition, violations, permits, zoning, and code compliance. Information provided is believed to be accurate but not guaranteed; buyer is responsible for independently verifying all information with the appropriate municipal authorities. Great potential for redevelopment or value-add investment.
Key facts
- 4,000 sq ft lot
- Parking
- Built 1937
Property features AI
Exterior
- Parking: Driveway
- Utilities: Public water; Public sewer
- Home design: Single-story; Faces northwest; Effective year built
- Construction: Block, frame and stucco construction; Tar and gravel roof
- Exterior features: Fenced yard; Less than quarter-acre lot
Interior
- Bedrooms: Bedroom on main level
- Flooring: Laminate flooring
- Bathrooms: 2 full bathrooms
- Heating & cooling: Central heating; Central air conditioning
- Interior features: First-floor entry; Bedroom on main level
Neighborhood map
What this means for you Summary
Snapshot
- This is a 3-bed/2.0-bath single-family listed at $240k.
Deal economics
- At list price, monthly cash flow is $434 ($5k/yr) — positive.
- The deal already cash-flows at list — no discount required.
- Meets the 1% rule at list price ($3k rent vs $240k).
Location & tenants
- Location reads 80/100 on livability (#107 in FL, #1,664 nationally) — a professional / high-income tenant draw. Strengths: schools A+, commute A+, cost of living A+; Watch: crime C-, amenities F, employment F.
- Miami-Dade (suburban): math 45% / reading 54% proficiency, ranked #40 of 73 in FL (top 55%) — families likely to look elsewhere, expect single-tenant / working-renter base with shorter leases; 64% free/reduced lunch — lower-income household profile, screen leases tightly.
- Market conditions: Rents soft (-0.7%/yr); 228 active listings in the ZIP; 10,051 units permitted in Miami-Dade County in 2024 (7,758 in 5+ unit buildings).
- At $2,763/mo this rent would consume 65% of the median local household income ($51k/yr) (locally 2419% of renters already pay >50% of income on rent) — very limited rent-growth headroom before tenants either downsize or default.
Forward outlook
- Local home prices are declining (-3.0%/yr); year-one equity from $2k of loan paydown is wiped out by about $7k of value loss. Plan a longer hold.
- Miami-Dade County population projected at +28% by 2050 — long-run rental-demand tailwind backs the buy-and-hold thesis.
Negotiation context
- Only 3 days on market — expect competitive offers; lowballing is unlikely to land.
- 20 sale attempts since 10y ago with the ask held roughly flat each time — persistent listings suggest the price (not the market) is what's stuck; bring a comps-based counter.
Risks & watch-outs
- Watch-outs: built in 1937 — expect roof / HVAC / electrical / plumbing capex.
- Climate carrying-cost: severe wind risk, 99% chance of damaging wind over 30y; extreme-heat days projected 7→29/yr by 2055 (HVAC capex compounding) — expect insurance premiums to compound above CPI over the hold.
Questions for the listing agent
- Built in 1937 — when were the roof, HVAC, electrical panel, plumbing, and water heater last replaced?
- Is there a deadline driving the sale (1031 exchange, divorce, estate, relocation)? That informs how much negotiation room exists.
- Schools are A-rated — typically a magnet for longer-tenancy family renters. What's the average tenant stay here, and is there a school-zone premium baked into asking?
- What's the average days-on-market for RENTAL listings here right now (not sales)? A rising rental-DOM trend means longer vacancies and softer asking-rent achievability than the comps imply.
- What's the recent tenant-quality profile in this submarket — average credit score on applications, eviction rate, late-payment / NSF rate, and stable-employment percentage? A property-management company in the area should have these aggregated.
- How much new for-sale + rental construction is in the pipeline within 1–3 miles? Heavy new supply typically softens prices + rents 12–24 months out; constrained supply supports both.
Investment metrics
- 1% rule
- 1.15% ✓
- Cap rate
- 8.46%
- Cash-on-cash
- 7.74%
- DSCR
- 1.34
- GRM
- 7.2
CMA / ARV
- ARV (on-the-fly)
- $493,480
- Comps found
- 3
Show comp detail 3 sales within ~0.75 mi
| Address | Dist | Beds/Ba | Sqft | Sold | Price | $/sf | Match |
|---|---|---|---|---|---|---|---|
| 1717 NW 70th St | 0.09mi | 3/2.0 | 1,300 (-4%) | 6mo | $475,000 | $365 | 84 |
| 1531 NW 62nd Ter | 0.35mi | 4/1.0 (+1) | 1,323 (-2%) | 6mo | $300,000 | $227 | 66 |
| 7930 NW 14th Ave | 0.72mi | 3/2.0 | 1,192 (-12%) | 9mo | $475,000 | $398 | 39 |
Match score weights: distance 35% · size 25% · config 20% · recency 20%. Top-matched comps best support the ARV.
Projected returns pro-forma
-3.0% appreciation · 0.0% rent growth · sell at horizon
- IRR
- -8.0%
- Equity multiple
- 0.71×
- Total profit
- $-19,267
- Equity at exit
- $35,785
- IRR
- -3.1%
- Equity multiple
- 0.82×
- Total profit
- $-12,102
- Equity at exit
- $20,751
Cash invested: $67,200 (down + closing). Projections, not guarantees.
Landlord ↔ Tenant lean methodology
- Overall (STATE)
- 87 Strongly Landlord-Friendly
- State Florida
- 87 Strongly Landlord-Friendly · R+3
- County
- — inherits STATE
- City
- — inherits STATE
ZIP-level market 33147
- Home prices YoY
- -30.9%
- Rents YoY
- -0.7%
- Active inventory
- 228
- Price-to-rent
- 7.2×
Monthly cashflow live
- Estimated rent
- $2,763 medium interval (Pro) →
- Mortgage (P&I)
- −$1,259
- Tax from tax record
- −$390 /mo · $4,681/yr
- Insurance
- −$100
- HOA
- −$0
- Vacancy / Maint / Mgmt
- −$580
- Net cashflow
- $434
Break-even live
UW: 25.0% down · 7.5% · 30yr · 1.5% tax · 5.0% vac · 8.0% maint · 8.0% mgmt
Financing live
Cash to close
- Down payment
- $60,000
- Closing costs
- $7,200
- Reserves months
- —
- Total cash needed
- —
Loan-product check · same deal, 3 products live
Conventional
25% down · 7.5% · 30yr
- Down + closing
- —
- Monthly P&I
- —
- Monthly cashflow
- —
- DSCR
- —
- Eligible?
- —
Personal DTI + credit; lowest rate.
DSCR
20% down · 8.5% · 30yr
- Down + closing
- —
- Monthly P&I
- —
- Monthly cashflow
- —
- DSCR
- —
- Eligible?
- —
No personal income docs; deal must DSCR.
Hard money
10% down · 12.0% · 12mo
- Down + closing
- —
- Monthly P&I
- —
- Monthly cashflow
- —
- DSCR
- —
- Eligible?
- —
Short-term bridge; refi at stabilization.
Listing history 50 events
-
2026-05-11status Pending
-
2026-05-08$240,000 Active
-
2026-04-27historical
-
2026-04-15status Active
-
2026-04-04status Pending
-
2026-02-18price $415,000
-
2026-02-16price $440,000
-
2026-01-29historical
-
2026-01-26$445,000
-
2026-01-14$455,000 Active
-
2025-10-29historical
-
2025-10-29historical $1,400
-
2025-10-29historical $1,400
-
2025-10-28price $465,000
-
2025-10-27$1,400
-
2025-10-27$1,400
-
2025-10-09$475,000 Active
-
2025-10-07historical $1,400
-
2025-10-07historical $1,400
-
2025-09-30$1,400
-
2025-09-28$1,700
-
2025-09-27$461,805 Active
-
2025-07-24historical $600
-
2025-06-13$600
-
2025-05-08soldstatus $471,000
-
2024-07-02historical
-
2024-05-14status Active
-
2024-05-14price $434,000
-
2024-05-13historical Active Under Contract
-
2024-05-03price $414,000
-
2024-04-26price $419,000
-
2024-04-12price $424,000
-
2024-03-29price $429,000
-
2024-03-07status Active
-
2024-02-01$439,000 Active
-
2023-06-26historical
-
2023-01-19price $375,000
-
2023-01-15$350,000 Active
-
2022-04-08historical
-
2022-02-28price $2,550
-
2021-11-18price $349,000
-
2021-07-29price $369,000
-
2021-06-23$375,000 Active
-
2021-06-23historical
-
2021-06-22$375,000 Active
-
2020-09-03soldstatus $128,016 Closed
-
2017-10-25$120,770 Active
-
2017-02-03historical
-
2017-01-05status Active
-
2016-12-12status Pending
ⓘ Source: listings_history table (triggers on properties + properties_extension) + one-shot
backfill from property_details.listing_events for pre-trigger history.
Tax reassessment forecast FL · Resets to sale price
- Current annual tax
- $4,681 · $390/mo
- Projected year-2 tax
- $4,681 · $390/mo
- Expected delta
- $0/yr ($0/mo · 0.0%)
ⓘ Screening estimate from a state-policy table — verify with the county assessor before closing.
Climate risk First Street
- Flood 1/10 Low FEMA zone X (unshaded) · 0% chance over 30 yrs
- Wildfire 1/10 Low
- Heat 10/10 Extreme 7 d/yr ≥104°F today · 29 d/yr by 30 yrs out
- Wind 10/10 Extreme 99% chance of damaging wind over 30 yrs
- Air quality 2/10 Low 1 unhealthy d/yr today · 1 by 30 yrs out
Nearby sold comps map
Loading sold comps map…
Walkable amenities ~0.75 mi
Loading nearby amenities…
Taxation est. · year 1
- Rental income
- $33,150
- − Mortgage interest
- −$13,444
- − Property taxes
- −$4,681
- − Insurance
- −$1,200
- − Repairs & maintenance
- −$2,652
- − Management
- −$2,652
- − Depreciation
- −$6,982
- Taxable income
- $1,539
- Est. tax owed @ 24.0%
- −$369
- After-tax cash flow
- $4,835/yr
For passive investors: Depreciation is non-cash, so a rental often shows a tax loss while cash-flowing — sheltering income. Rental losses are passive: they offset passive income freely, and up to $25,000/yr can offset ordinary (W-2) income if you actively participate and your MAGI is under $100k (phasing out to $0 by $150k); unused losses carry forward. On sale, claimed depreciation is recaptured at up to 25%, and gains may owe capital-gains tax (a 1031 exchange can defer both). Figures are a year-1 estimate at your 24.0% rate — not tax advice; consult a CPA.
Schools (NCES district)
- District
- Miami-Dade
- NCES district ID
- 1200390
- Math proficiency
- 45% ▼ -16.00%
- Reading proficiency
- 54% ▼ -5.00%
- Median HH income
- $43,928
- Composite
- 41.76/100
- National rank
- #3397
- State rank
- #40 of 73 in FL
Livability — Gladeview
- Score
- 80/100
- State rank
- #107
- US rank
- #1664
Category grades
Schools grade is shown separately in the Schools card above.
Census & demographics
- Census place
- Gladeview, FL
- County
- Miami-Dade County · 2,697,751 people
- City population
- 81,393
- Metro
- Miami-Fort Lauderdale-Pompano Beach, FL
- Population (ZIP)
- 50,419
- Household income
- $50,704
- Rent vs Own
- Severe rent burden
- 2419.0
Population outlook (Miami-Dade County) Hauer SSP2
- Today (2025)
- 3,126,439 people
- By 2030
- 3,325,765 · +6.4%
- By 2040
- 3,697,561 · +18.3%
- By 2050
- 4,012,134 · +28.3%
- By 2075
- 4,605,612 · +47.3%
- By 2100
- 4,866,598 · +55.7%
Race, ethnicity, and origin ACS 2023
- Neighborhood character
- Majority Hispanic (52%)
- Race & ethnicity
- Hispanic / Latino 52% Black 46% Two or more races 22% White 1%
- Hispanic origin (detail)
- Puerto Rican 3% Cuban 24% Dominican 4%
- Common ancestry
- Hispanic 5%
- Foreign-born
- 39% · Canada, Jamaica, Dominican Republic
- Languages at home
- 45% English-only · Spanish 50% French/Haitian/Cajun 5%
Political lean MEDSL · Miami-Dade
- 2024 margin
- R (+11.4) · D 43.9% · R 55.4%
- 2008→2024 swing
- -27.6pp toward R · 2008: 16.1pp · 2024: -11.4pp
- All cycles
- 2024: R+11.4 2020: D+7.3 2016: D+29.6 2012: D+23.7 2008: D+16.1
Not yet ingested
- Civics
- —
Market trends
- HPI YoY
- ▼ -286.84%
- Current HPI
- 642.2677
- Rent YoY
- ▼ -0.71%
- Metro
- Miami-Fort Lauderdale-Pompano Beach, FL
- State GDP YoY
- ▲ 3.28%
- F500 in state
- 36
Industry mix (Fortune 500 HQ in FL)
| Industry | F500 HQs | Revenue |
|---|---|---|
| Industrial Technology | 2 | $29B |
|
||
| Insurance | 2 | $17B |
|
||
| Retail | 1 | $60B |
|
||
| Technology Distribution | 1 | $58B |
|
||
| Homebuilding | 1 | $35B |
|
||
| Technology Manufacturing | 1 | $35B |
|
||
Price history
+145.5% since first listed51 events — show timeline
- 2026-05-11 Pending — MARMLS
- 2026-05-08 Listed $240,000 MARMLS
- 2026-04-27 Listing Removed — MARMLS
- 2026-04-15 Relisted — MARMLS
- 2026-04-04 Pending — MARMLS
- 2026-02-18 Price Changed $415,000 MARMLS
- 2026-02-16 Price Changed $440,000 MARMLS
- 2026-01-29 Listing Removed — Beaches MLS
- 2026-01-26 Listed $445,000 Beaches MLS
- 2026-01-14 Listed $455,000 MARMLS
- 2025-10-29 Listing Removed — MARMLS
- 2025-10-29 Rental Removed $1,400 MARMLS
- 2025-10-29 Rental Removed $1,400 MARMLS
- 2025-10-28 Price Changed $465,000 MARMLS
- 2025-10-27 Listed for Rent $1,400 MARMLS
- 2025-10-27 Listed for Rent $1,400 MARMLS
- 2025-10-09 Listed $475,000 MARMLS
- 2025-10-07 Rental Removed $1,400 MARMLS
- 2025-10-07 Rental Removed $1,400 MARMLS
- 2025-09-30 Listed for Rent $1,400 MARMLS
- 2025-09-28 Listed for Rent $1,700 MARMLS
- 2025-09-27 Listed $461,805 MARMLS
- 2025-07-24 Rental Removed $600 MARMLS
- 2025-06-13 Listed for Rent $600 MARMLS
- 2025-05-08 Sold (Public Records) $471,000 Public Records
- 2024-07-02 Listing Removed — MARMLS
- 2024-05-14 Relisted — MARMLS
- 2024-05-14 Price Changed $434,000 MARMLS
- 2024-05-13 Contingent — MARMLS
- 2024-05-03 Price Changed $414,000 MARMLS
- 2024-04-26 Price Changed $419,000 MARMLS
- 2024-04-12 Price Changed $424,000 MARMLS
- 2024-03-29 Price Changed $429,000 MARMLS
- 2024-03-07 Relisted — MARMLS
- 2024-02-01 Listed $439,000 MARMLS
- 2023-06-26 Listing Removed — MARMLS
- 2023-01-19 Price Changed $375,000 MARMLS
- 2023-01-15 Listed $350,000 MARMLS
- 2022-04-08 Listing Removed — MARMLS
- 2022-02-28 Price Changed $2,550 RENT.
- 2021-11-18 Price Changed $349,000 MARMLS
- 2021-07-29 Price Changed $369,000 MARMLS
- 2021-06-23 Listing Removed — MARMLS
- 2021-06-23 Listed $375,000 MARMLS
- 2021-06-22 Listed $375,000 MARMLS
- 2020-09-03 Sold (MLS) $128,016 MARMLS
- 2017-10-25 Listed $120,770 MARMLS
- 2017-02-03 Listing Removed — MARMLS
- 2017-01-05 Relisted — MARMLS
- 2016-12-12 Pending — MARMLS
- 2016-08-05 Listed $97,770 MARMLS
Property tax history
+9.3%/yrLatest (2025): $4,681 · +12.7% YoY. Source: county tax records.
Cash-flow waterfall
monthlySold comps — $/sqft
last 12 mo · ≤1 miLoading sold comps…