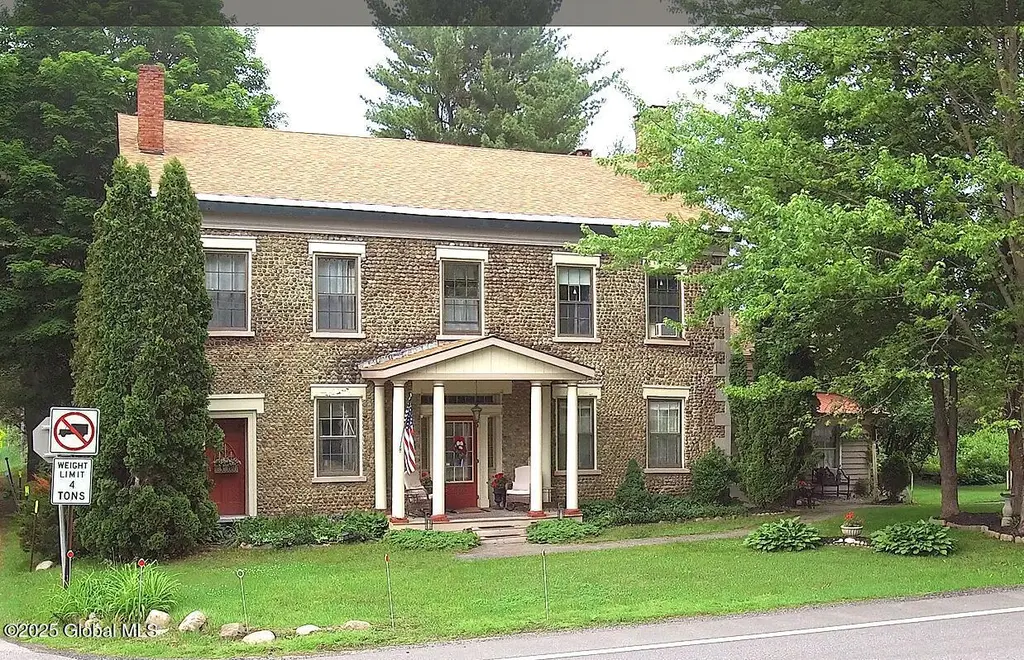
545 Route 67 · Round Lake, NY
Flood risk 1/10 · Minimal
- FEMA flood zone
- X
- Chance of flooding over 30 yrs
- 0.0%
- Est. flood insurance / yr
- $473 – $860
Fire risk 2/10 · Minimal
- Est. fire insurance / yr
- $691 – $1,283
Heat risk 3/10 · Minor
- Hot days now (above 97°F)
- 7 days/yr
- Hot days in 30 yrs
- 16 days/yr
Wind risk 3/10 · Minor
- Chance of severe wind over 30 yrs
- 5.0%
Air-quality risk 2/10 · Minimal
- Unhealthy air days now
- 0 days/yr
- Unhealthy air days in 30 yrs
- 1 days/yr
Risk factors via First Street. Map © Google.
Why this score? — see what drove the D grade
The composite is a weighted blend of 9 inputs, each scored 0–100. Each bar is that input's sub-score; the figure is the points it added to the 100-point composite (weight × sub-score).
- Appreciation +10.0/10.0
- Cash flow +7.5/30.0
- ARV discount +7.5/15.0
- Schools +6.5/10.0
- Livability +3.8/5.0
- Rent growth +2.5/5.0
- Condition / age +2.5/5.0
- DSCR +1.7/10.0
- 1% rule +1.2/10.0
$399,777
🖨 Deal sheet 📄 Offer letter ✓ Due diligence
Listing remarks
This is a spacious & unique home is perfect for a Bed Breakfast or AB & B. Circa1845 this is a one of a kind Cobblestone Federal Colonial style is located in Maltaville (between Round lake & Mechanicville), she has all the space, charm & character you are looking for. She is situated on 1.63 sprawling acres, boasts over 3,300 sq. ft of living space, 10' Coffered ceilings, wide plank floors, grand foyer & staircase, 3 season porch/family room. , 6 large bedrooms and 4 full baths with a primary bath on the first floor perfect to have your own private suite or make it a first floor in-law. Located only 10 minutes or so to downtown Saratoga and the Race track, and ov
Key facts
- Grand foyer
- 1.63 sprawling acres
- 3 season porch
Tags
Property features AI
Exterior
- Parking: Seven off-street paved driveway spaces
- Security: Smoke detector(s); Carbon monoxide detector(s)
- Utilities: 220 volts with circuit breakers; Septic tank; Cable connected
- Home design: Single family residence; Corner lot; Level, private and landscaped lot with road frontage
- Construction: Stone construction; Stone foundation
- Exterior features: Asphalt roof; Exterior lighting; Shed(s); Barn(s)
Interior
- Kitchen: Built-in electric oven; Dishwasher; Microwave; Refrigerator; Electric water heater
- Bedrooms: Primary bedroom on the first floor; Multiple bedrooms on the second floor
- Flooring: Carpet; Hardwood; Linoleum
- Bathrooms: Four full bathrooms (one on the first floor, three on the second floor)
- Heating & cooling: Oil heating; Steam heating; Window unit(s) for cooling
- Interior features: High-speed internet; Paddle fan; Walk-in closet(s); Storm door(s); Storm window(s); Partial unfinished basement; 17 total rooms; Dining room fireplace
- Laundry & utility: Main-level laundry room; Washer/Dryer
Neighborhood map
What this means for you Summary
Snapshot
- This is a 5-bed/3.0-bath single-family listed at $400k.
Deal economics
- At list price, monthly cash flow is $-492 ($-6k/yr) — negative.
- To cash-flow at today's rent, offer at most $313k (21.7% below list).
- To meet the 1% rule (rent ≥ 1% of price), the offer needs to be $246k (38.4% below list).
- Recommended offer: $246k (38.4% below list) — sets the bar for 1% rule.
- Cap rate 4.8% vs local median 2.2% in Round Lake — top-decile yield for the area; either an underpriced asset or a hidden risk that comps aren't pricing in. Stress-test before assuming the spread holds.
Location & tenants
- Location reads 76/100 on livability (#236 in NY, #3,708 nationally) — a middle-class / working-renter tenant base. Strengths: crime A+, employment A+, housing A+; Watch: amenities F, commute F, cost of living F.
- Shenendehowa Central School District (suburban): math 72% / reading 73% proficiency, ranked #98 of 590 in NY (top 17%) — strong family-tenant draw, lease renewals of 3-5y typical; only 10% free/reduced lunch — higher-income household profile.
- Zoned schools: Shenendehowa High School (math 97% / reading 82%, grade A+, #265 of 1,100 statewide, top 26%, 3,036 students, 21% FRL).
- Zoned-school proficiency averages 90% at this address vs 72% district-wide (+17 pts) — the actual schools serving this property are materially stronger than the Shenendehowa Central School District average implies; a family-tenant draw the district grade alone would hide.
- Market conditions: 144 active listings in the ZIP; solid renter incomes; 1,132 units permitted in Saratoga County in 2024 (378 in 5+ unit buildings).
- This rent runs 32% of the median local income ($93k/yr) — at the standard rent-burdened threshold; future hikes will face affordability resistance.
Forward outlook
- In year one you build about $43k of equity ($3k loan paydown + $40k appreciation (10.0% local appreciation)).
- Saratoga County population projected at +4% by 2050 — modest demand growth; plan on rents tracking national, not racing it.
- By year 2, paydown + projected appreciation supports a ~$69k cash-out refi (75% LTV) — recoverable capital for the next deal without selling this one.
Negotiation context
- It's been on market 37 days — a 3% lower offer ($388k) is reasonable based on typical stale-listing flexibility.
- 6 sale attempts since 10y ago with the ask held roughly flat each time — persistent listings suggest the price (not the market) is what's stuck; bring a comps-based counter.
Risks & watch-outs
- Watch-outs: built in 1845 — expect roof / HVAC / electrical / plumbing capex.
Questions for the listing agent
- What do current leases actually rent for vs. the listed asking? Can we see a recent rent roll and the last 12 months of T-12 income?
- It's been on market 37 days. Have you received any prior offers? Is the seller open to a 38% concession, seller financing, or rate buy-down credit?
- Built in 1845 — when were the roof, HVAC, electrical panel, plumbing, and water heater last replaced?
- Is there a deadline driving the sale (1031 exchange, divorce, estate, relocation)? That informs how much negotiation room exists.
- Schools are D-rated, which usually means shorter tenancies and higher turnover. Who's the typical renter profile here, and what's been the actual vacancy rate?
- The area grade is low — what's the realistic commute time and amenity access for the typical tenant pool here? Any planned neighborhood developments (good or bad) we should know about?
- What's the average days-on-market for RENTAL listings here right now (not sales)? A rising rental-DOM trend means longer vacancies and softer asking-rent achievability than the comps imply.
- What's the recent tenant-quality profile in this submarket — average credit score on applications, eviction rate, late-payment / NSF rate, and stable-employment percentage? A property-management company in the area should have these aggregated.
- How much new for-sale + rental construction is in the pipeline within 1–3 miles? Heavy new supply typically softens prices + rents 12–24 months out; constrained supply supports both.
Investment metrics
- 1% rule
- 0.62% ✗
- Cap rate
- 4.82%
- Cash-on-cash
- -5.27%
- DSCR
- 0.77
- GRM
- 13.5
CMA / ARV
- ARV (median comp)
- $848,992
- List price
- $399,777
- Delta
- -52.91%
- Verdict
- UNDERPRICED
- Comps
- 6 within 2.0 mi
Projected returns pro-forma
10.0% appreciation · 3.0% rent growth · sell at horizon
- IRR
- 20.5%
- Equity multiple
- 2.66×
- Total profit
- $186,257
- Equity at exit
- $360,151
- IRR
- 18.7%
- Equity multiple
- 6.12×
- Total profit
- $572,792
- Equity at exit
- $776,679
Cash invested: $111,938 (down + closing). Projections, not guarantees.
Landlord ↔ Tenant lean methodology
- Overall (STATE)
- 15 Strongly Tenant-Friendly
- State New York
- 15 Strongly Tenant-Friendly · D+10
- County
- — inherits STATE
- City
- — inherits STATE
ZIP-level market 12118
- Home prices YoY
- 8.3%
- Active inventory
- 144
- Price-to-rent
- 13.5×
Monthly cashflow live
- Estimated rent
- $2,462 medium interval (Pro) →
- Mortgage (P&I)
- −$2,096
- Tax from tax record
- −$174 /mo · $2,083/yr
- Insurance
- −$167
- HOA
- −$0
- Vacancy / Maint / Mgmt
- −$517
- Net cashflow
- $-492
Break-even live
UW: 25.0% down · 7.5% · 30yr · 1.5% tax · 5.0% vac · 8.0% maint · 8.0% mgmt
Financing live
Cash to close
- Down payment
- $99,944
- Closing costs
- $11,993
- Reserves months
- —
- Total cash needed
- —
Loan-product check · same deal, 3 products live
Conventional
25% down · 7.5% · 30yr
- Down + closing
- —
- Monthly P&I
- —
- Monthly cashflow
- —
- DSCR
- —
- Eligible?
- —
Personal DTI + credit; lowest rate.
DSCR
20% down · 8.5% · 30yr
- Down + closing
- —
- Monthly P&I
- —
- Monthly cashflow
- —
- DSCR
- —
- Eligible?
- —
No personal income docs; deal must DSCR.
Hard money
10% down · 12.0% · 12mo
- Down + closing
- —
- Monthly P&I
- —
- Monthly cashflow
- —
- DSCR
- —
- Eligible?
- —
Short-term bridge; refi at stabilization.
Listing history 31 events
-
2026-06-18days on market $399,777 Active 37 DOM
-
2026-06-17days on market $399,777 Active 36 DOM
-
2026-06-16days on market $399,777 Active 35 DOM
-
2026-06-15days on market $399,777 Active 34 DOM
-
2026-06-14days on market $399,777 Active 32 DOM
-
2026-06-13days on market $399,777 Active 31 DOM
-
2026-06-10days on market $399,777 Active 29 DOM
-
2026-06-09days on market $399,777 Active 28 DOM
-
2026-06-08days on market $399,777 Active 27 DOM
-
2026-06-07days on market $399,777 Active 26 DOM
-
2026-06-03days on market $399,777 Active 22 DOM
-
2026-06-02days on market $399,777 Active 21 DOM
-
2026-06-01days on market $399,777 Active 20 DOM
-
2026-05-31days on market $399,777 Active 19 DOM
-
2026-05-31days on market $399,777 Active 18 DOM
-
2026-05-12$399,777 Active 793-char remark
-
2025-10-10price $439,000
-
2025-09-02price $475,000
-
2025-07-30status Active
-
2025-06-30status Pending
-
2025-06-30historical
-
2025-06-09$499,777 Active
-
2018-12-17historical
-
2018-11-02price $349,900
-
2018-09-25price $359,000
-
2018-05-03$369,000 New
-
2017-05-08historical
-
2017-04-06$384,900 New
-
2017-01-21historical
-
2016-10-12price $399,999
-
2016-07-24$419,000 New
ⓘ Source: listings_history table (triggers on properties + properties_extension) + one-shot
backfill from property_details.listing_events for pre-trigger history.
Tax reassessment forecast NY · Partial reset (capped growth)
- Current annual tax
- $2,083 · $174/mo
- Projected year-2 tax
- $4,420 · $368/mo
- Expected delta
- +$2,337/yr (+$195/mo · 112.2%)
ⓘ Screening estimate from a state-policy table — verify with the county assessor before closing.
Climate risk First Street
- Flood 1/10 Low FEMA zone X · 0% chance over 30 yrs
- Wildfire 2/10 Low
- Heat 3/10 Moderate 7 d/yr ≥97°F today · 16 d/yr by 30 yrs out
- Wind 3/10 Moderate 5% chance of damaging wind over 30 yrs
- Air quality 2/10 Low 0 unhealthy d/yr today · 1 by 30 yrs out
Nearby sold comps map
Loading sold comps map…
Walkable amenities ~0.75 mi
Loading nearby amenities…
Taxation est. · year 1
- Rental income
- $29,545
- − Mortgage interest
- −$22,394
- − Property taxes
- −$2,083
- − Insurance
- −$1,999
- − Repairs & maintenance
- −$2,364
- − Management
- −$2,364
- − Depreciation
- −$11,630
- Taxable loss
- −$13,288
- Est. tax savings @ 24.0%
- +$3,189
- After-tax cash flow
- $-2,710/yr
For passive investors: Depreciation is non-cash, so a rental often shows a tax loss while cash-flowing — sheltering income. Rental losses are passive: they offset passive income freely, and up to $25,000/yr can offset ordinary (W-2) income if you actively participate and your MAGI is under $100k (phasing out to $0 by $150k); unused losses carry forward. On sale, claimed depreciation is recaptured at up to 25%, and gains may owe capital-gains tax (a 1031 exchange can defer both). Figures are a year-1 estimate at your 24.0% rate — not tax advice; consult a CPA.
Schools (NCES district)
- District
- Shenendehowa Central School District
- NCES district ID
- 3626670
- Math proficiency
- 72% ▼ -6.00%
- Reading proficiency
- 73% ▲ 3.00%
- Median HH income
- $82,933
- Composite
- 64.59/100
- National rank
- #531
- State rank
- #98 of 590 in NY
Livability — Round Lake
- Score
- 76/100
- State rank
- #236
- US rank
- #3708
Category grades
Schools grade is shown separately in the Schools card above.
Census & demographics
- County
- Saratoga County · 166,192 people
- City population
- 17,069
- Metro
- Albany-Schenectady-Troy, NY
- Population (ZIP)
- 17,069
- Household income
- $92,710
- Rent vs Own
- Severe rent burden
- 552.0
Population outlook (Saratoga County) Hauer SSP2
- Today (2025)
- 238,889 people
- By 2030
- 243,681 · +2.0%
- By 2040
- 249,118 · +4.3%
- By 2050
- 248,638 · +4.1%
- By 2075
- 241,675 · +1.2%
- By 2100
- 213,150 · -10.8%
Race, ethnicity, and origin ACS 2023
- Neighborhood character
- Predominantly White (88%)
- Race & ethnicity
- White 88% Two or more races 5% Hispanic / Latino 4% Asian 3%
- Common ancestry
- Lithuanian 8% Romanian 8% Iranian 2%
- Foreign-born
- 5% · Canada, China
- Languages at home
- 92% English-only · Spanish 3% Other Indo-European 2% Chinese 1%
Political lean MEDSL · Saratoga
- 2024 margin
- Toss-up / Even · D 50.9% · R 49.1%
- 2008→2024 swing
- -1.6pp toward R · 2008: 3.4pp · 2024: 1.8pp
- All cycles
- 2024: D+1.8 2020: D+5.4 2016: R+4.4 2012: D+2.1 2008: D+3.4
Not yet ingested
- Civics
- —
Market trends
- HPI YoY
- ▲ 26.43%
- Current HPI
- 343.9893
- Rent YoY
- —
- Metro
- Albany-Schenectady-Troy, NY
- State GDP YoY
- ▲ 2.60%
- F500 in state
- 92
Industry mix (Fortune 500 HQ in NY)
| Industry | F500 HQs | Revenue |
|---|---|---|
| Financial Services | 10 | $950B |
|
||
| Consumer Goods | 9 | $162B |
|
||
| Insurance | 4 | $225B |
|
||
| Telecommunications | 2 | $144B |
|
||
| Pharmaceuticals | 2 | $112B |
|
||
| Media / Entertainment | 2 | $69B |
|
||
Price history
-4.6% since first listed16 events — show timeline
- 2026-05-12 Listed $399,777 Global MLS
- 2025-10-10 Price Changed $439,000 Global MLS
- 2025-09-02 Price Changed $475,000 Global MLS
- 2025-07-30 Relisted — Global MLS
- 2025-06-30 Pending — Global MLS
- 2025-06-30 Listing Removed — Global MLS
- 2025-06-09 Listed $499,777 Global MLS
- 2018-12-17 Listing Removed — Global MLS
- 2018-11-02 Price Changed $349,900 Global MLS
- 2018-09-25 Price Changed $359,000 Global MLS
- 2018-05-03 Listed $369,000 Global MLS
- 2017-05-08 Listing Removed — Global MLS
- 2017-04-06 Listed $384,900 Global MLS
- 2017-01-21 Listing Removed — Global MLS
- 2016-10-12 Price Changed $399,999 Global MLS
- 2016-07-24 Listed $419,000 Global MLS
Property tax history
-5.8%/yrLatest (2025): $2,083 · -8.9% YoY. Source: county tax records.
Cash-flow waterfall
monthlySold comps — $/sqft
last 12 mo · ≤1 miLoading sold comps…