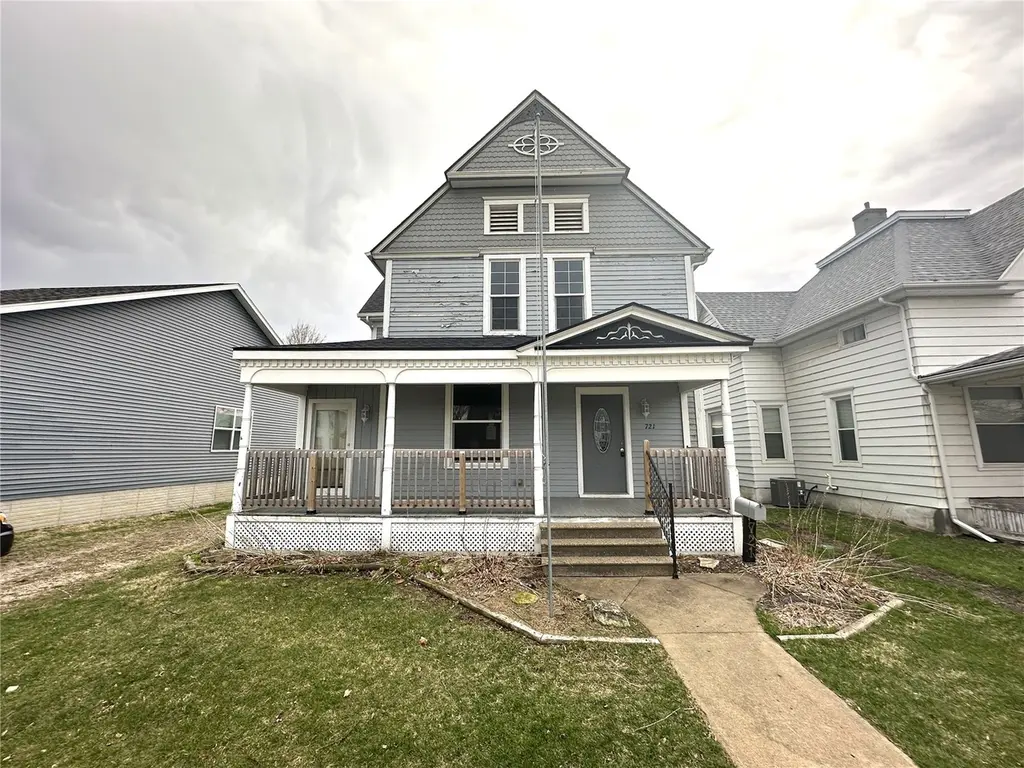
721 F Ave Ave NW · Cedar Rapids, IA
Flood risk 3/10 · Minor
- FEMA flood zone
- X (shaded)
- Chance of flooding over 30 yrs
- 0.16%
- Est. flood insurance / yr
- $473 – $860
Fire risk 1/10 · Minimal
- Est. fire insurance / yr
- $902 – $1,676
Heat risk 3/10 · Minor
- Hot days now (above 103°F)
- 7 days/yr
- Hot days in 30 yrs
- 15 days/yr
Wind risk 2/10 · Minimal
- Chance of severe wind over 30 yrs
- —
Air-quality risk 2/10 · Minimal
- Unhealthy air days now
- 0 days/yr
- Unhealthy air days in 30 yrs
- 1 days/yr
Risk factors via First Street. Map © Google.
Why this score? — see what drove the A- grade
The composite is a weighted blend of 9 inputs, each scored 0–100. Each bar is that input's sub-score; the figure is the points it added to the 100-point composite (weight × sub-score).
- Cash flow +30.0/30.0
- ARV discount +15.0/15.0
- 1% rule +10.0/10.0
- DSCR +10.0/10.0
- Rent growth +5.0/5.0
- Schools +4.7/10.0
- Livability +3.9/5.0
- Condition / age +2.5/5.0
- Appreciation +0.0/10.0
$90,000
🖨 Deal sheet (PDF) 📄 Offer letter ✓ Due diligence
Listing remarks MLS
4/30/26_ HUD preliminary accepted an offer. Will mark SP as soon as contract is ratified. Step into this grand 2 story home, with four bedrooms and one and half baths. As you enter your greeted with a ornate staircase and high ceilings and a 1st floor bedroom. Spacious rooms and the side enclosed porch is a plus and some updates have been made over the years. Neutural walls and flooring make it easier to make your own. The second level has 3 bedrooms, a full bath with laundry. Outside you have a nice sized yard fenced in and a parking spot off the alley. Property is located in a flood zone per FEMA map. This property is managed by Raine Companies and is an exclusive listing. For more infomation and bidding periods visit www. hudhomestore. com, case #161-388153. Hud properties are sold as.
Key facts
- Ornate staircase
- High ceilings
- Side enclosed porch
Tags
Neighborhood map
What this means for you Summary
Snapshot
- This is a 4-bed/1.5-bath single-family listed at $90k.
Deal economics
- At list price, monthly cash flow is $619 ($7k/yr) — positive.
- The deal already cash-flows at list — no discount required.
- Meets the 1% rule at list price ($2k rent vs $90k).
- Recommended offer: $89k (1.5% below list) — sets the bar for market timing.
- Cap rate 14.6% vs local median 3.5% in Cedar Rapids — top-decile yield for the area; either an underpriced asset or a hidden risk that comps aren't pricing in. Stress-test before assuming the spread holds.
Location & tenants
- Location reads 78/100 on livability (#134 in IA, #2,474 nationally) — a middle-class / working-renter tenant base. Strengths: cost of living A+, housing A+, health & safety A+; Watch: crime C-, commute F.
- Cedar Rapids Community School District (urban): math 50% / reading 59% proficiency, ranked #265 of 289 in IA (top 92%) — acceptable for families but not a draw, mixed tenant base, ~2y average lease.
- Market conditions: Rents rising fast (+12.4%/yr); 148 active listings in the ZIP; 1 comparable units currently listed for rent nearby; 1,023 units permitted in Linn County in 2024 (456 in 5+ unit buildings).
- This rent runs 30% of the median local income ($70k/yr) — at the standard rent-burdened threshold; future hikes will face affordability resistance.
Forward outlook
- Local home prices are declining (-3.0%/yr); year-one equity from $622 of loan paydown is wiped out by about $3k of value loss. Plan a longer hold.
- Linn County population projected at +16% by 2050 — long-run rental-demand tailwind backs the buy-and-hold thesis.
- At projected returns (-3.0% appreciation + 8.0% rent growth), your $25k cash investment doubles in ~4 years — after that, you're playing with house money.
Negotiation context
- It's been on market 18 days — a 2% lower offer ($89k) is reasonable based on typical stale-listing flexibility.
- 3 sale attempts since 7y ago with the ask held roughly flat each time — persistent listings suggest the price (not the market) is what's stuck; bring a comps-based counter.
Risks & watch-outs
- Watch-outs: property tax is 3.5% of price; built in 1900 — expect roof / HVAC / electrical / plumbing capex.
Questions for the listing agent
- Built in 1900 — when were the roof, HVAC, electrical panel, plumbing, and water heater last replaced?
- Property tax is high relative to price — has the assessment been appealed recently, and will the sale trigger a re-assessment?
- Is there a deadline driving the sale (1031 exchange, divorce, estate, relocation)? That informs how much negotiation room exists.
- Schools are B-rated — typically a magnet for longer-tenancy family renters. What's the average tenant stay here, and is there a school-zone premium baked into asking?
- What's the average days-on-market for RENTAL listings here right now (not sales)? A rising rental-DOM trend means longer vacancies and softer asking-rent achievability than the comps imply.
- What's the recent tenant-quality profile in this submarket — average credit score on applications, eviction rate, late-payment / NSF rate, and stable-employment percentage? A property-management company in the area should have these aggregated.
- How much new for-sale + rental construction is in the pipeline within 1–3 miles? Heavy new supply typically softens prices + rents 12–24 months out; constrained supply supports both.
Investment metrics
- 1% rule
- 1.96% ✓
- Cap rate
- 14.55%
- Cash-on-cash
- 29.50%
- DSCR
- 2.31
- GRM
- 4.3
CMA / ARV
- ARV (median comp)
- $178,245
- List price
- $90,000
- Delta
- -49.51%
- Verdict
- UNDERPRICED
- Comps
- 20 within 1.0 mi
Show comp detail 12 sales within ~0.75 mi
| Address | Dist | Beds/Ba | Sqft | Sold | Price | $/sf | Match |
|---|---|---|---|---|---|---|---|
| 716 F Ave NW | 0.03mi | 4/2.0 | 1,761 (-3%) | 5mo | $195,700 | $111 | 87 |
| 1238 NW Ellis Blvd | 0.44mi | 4/2.0 | 1,798 (-1%) | 3mo | $149,000 | $83 | 73 |
| 1130 13th St | 0.49mi | 3/2.5 (-1) | 1,817 (-0%) | 6mo | $245,000 | $135 | 63 |
| 1126 13th St NW | 0.48mi | 3/2.5 (-1) | 1,767 (-3%) | 5mo | $241,000 | $136 | 59 |
| 1427 Pawnee Dr | 0.54mi | 3/2.0 (-1) | 1,896 (+4%) | 8mo | $225,000 | $119 | 54 |
| 1307 8th St NW | 0.47mi | 5/2.0 (+1) | 1,718 (-6%) | 10mo | $192,000 | $112 | 54 |
| 1413 Seminole Ave NW | 0.45mi | 3/1.0 (-1) | 1,617 (-11%) | 4mo | $135,000 | $83 | 50 |
| 1311 Burch Ave Ave NW | 0.56mi | 3/1.0 (-1) | 1,640 (-10%) | 4mo | $180,000 | $110 | 47 |
| 403 6th Ave SW | 0.73mi | 4/2.0 | 1,720 (-6%) | 9mo | $168,000 | $98 | 47 |
| 1119 18th St St | 0.75mi | 3/1.0 (-1) | 1,649 (-9%) | 1mo | $240,000 | $146 | 41 |
| 1605 11th Ave | 0.74mi | 4/2.0 | 1,584 (-13%) | 1mo | $215,000 | $136 | 41 |
| 712 8th St | 0.69mi | 3/1.5 (-1) | 1,629 (-10%) | 6mo | $163,000 | $100 | 40 |
Match score weights: distance 35% · size 25% · config 20% · recency 20%. Top-matched comps best support the ARV.
Projected returns pro-forma
-3.0% appreciation · 8.0% rent growth · sell at horizon
- IRR
- 30.2%
- Equity multiple
- 2.36×
- Total profit
- $34,298
- Equity at exit
- $13,419
- IRR
- 40.5%
- Equity multiple
- 5.90×
- Total profit
- $123,515
- Equity at exit
- $7,782
Cash invested: $25,200 (down + closing). Projections, not guarantees.
Landlord ↔ Tenant lean methodology
- Overall (STATE)
- 83 Strongly Landlord-Friendly
- State Iowa
- 83 Strongly Landlord-Friendly · R+6
- County
- — inherits STATE
- City
- — inherits STATE
ZIP-level market 52405
- Rents YoY
- 12.4%
- Active inventory
- 148
- Price-to-rent
- 4.3×
Monthly cashflow live
- Estimated rent
- $1,761 medium interval (Pro) →
- Mortgage (P&I)
- −$472
- Tax from tax record
- −$262 /mo · $3,148/yr
- Insurance
- −$38
- HOA
- −$0
- Vacancy / Maint / Mgmt
- −$370
- Net cashflow
- $619
Break-even live
Sensitivity live
| Price | -10% $670 | -5% $645 | +0% $619 | +5% $594 | +10% $569 |
|---|---|---|---|---|---|
| Rent | -10% $480 | -5% $550 | +0% $619 | +5% $689 | +10% $759 |
| Rate | -1.0pp $665 | -0.5pp $642 | base $619 | +0.5pp $596 | +1.0pp $572 |
UW: 25.0% down · 7.5% · 30yr · 1.5% tax · 5.0% vac · 8.0% maint · 8.0% mgmt
Financing live
Cash to close
- Down payment
- $22,500
- Closing costs
- $2,700
- Reserves months
- —
- Total cash needed
- —
Loan-product check · same deal, 3 products live
Conventional
25% down · 7.5% · 30yr
- Down + closing
- —
- Monthly P&I
- —
- Monthly cashflow
- —
- DSCR
- —
- Eligible?
- —
Personal DTI + credit; lowest rate.
DSCR
20% down · 8.5% · 30yr
- Down + closing
- —
- Monthly P&I
- —
- Monthly cashflow
- —
- DSCR
- —
- Eligible?
- —
No personal income docs; deal must DSCR.
Hard money
10% down · 12.0% · 12mo
- Down + closing
- —
- Monthly P&I
- —
- Monthly cashflow
- —
- DSCR
- —
- Eligible?
- —
Short-term bridge; refi at stabilization.
Rent comps 1 comps
| Address | Beds | Baths | Sqft | Rent | $/sqft | DOM | Units | Dist |
|---|---|---|---|---|---|---|---|---|
| 1001 C Ave NW Cedar Rapids, IA | 3.0 | 1.5 | 1446 | $1,500 | $1.04 | 14d | 1 | 0.27mi |
Listing history 7 events
-
2026-05-08status Pending 799-char remark
Show marketing remark (799 chars)
4/30/26_ HUD preliminary accepted an offer. Will mark SP as soon as contract is ratified. Step into this grand 2 story home, with four bedrooms and one and half baths. As you enter your greeted with a ornate staircase and high ceilings and a 1st floor bedroom. Spacious rooms and the side enclosed porch is a plus and some updates have been made over the years. Neutural walls and flooring make it easier to make your own. The second level has 3 bedrooms, a full bath with laundry. Outside you have a nice sized yard fenced in and a parking spot off the alley. Property is located in a flood zone per FEMA map. This property is managed by Raine Companies and is an exclusive listing. For more infomation and bidding periods visit www. hudhomestore. com, case #161-388153. Hud properties are sold as.
-
2026-04-20$90,000 Active 799-char remark
Show marketing remark (799 chars)
4/30/26_ HUD preliminary accepted an offer. Will mark SP as soon as contract is ratified. Step into this grand 2 story home, with four bedrooms and one and half baths. As you enter your greeted with a ornate staircase and high ceilings and a 1st floor bedroom. Spacious rooms and the side enclosed porch is a plus and some updates have been made over the years. Neutural walls and flooring make it easier to make your own. The second level has 3 bedrooms, a full bath with laundry. Outside you have a nice sized yard fenced in and a parking spot off the alley. Property is located in a flood zone per FEMA map. This property is managed by Raine Companies and is an exclusive listing. For more infomation and bidding periods visit www. hudhomestore. com, case #161-388153. Hud properties are sold as.
-
2023-07-01status Pending
-
2023-06-16$155,000 Active
-
2019-08-15soldstatus $129,500
-
2019-08-14soldstatus $129,450
-
2019-07-09$125,950
ⓘ Source: listings_history table (triggers on properties + properties_extension) + one-shot
backfill from property_details.listing_events for pre-trigger history.
Tax reassessment forecast IA · Partial reset (capped growth)
- Current annual tax
- $3,148 · $262/mo
- Projected year-2 tax
- $3,148 · $262/mo
- Expected delta
- $0/yr ($0/mo · 0.0%)
ⓘ Screening estimate from a state-policy table — verify with the county assessor before closing.
Climate risk First Street
- Flood 3/10 Moderate FEMA zone X (shaded) · 16% chance over 30 yrs
- Wildfire 1/10 Low
- Heat 3/10 Moderate 7 d/yr ≥103°F today · 15 d/yr by 30 yrs out
- Wind 2/10 Low
- Air quality 2/10 Low 0 unhealthy d/yr today · 1 by 30 yrs out
Nearby sold comps map
Loading sold comps map…
Walkable amenities ~0.75 mi
Loading nearby amenities…
Taxation est. · year 1
- Rental income
- $21,134
- − Mortgage interest
- −$5,041
- − Property taxes
- −$3,148
- − Insurance
- −$450
- − Repairs & maintenance
- −$1,691
- − Management
- −$1,691
- − Depreciation
- −$2,618
- Taxable income
- $6,495
- Est. tax owed @ 24.0%
- −$1,559
- After-tax cash flow
- $5,875/yr
For passive investors: Depreciation is non-cash, so a rental often shows a tax loss while cash-flowing — sheltering income. Rental losses are passive: they offset passive income freely, and up to $25,000/yr can offset ordinary (W-2) income if you actively participate and your MAGI is under $100k (phasing out to $0 by $150k); unused losses carry forward. On sale, claimed depreciation is recaptured at up to 25%, and gains may owe capital-gains tax (a 1031 exchange can defer both). Figures are a year-1 estimate at your 24.0% rate — not tax advice; consult a CPA.
Schools (NCES district)
- District
- Cedar Rapids Community School District
- NCES district ID
- 1906540
- Math proficiency
- 50% ▼ -12.00%
- Reading proficiency
- 59% ▼ -6.00%
- Median HH income
- $53,568
- Composite
- 46.82/100
- National rank
- #2378
- State rank
- #265 of 289 in IA
Livability — Cedar Rapids
- Score
- 78/100
- State rank
- #134
- US rank
- #2474
Category grades
Schools grade is shown separately in the Schools card above.
Census & demographics
- Census place
- Cedar Rapids, IA
- County
- Linn County · 179,860 people
- City population
- 137,154
- Metro
- Cedar Rapids, IA
- Population (ZIP)
- 26,526
- Household income
- $70,123
- Rent vs Own
- Severe rent burden
- 715.0
Population outlook (Linn County) Hauer SSP2
- Today (2025)
- 239,589 people
- By 2030
- 248,587 · +3.8%
- By 2040
- 264,817 · +10.5%
- By 2050
- 278,685 · +16.3%
- By 2075
- 311,754 · +30.1%
- By 2100
- 336,773 · +40.6%
Race, ethnicity, and origin ACS 2023
- Neighborhood character
- Predominantly White (79%)
- Race & ethnicity
- White 79% Black 9% Two or more races 7% Hispanic / Latino 5% Asian 2%
- Common ancestry
- Portuguese 4% Lithuanian 2% Iranian 1%
- Foreign-born
- 6% · Canada, China
- Languages at home
- 92% English-only · Spanish 3% French/Haitian/Cajun 1% Other Asian/Pacific 1%
Political lean MEDSL · Linn
- 2024 margin
- Lean D (+9.9) · D 54.2% · R 44.3% · Other 1.4%
- 2008→2024 swing
- -11.6pp toward R · 2008: 21.5pp · 2024: 9.9pp
- All cycles
- 2024: D+9.9 2020: D+13.7 2016: D+9.0 2012: D+17.6 2008: D+21.5
Not yet ingested
- Civics
- —
Market trends
- HPI YoY
- ▼ -137.56%
- Current HPI
- 201.6053
- Rent YoY
- ▲ 12.37%
- Metro
- Cedar Rapids, IA
- State GDP YoY
- ▲ 2.48%
- F500 in state
- 4
Industry mix (Fortune 500 HQ in IA)
| Industry | F500 HQs | Revenue |
|---|---|---|
| Financial Services | 1 | $16B |
|
||
| Retail / Convenience | 1 | $15B |
|
||
Price history
-28.5% since first listed7 events — show timeline
- 2026-05-08 Pending — CRAAR, CDRMLS
- 2026-04-20 Listed $90,000 CRAAR, CDRMLS
- 2023-07-01 Pending — CRAAR, CDRMLS
- 2023-06-16 Listed $155,000 CRAAR, CDRMLS
- 2019-08-15 Sold (Public Records) $129,500 Public Records
- 2019-08-14 Sold (MLS) $129,450 CRAAR, CDRMLS
- 2019-07-09 Listed $125,950 CRAAR, CDRMLS
Property tax history
+6.6%/yrLatest (2025): $3,148 · +21.5% YoY. Source: county tax records.
Cash-flow waterfall
monthlySold comps — $/sqft
last 12 mo · ≤1 miLoading sold comps…