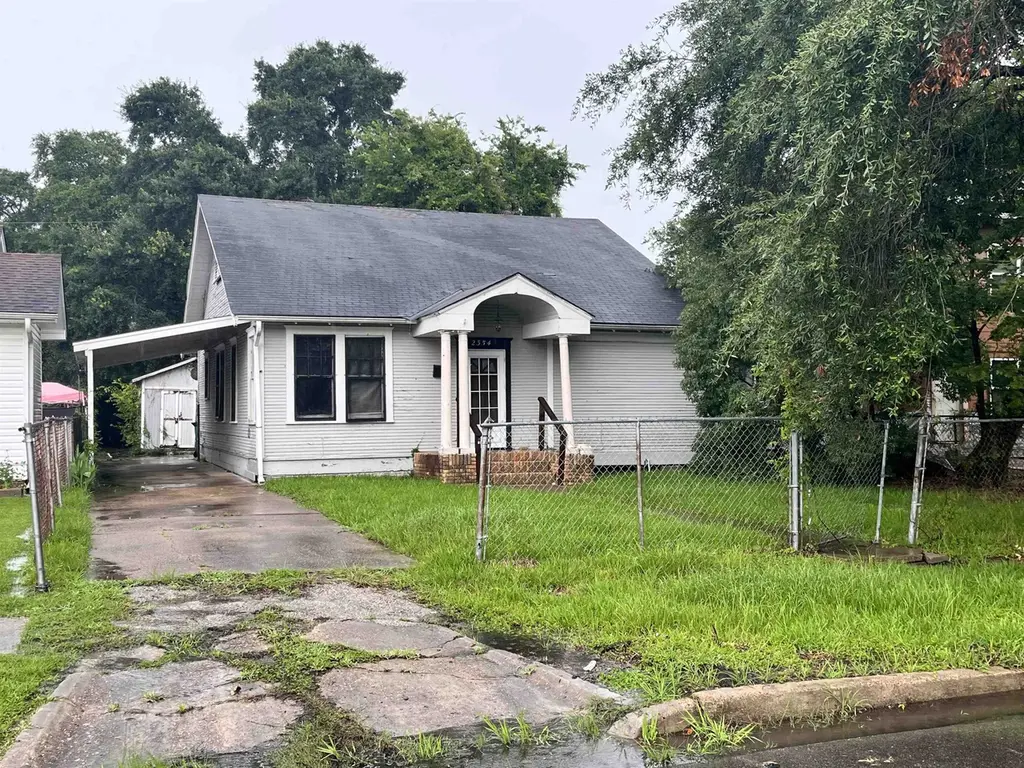
2354 Angelina St · Beaumont, TX
Flood risk 6/10 · Moderate
- FEMA flood zone
- X
- Chance of flooding over 30 yrs
- 0.72%
- Est. flood insurance / yr
- $507 – $1,088
Fire risk 1/10 · Minimal
- Est. fire insurance / yr
- $1,222 – $2,270
Heat risk 9/10 · Severe
- Hot days now (above 109°F)
- 7 days/yr
- Hot days in 30 yrs
- 24 days/yr
Wind risk 9/10 · Severe
- Chance of severe wind over 30 yrs
- 99.0%
Air-quality risk 2/10 · Minimal
- Unhealthy air days now
- 1 days/yr
- Unhealthy air days in 30 yrs
- 1 days/yr
Risk factors via First Street. Map © Google.
Why this score? — see what drove the B- grade
The composite is a weighted blend of 9 inputs, each scored 0–100. Each bar is that input's sub-score; the figure is the points it added to the 100-point composite (weight × sub-score).
- Cash flow +30.0/30.0
- 1% rule +10.0/10.0
- DSCR +10.0/10.0
- ARV discount +7.5/15.0
- Livability +3.2/5.0
- Rent growth +2.5/5.0
- Condition / age +2.5/5.0
- Schools +1.5/10.0
- Appreciation +0.0/10.0
$59,900
🖨 Deal sheet 📄 Offer letter ✓ Due diligence
Listing remarks
BANK OWNED FORECLOSURE. 2/1/1CP COTTAGE HOME LOCATED IN THE HEART OF OLD TOWN; THIS HOME HAS ALL THE CHARACTER AND CHARM THAT WAS SO COMMON WITH COTTAGE HOMES BUILT BACK IN THAT TIME PERIOD INCLUDING ORIGINAL SOLID WOOD FLOORS, TALLER CEILINGS, LARGE BEDROOMS; VERY SPACIOUS KITCHEN / BREAKFAST AREA COMBO FOR THIS PARTICULAR TIME PERIOD HOME WHICH ADDS SOME MODERN CONVENIENCES/FUNCTIONALITY TO GO WITH THE OLD SCHOOL CHARACTER AND CHARM; HOME NEEDS SOME TLC TO GET IT READY TO OCCUPY BUT HAS A TON OF POTENTIAL AS A FANTASTIC RENTAL HOME FOR AN INVESTOR OR AS A FIRST TIME HOMEOWNER READY TO MAKE IT THEIR HOME!
Key facts
- 6,970 sq ft lot
- Parking
Property features AI
Exterior
- Parking: Attached carport; 1 carport space
- Utilities: Public water; Public sewer; Cable available
- Home design: Single-family residence; Residential property; Located in the Oaks subdivision; Access via public maintained road
- Construction: Frame construction; Composition roof
- Exterior features: Covered patio; Patio; Chain link fencing; Storage structure
Interior
- Kitchen: Dishwasher; Pantry
- Flooring: Tile; Wood
- Bathrooms: 1 full bathroom
- Heating & cooling: Central heating (natural gas); Central air conditioning
- Interior features: Pantry; Dishwasher
Neighborhood map
What this means for you Summary
Snapshot
- This is a 2-bed/1.0-bath single-family listed at $60k.
Deal economics
- At list price, monthly cash flow is $573 ($7k/yr) — positive.
- The deal already cash-flows at list — no discount required.
- Meets the 1% rule at list price ($1k rent vs $60k).
- Cap rate 17.8% vs local median 5.3% in Beaumont — top-decile yield for the area; either an underpriced asset or a hidden risk that comps aren't pricing in. Stress-test before assuming the spread holds.
Location & tenants
- Location reads 64/100 on livability (#739 in TX) — a middle-class / working-renter tenant base. Strengths: cost of living A+, housing A+, health & safety A+; Watch: employment D, schools D-, crime F.
- Beaumont ISD (urban): math 14% / reading 22% proficiency, ranked #789 of 826 in TX (top 96%) — low school quality limits family demand, transient renter base, plan for 1-2y turnover; 69% free/reduced lunch — lower-income household profile, screen leases tightly.
- Market conditions: 26 active listings in the ZIP; 13 comparable units currently listed for rent nearby; rentals at typical pace (median 24d on market — plan ~3-4 weeks tenant-placement turnaround); 343 units permitted in Jefferson County in 2024 (0 in 5+ unit buildings).
Forward outlook
- Local home prices are declining (-3.0%/yr); year-one equity from $414 of loan paydown is wiped out by about $2k of value loss. Plan a longer hold.
- At projected returns (-3.0% appreciation + 3.0% rent growth), your $17k cash investment doubles in ~3 years — after that, you're playing with house money.
Negotiation context
- Only 1 days on market — expect competitive offers; lowballing is unlikely to land.
Risks & watch-outs
- Watch-outs: property tax is 3.8% of price.
- Climate carrying-cost: major flood risk; severe wind risk, 99% chance of damaging wind over 30y; extreme-heat days projected 7→24/yr by 2055 (HVAC capex compounding) — expect insurance premiums to compound above CPI over the hold.
Questions for the listing agent
- Built in 1962 — when were the roof, HVAC, electrical panel, plumbing, and water heater last replaced?
- Property tax is high relative to price — has the assessment been appealed recently, and will the sale trigger a re-assessment?
- Is there a deadline driving the sale (1031 exchange, divorce, estate, relocation)? That informs how much negotiation room exists.
- Schools are D-rated, which usually means shorter tenancies and higher turnover. Who's the typical renter profile here, and what's been the actual vacancy rate?
- Crime grade is F in this area — have there been break-ins, vandalism, or insurance claims at this property in the last 3 years? What carrier currently insures it and at what premium?
- What's the average days-on-market for RENTAL listings here right now (not sales)? A rising rental-DOM trend means longer vacancies and softer asking-rent achievability than the comps imply.
- What's the recent tenant-quality profile in this submarket — average credit score on applications, eviction rate, late-payment / NSF rate, and stable-employment percentage? A property-management company in the area should have these aggregated.
- How much new for-sale + rental construction is in the pipeline within 1–3 miles? Heavy new supply typically softens prices + rents 12–24 months out; constrained supply supports both.
Investment metrics
- 1% rule
- 2.33% ✓
- Cap rate
- 17.77%
- Cash-on-cash
- 40.98%
- DSCR
- 2.82
- GRM
- 3.6
CMA / ARV
- ARV (on-the-fly)
- $139,593
- Comps found
- 2
Show comp detail 2 sales within ~0.75 mi
| Address | Dist | Beds/Ba | Sqft | Sold | Price | $/sf | Match |
|---|---|---|---|---|---|---|---|
| 2320 Rusk St | 0.09mi | 3/1.5 (+1) | 1,620 (+8%) | 2mo | $75,000 | $46 | 74 |
| 2380 Hazel St | 0.61mi | 3/2.0 (+1) | 1,694 (+13%) | 22mo | $157,900 | $93 | 23 |
Match score weights: distance 35% · size 25% · config 20% · recency 20%. Top-matched comps best support the ARV.
Projected returns pro-forma
-3.0% appreciation · 3.0% rent growth · sell at horizon
- IRR
- 37.6%
- Equity multiple
- 2.60×
- Total profit
- $26,868
- Equity at exit
- $8,931
- IRR
- 44.2%
- Equity multiple
- 5.22×
- Total profit
- $70,747
- Equity at exit
- $5,179
Cash invested: $16,772 (down + closing). Projections, not guarantees.
Landlord ↔ Tenant lean methodology
- Overall (STATE)
- 87 Strongly Landlord-Friendly
- State Texas
- 87 Strongly Landlord-Friendly · R+5
- County
- — inherits STATE
- City
- — inherits STATE
ZIP-level market 77702
- Home prices YoY
- -25.3%
- Active inventory
- 26
- Price-to-rent
- 3.6×
Monthly cashflow live
- Estimated rent
- $1,395 high interval (Pro) →
- Mortgage (P&I)
- −$314
- Tax from tax record
- −$190 /mo · $2,280/yr
- Insurance
- −$25
- HOA
- −$0
- Vacancy / Maint / Mgmt
- −$293
- Net cashflow
- $573
Break-even live
UW: 25.0% down · 7.5% · 30yr · 1.5% tax · 5.0% vac · 8.0% maint · 8.0% mgmt
Financing live
Cash to close
- Down payment
- $14,975
- Closing costs
- $1,797
- Reserves months
- —
- Total cash needed
- —
Loan-product check · same deal, 3 products live
Conventional
25% down · 7.5% · 30yr
- Down + closing
- —
- Monthly P&I
- —
- Monthly cashflow
- —
- DSCR
- —
- Eligible?
- —
Personal DTI + credit; lowest rate.
DSCR
20% down · 8.5% · 30yr
- Down + closing
- —
- Monthly P&I
- —
- Monthly cashflow
- —
- DSCR
- —
- Eligible?
- —
No personal income docs; deal must DSCR.
Hard money
10% down · 12.0% · 12mo
- Down + closing
- —
- Monthly P&I
- —
- Monthly cashflow
- —
- DSCR
- —
- Eligible?
- —
Short-term bridge; refi at stabilization.
Rent comps 13 comps
| Address | Beds | Baths | Sqft | Rent | $/sqft | DOM | Units | Dist |
|---|---|---|---|---|---|---|---|---|
| 2565 Harrison Ave Beaumont, TX | 3.0 | 2.0 | 1789 | $2,150 | $1.20 | 44d | 1 | 0.73mi |
| 2290 Long Ave Unit 05 Beaumont, TX | 2.0 | 1.0 | 1055 | $950 | $0.90 | 23d | 1 | 0.76mi |
| 2640 Harrison Ave Beaumont, TX | 3.0 | 1.0 | 1158 | $1,295 | $1.12 | 23d | 1 | 0.81mi |
| 2260 Ashley St Beaumont, TX | 3.0 | 2.0 | 1471 | $1,595 | $1.08 | 14d | 1 | 0.83mi |
| 690 E Avenue Unit A Beaumont, TX | 3.0 | 1.0 | 1300 | $975 | $0.75 | 14d | 1 | 0.87mi |
| 2525 Louisiana St Beaumont, TX | 2.0 | 1.0 | 1516 | $1,485 | $0.98 | 23d | 1 | 1.03mi |
| 355 N 18th St Beaumont, TX | 3.0 | 2.0 | 1050 | $1,395 | $1.33 | 44d | 1 | 1.06mi |
| 3720 Laurel Ave Unit Laurel Ave unit 12 Beaumont, TX | 2.0 | 1.5 | 1188 | $1,095 | $0.92 | 23d | 1 | 1.20mi |
| 3720 Laurel St #6 Beaumont, TX | 2.0 | 1.5 | 1152 | $1,095 | $0.95 | 14d | 1 | 1.21mi |
| 701 Trinity St #450 Beaumont, TX | 2.0 | 2.5 | 1586 | $2,100 | $1.32 | 14d | 1 | 1.28mi |
| 2570 Sweetgum Ln Beaumont, TX | 1.0–2.0 | 1.0–1.5 | 876 | $1,599 | $1.82 | 14d | 15 | 1.32mi |
| 2020 Cottonwood St Beaumont, TX | 2.0–4.0 | 1.0 | 928 | $1,123 | $1.21 | 14d | 9 | 1.48mi |
| 1545 Avenue B Beaumont, TX | 2.0 | 1.0 | 1212 | $695 | $0.57 | 44d | 1 | 1.49mi |
Listing history 2 events
-
2026-06-18remarks 613-char remark
-
2026-06-18$59,900 Active 1 DOM
ⓘ Source: listings_history table (triggers on properties + properties_extension) + one-shot
backfill from property_details.listing_events for pre-trigger history.
Tax reassessment forecast TX · Resets to sale price
- Current annual tax
- $2,280 · $190/mo
- Projected year-2 tax
- $2,280 · $190/mo
- Expected delta
- $0/yr ($0/mo · 0.0%)
ⓘ Screening estimate from a state-policy table — verify with the county assessor before closing.
Climate risk First Street
- Flood 6/10 Major FEMA zone X · 72% chance over 30 yrs
- Wildfire 1/10 Low
- Heat 9/10 Extreme 7 d/yr ≥109°F today · 24 d/yr by 30 yrs out
- Wind 9/10 Extreme 99% chance of damaging wind over 30 yrs
- Air quality 2/10 Low 1 unhealthy d/yr today · 1 by 30 yrs out
Nearby sold comps map
Loading sold comps map…
Walkable amenities ~0.75 mi
Loading nearby amenities…
Taxation est. · year 1
- Rental income
- $16,737
- − Mortgage interest
- −$3,355
- − Property taxes
- −$2,280
- − Insurance
- −$300
- − Repairs & maintenance
- −$1,339
- − Management
- −$1,339
- − Depreciation
- −$1,743
- Taxable income
- $6,382
- Est. tax owed @ 24.0%
- −$1,532
- After-tax cash flow
- $5,342/yr
For passive investors: Depreciation is non-cash, so a rental often shows a tax loss while cash-flowing — sheltering income. Rental losses are passive: they offset passive income freely, and up to $25,000/yr can offset ordinary (W-2) income if you actively participate and your MAGI is under $100k (phasing out to $0 by $150k); unused losses carry forward. On sale, claimed depreciation is recaptured at up to 25%, and gains may owe capital-gains tax (a 1031 exchange can defer both). Figures are a year-1 estimate at your 24.0% rate — not tax advice; consult a CPA.
Schools (NCES district)
- District
- Beaumont ISD
- NCES district ID
- 4809670
- Math proficiency
- 14% ▼ -13.00%
- Reading proficiency
- 22% ▼ -7.00%
- Median HH income
- $41,683
- Composite
- 15.43/100
- National rank
- #9316
- State rank
- #789 of 826 in TX
Livability — Beaumont
- Score
- 64/100
- State rank
- #739
- US rank
- #13710
Category grades
Schools grade is shown separately in the Schools card above.
Census & demographics
- Census place
- Beaumont, TX
- City population
- 125,901
- Population (ZIP)
- 3,497
Population outlook (Jefferson County) Hauer SSP2
- Today (2025)
- 259,015 people
- By 2030
- 260,685 · +0.6%
- By 2040
- 263,309 · +1.7%
- By 2050
- 265,237 · +2.4%
- By 2075
- 270,193 · +4.3%
- By 2100
- 255,628 · -1.3%
Race, ethnicity, and origin ACS 2023
- Neighborhood character
- Highly diverse neighborhood (Simpson 0.73)
- Race & ethnicity
- Black 31% Hispanic / Latino 30% White 27% Two or more races 18% Asian 8%
- Hispanic origin (detail)
- Mexican 28%
- Common ancestry
- Lithuanian 2% Slovak 2% Serbian 1%
- Foreign-born
- 21% · Canada
- Languages at home
- 73% English-only · Spanish 25% Arabic 1%
Political lean MEDSL · Jefferson
- 2024 margin
- Lean R (+8.9) · D 45.1% · R 54.0%
- 2008→2024 swing
- -11.1pp toward R · 2008: 2.2pp · 2024: -8.9pp
- All cycles
- 2024: R+8.9 2020: R+1.6 2016: R+0.5 2012: D+1.6 2008: D+2.2
Not yet ingested
- Civics
- —
Market trends
- HPI YoY
- ▼ -46.58%
- Current HPI
- 137.5454
- Rent YoY
- —
- Metro
- —
- State GDP YoY
- ▲ 3.95%
- F500 in state
- 110
Industry mix (Fortune 500 HQ in TX)
| Industry | F500 HQs | Revenue |
|---|---|---|
| Energy | 16 | $1,198B |
|
||
| Technology | 5 | $198B |
|
||
| Engineering / Construction | 4 | $72B |
|
||
| Energy Services | 3 | $60B |
|
||
| Utilities | 3 | $41B |
|
||
| Healthcare | 2 | $330B |
|
||
Price history
1 event — show timeline
- 2026-06-15 Listed $59,900 BBOR
Property tax history
+3.5%/yrLatest (2025): $2,280 · +11.5% YoY. Source: county tax records.
Cash-flow waterfall
monthlySold comps — $/sqft
last 12 mo · ≤1 miLoading sold comps…