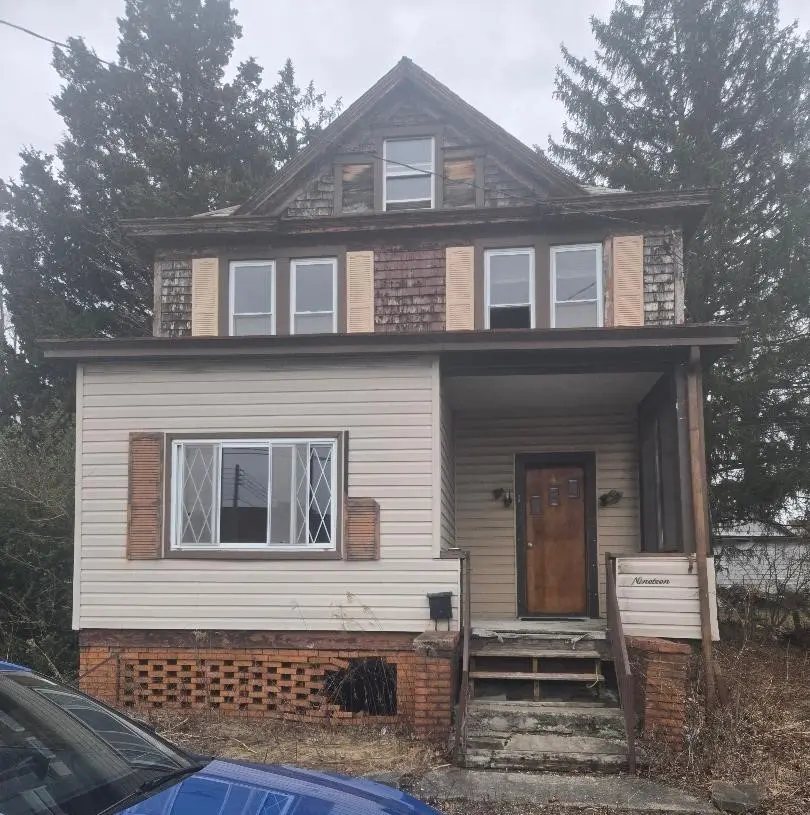
19 John St · Uniontown, PA
Flood risk 1/10 · Minimal
- FEMA flood zone
- X (unshaded)
- Chance of flooding over 30 yrs
- 0.0%
- Est. flood insurance / yr
- $473 – $860
Fire risk 1/10 · Minimal
- Est. fire insurance / yr
- $511 – $949
Heat risk 4/10 · Minor
- Hot days now (above 96°F)
- 7 days/yr
- Hot days in 30 yrs
- 19 days/yr
Wind risk 2/10 · Minimal
- Chance of severe wind over 30 yrs
- —
Air-quality risk 2/10 · Minimal
- Unhealthy air days now
- 1 days/yr
- Unhealthy air days in 30 yrs
- 2 days/yr
Risk factors via First Street. Map © Google.
Why this score? — see what drove the B grade
The composite is a weighted blend of 9 inputs, each scored 0–100. Each bar is that input's sub-score; the figure is the points it added to the 100-point composite (weight × sub-score).
- Cash flow +30.0/30.0
- 1% rule +10.0/10.0
- DSCR +10.0/10.0
- ARV discount +7.5/15.0
- Livability +3.5/5.0
- Schools +3.1/10.0
- Rent growth +2.5/5.0
- Condition / age +2.5/5.0
- Appreciation +0.9/10.0
$51,000
🖨 Deal sheet (PDF) 📄 Offer letter ✓ Due diligence
Listing remarks MLS
Investor Alert! Large 4 bedroom home situated on corner lot.
Key facts
- 5,662 sq ft lot
- Parking
- Built 1930
Neighborhood map
What this means for you Summary
Snapshot
- This is a 4-bed/1.0-bath single-family listed at $51k.
Deal economics
- At list price, monthly cash flow is $501 ($6k/yr) — positive.
- The deal already cash-flows at list — no discount required.
- Meets the 1% rule at list price ($1k rent vs $51k).
- Recommended offer: $46k (9.0% below list) — sets the bar for market timing.
Location & tenants
- Location reads 70/100 on livability (#750 in PA) — a middle-class / working-renter tenant base. Strengths: cost of living A+, health & safety A+, housing A; Watch: amenities D+, crime F, commute F.
- Uniontown Area SD (suburban): math 27% / reading 49% proficiency, ranked #392 of 539 in PA (top 73%) — families likely to look elsewhere, expect single-tenant / working-renter base with shorter leases.
- Zoned schools: Lafayette El Sch (math 8% / reading 22%, grade F, #1,323 of 1,518 statewide, top 89%, 259 students, 89% FRL); Lafayette Ms (math 2% / reading 22%, grade F, #487 of 512 statewide, top 95%, 149 students, 95% FRL); Uniontown Area Shs (math 77%, 668 students, 74% FRL) — zoned schools average 86% FRL vs 56% district-wide (30 pts higher); higher-poverty schools than district average — tighter screening recommended.
- Zoned-school proficiency averages 14% at this address vs 38% district-wide (-24 pts) — the specific schools serving this property underperform the Uniontown Area SD average; the district grade overstates school quality for this exact location.
- Market conditions: 147 active listings in the ZIP; 2 comparable units currently listed for rent nearby; 201 units permitted in Fayette County in 2024 (10 in 5+ unit buildings).
Forward outlook
- Local home prices are declining (-3.0%/yr); year-one equity from $353 of loan paydown is wiped out by about $2k of value loss. Plan a longer hold.
- Fayette County population projected at -19% by 2050 — secular population decline; favor cash flow + early exit over multi-decade hold.
- At projected returns (-3.0% appreciation + 3.0% rent growth), your $14k cash investment doubles in ~3 years — after that, you're playing with house money.
Negotiation context
- It's been on market 114 days — a 9% lower offer ($46k) is reasonable based on typical stale-listing flexibility.
Risks & watch-outs
- Watch-outs: property tax is 3.2% of price; built in 1930 — expect roof / HVAC / electrical / plumbing capex.
Questions for the listing agent
- It's been on market 114 days. Have you received any prior offers? Is the seller open to a 9% concession, seller financing, or rate buy-down credit?
- Built in 1930 — when were the roof, HVAC, electrical panel, plumbing, and water heater last replaced?
- Property tax is high relative to price — has the assessment been appealed recently, and will the sale trigger a re-assessment?
- Why hasn't it sold? Are there any deal-killer items the seller is aware of (foundation, flood, title, zoning, code violations)?
- Is there a deadline driving the sale (1031 exchange, divorce, estate, relocation)? That informs how much negotiation room exists.
- Crime grade is F in this area — have there been break-ins, vandalism, or insurance claims at this property in the last 3 years? What carrier currently insures it and at what premium?
- What's the average days-on-market for RENTAL listings here right now (not sales)? A rising rental-DOM trend means longer vacancies and softer asking-rent achievability than the comps imply.
- What's the recent tenant-quality profile in this submarket — average credit score on applications, eviction rate, late-payment / NSF rate, and stable-employment percentage? A property-management company in the area should have these aggregated.
- How much new for-sale + rental construction is in the pipeline within 1–3 miles? Heavy new supply typically softens prices + rents 12–24 months out; constrained supply supports both.
Investment metrics
- 1% rule
- 2.30% ✓
- Cap rate
- 18.09%
- Cash-on-cash
- 42.12%
- DSCR
- 2.87
- GRM
- 3.6
CMA / ARV
- ARV (median comp)
- $154,847
- List price
- $51,000
- Delta
- -67.06%
- Verdict
- UNDERPRICED
- Comps
- 20 within 1.0 mi
Show comp detail 7 sales within ~0.75 mi
| Address | Dist | Beds/Ba | Sqft | Sold | Price | $/sf | Match |
|---|---|---|---|---|---|---|---|
| 15 Reppert Blvd | 0.13mi | 3/1.0 (-1) | 1,440 (-5%) | 6mo | $159,500 | $111 | 75 |
| 64 Reppert Blvd | 0.24mi | 3/1.5 (-1) | 1,504 (-1%) | 23mo | $125,000 | $83 | 61 |
| 11 Sterling St | 0.39mi | 3/1.5 (-1) | 1,614 (+6%) | 9mo | $195,000 | $121 | 57 |
| 551 Johnston Ave | 0.51mi | 3/1.0 (-1) | 1,574 (+4%) | 16mo | $23,000 | $15 | 52 |
| 26 Jane St | 0.31mi | 3/1.5 (-1) | 1,456 (-4%) | 24mo | $165,000 | $113 | 52 |
| 50 Reppert Blvd | 0.22mi | 3/2.5 (-1) | 1,344 (-12%) | 16mo | $156,900 | $117 | 46 |
| 207 Ruby Dr | 0.35mi | 3/2.0 (-1) | 1,699 (+12%) | 11mo | $457,290 | $269 | 46 |
Match score weights: distance 35% · size 25% · config 20% · recency 20%. Top-matched comps best support the ARV.
Projected returns pro-forma
-3.0% appreciation · 3.0% rent growth · sell at horizon
- IRR
- 38.9%
- Equity multiple
- 2.66×
- Total profit
- $23,720
- Equity at exit
- $7,604
- IRR
- 45.3%
- Equity multiple
- 5.34×
- Total profit
- $62,013
- Equity at exit
- $4,410
Cash invested: $14,280 (down + closing). Projections, not guarantees.
Landlord ↔ Tenant lean methodology
- Overall (STATE)
- 62 Landlord-Friendly
- State Pennsylvania
- 62 Landlord-Friendly · EVEN
- County
- — inherits STATE
- City
- — inherits STATE
ZIP-level market 15401
- Home prices YoY
- -3.8%
- Active inventory
- 147
- Price-to-rent
- 3.6×
Monthly cashflow live
- Estimated rent
- $1,173 medium interval (Pro) →
- Mortgage (P&I)
- −$267
- Tax from tax record
- −$137 /mo · $1,641/yr
- Insurance
- −$21
- HOA
- −$0
- Vacancy / Maint / Mgmt
- −$246
- Net cashflow
- $501
Break-even live
Sensitivity live
| Price | -10% $530 | -5% $516 | +0% $501 | +5% $487 | +10% $472 |
|---|---|---|---|---|---|
| Rent | -10% $409 | -5% $455 | +0% $501 | +5% $548 | +10% $594 |
| Rate | -1.0pp $527 | -0.5pp $514 | base $501 | +0.5pp $488 | +1.0pp $475 |
UW: 25.0% down · 7.5% · 30yr · 1.5% tax · 5.0% vac · 8.0% maint · 8.0% mgmt
Financing live
Cash to close
- Down payment
- $12,750
- Closing costs
- $1,530
- Reserves months
- —
- Total cash needed
- —
Loan-product check · same deal, 3 products live
Conventional
25% down · 7.5% · 30yr
- Down + closing
- —
- Monthly P&I
- —
- Monthly cashflow
- —
- DSCR
- —
- Eligible?
- —
Personal DTI + credit; lowest rate.
DSCR
20% down · 8.5% · 30yr
- Down + closing
- —
- Monthly P&I
- —
- Monthly cashflow
- —
- DSCR
- —
- Eligible?
- —
No personal income docs; deal must DSCR.
Hard money
10% down · 12.0% · 12mo
- Down + closing
- —
- Monthly P&I
- —
- Monthly cashflow
- —
- DSCR
- —
- Eligible?
- —
Short-term bridge; refi at stabilization.
Rent comps 2 comps
| Address | Beds | Baths | Sqft | Rent | $/sqft | DOM | Units | Dist |
|---|---|---|---|---|---|---|---|---|
| 27 E Kerr St Unit B Uniontown, PA | 3.0 | 1.0 | 1248 | $800 | $0.64 | 45d | 1 | 0.95mi |
| 14 Leith St Uniontown, PA | 4.0 | 2.0 | 1848 | $1,600 | $0.87 | 45d | 1 | 1.09mi |
Listing history 17 events
-
2026-06-21days on market $51,000 Active 114 DOM
-
2026-06-21days on market $51,000 Active 113 DOM
-
2026-06-18days on market $51,000 Active 111 DOM
-
2026-06-17days on market $51,000 Active 110 DOM
-
2026-06-16days on market $51,000 Active 109 DOM
-
2026-06-15days on market $51,000 Active 108 DOM
-
2026-06-13days on market $51,000 Active 106 DOM
-
2026-06-12days on market $51,000 Active 105 DOM
-
2026-06-09days on market $51,000 Active 102 DOM
-
2026-06-08days on market $51,000 Active 101 DOM
-
2026-06-08days on market $51,000 Active 100 DOM
-
2026-06-07days on market $51,000 Active 99 DOM
-
2026-06-04days on market $51,000 Active 96 DOM
-
2026-06-02days on market $51,000 Active 95 DOM
-
2026-06-01days on market $51,000 Active 94 DOM
-
2026-05-31days on market $51,000 Active 93 DOM
-
2026-02-24$51,000 Active 61-char remark
Show marketing remark (61 chars)
Investor Alert! Large 4 bedroom home situated on corner lot.
ⓘ Source: listings_history table (triggers on properties + properties_extension) + one-shot
backfill from property_details.listing_events for pre-trigger history.
Tax reassessment forecast PA · Partial reset (capped growth)
- Current annual tax
- $1,641 · $137/mo
- Projected year-2 tax
- $1,641 · $137/mo
- Expected delta
- $0/yr ($0/mo · -0.0%)
ⓘ Screening estimate from a state-policy table — verify with the county assessor before closing.
Climate risk First Street
- Flood 1/10 Low FEMA zone X (unshaded) · 0% chance over 30 yrs
- Wildfire 1/10 Low
- Heat 4/10 Moderate 7 d/yr ≥96°F today · 19 d/yr by 30 yrs out
- Wind 2/10 Low
- Air quality 2/10 Low 1 unhealthy d/yr today · 2 by 30 yrs out
Nearby sold comps map
Loading sold comps map…
Walkable amenities ~0.75 mi
Loading nearby amenities…
Taxation est. · year 1
- Rental income
- $14,076
- − Mortgage interest
- −$2,857
- − Property taxes
- −$1,641
- − Insurance
- −$255
- − Repairs & maintenance
- −$1,126
- − Management
- −$1,126
- − Depreciation
- −$1,484
- Taxable income
- $5,587
- Est. tax owed @ 24.0%
- −$1,341
- After-tax cash flow
- $4,673/yr
For passive investors: Depreciation is non-cash, so a rental often shows a tax loss while cash-flowing — sheltering income. Rental losses are passive: they offset passive income freely, and up to $25,000/yr can offset ordinary (W-2) income if you actively participate and your MAGI is under $100k (phasing out to $0 by $150k); unused losses carry forward. On sale, claimed depreciation is recaptured at up to 25%, and gains may owe capital-gains tax (a 1031 exchange can defer both). Figures are a year-1 estimate at your 24.0% rate — not tax advice; consult a CPA.
Schools (NCES district)
- District
- Uniontown Area SD
- NCES district ID
- 4224150
- Math proficiency
- 27% ▼ -8.00%
- Reading proficiency
- 49% ▼ -6.00%
- Median HH income
- $36,744
- Composite
- 31.48/100
- National rank
- #5977
- State rank
- #392 of 539 in PA
Livability — Uniontown
- Score
- 70/100
- State rank
- #750
- US rank
- #7482
Category grades
Schools grade is shown separately in the Schools card above.
Census & demographics
- Census place
- Uniontown, PA
- Population (ZIP)
- 30,230
Population outlook (Fayette County) Hauer SSP2
- Today (2025)
- 127,561 people
- By 2030
- 123,206 · -3.4%
- By 2040
- 113,232 · -11.2%
- By 2050
- 103,468 · -18.9%
- By 2075
- 83,185 · -34.8%
- By 2100
- 62,384 · -51.1%
Race, ethnicity, and origin ACS 2023
- Neighborhood character
- Predominantly White (86%)
- Race & ethnicity
- White 86% Black 7% Two or more races 5% Hispanic / Latino 1%
- Common ancestry
- Romanian 8% Scotch-Irish 2% Iranian 1%
- Foreign-born
- 2% · Canada
- Languages at home
- 97% English-only · Spanish 1% Arabic 1%
Political lean MEDSL · Fayette
- 2024 margin
- Solid R (+37.9) · D 30.8% · R 68.7%
- 2008→2024 swing
- -37.5pp toward R · 2008: -0.4pp · 2024: -37.9pp
- All cycles
- 2024: R+37.9 2020: R+33.5 2016: R+31.0 2012: R+8.3 2008: R+0.4
Not yet ingested
- Civics
- —
Market trends
- HPI YoY
- ▼ -8.29%
- Current HPI
- 210.1257
- Rent YoY
- —
- Metro
- —
- State GDP YoY
- ▲ 1.68%
- F500 in state
- 34
Industry mix (Fortune 500 HQ in PA)
| Industry | F500 HQs | Revenue |
|---|---|---|
| Healthcare | 2 | $309B |
|
||
| Insurance | 2 | $27B |
|
||
| Telecommunications / Media | 1 | $124B |
|
||
| Industrial Distribution | 1 | $22B |
|
||
| Financial Services | 1 | $20B |
|
||
| Chemicals / Materials | 1 | $18B |
|
||
Price history
1 event — show timeline
- 2026-02-24 Listed $51,000 West Penn MLS
Property tax history
+2.3%/yrLatest (2026): $1,641 · +2.4% YoY. Source: county tax records.
Cash-flow waterfall
monthlySold comps — $/sqft
last 12 mo · ≤1 miLoading sold comps…