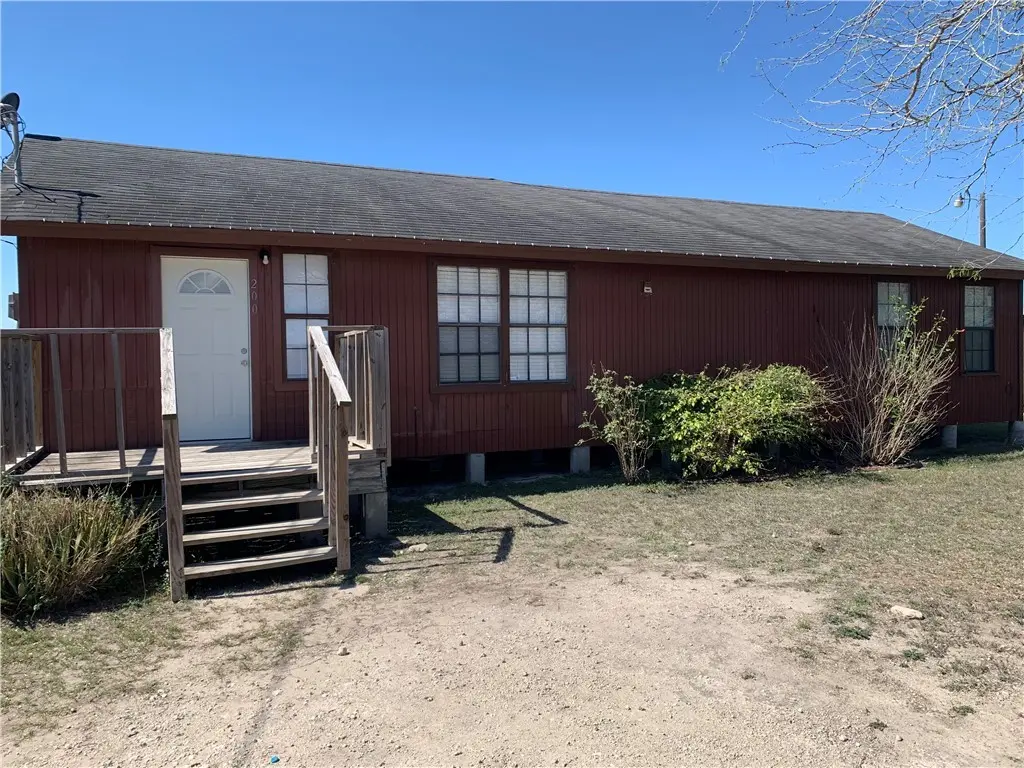
200 County Road 3211 · South La Paloma, TX
Flood risk 1/10 · Minimal
- FEMA flood zone
- X (unshaded)
- Chance of flooding over 30 yrs
- 0.0%
- Est. flood insurance / yr
- $507 – $1,088
Fire risk 7/10 · Major
- Est. fire insurance / yr
- $1,222 – $2,270
Heat risk 9/10 · Severe
- Hot days now (above 110°F)
- 7 days/yr
- Hot days in 30 yrs
- 21 days/yr
Wind risk 8/10 · Major
- Chance of severe wind over 30 yrs
- 99.0%
Air-quality risk 1/10 · Minimal
- Unhealthy air days now
- 0 days/yr
- Unhealthy air days in 30 yrs
- 0 days/yr
Risk factors via First Street. Map © Google.
Why this score? — see what drove the B grade
The composite is a weighted blend of 9 inputs, each scored 0–100. Each bar is that input's sub-score; the figure is the points it added to the 100-point composite (weight × sub-score).
- Cash flow +30.0/30.0
- DSCR +10.0/10.0
- 1% rule +9.3/10.0
- ARV discount +7.5/15.0
- Appreciation +5.7/10.0
- Schools +4.2/10.0
- Livability +2.8/5.0
- Rent growth +2.5/5.0
- Condition / age +2.2/5.0
$69,000
🖨 Deal sheet 📄 Offer letter ✓ Due diligence
Listing remarks
Located between Alice and Orange Grove just off Hwy 359, this 3 bedroom, 1 bathroom home sits on approximately 1.56 acres surrounded by mature trees and peaceful country surroundings. The home features a 50x20 structure with an estimated living area of approximately 1,000 sq. ft. ; however, tax records currently reflect 720 sq. ft. due to an addition not shown with the appraisal district. Property is in need of repairs and updates, offering excellent potential for an investor, handyman, or buyer looking to renovate and restore. Spacious lot provides plenty of room for outdoor living, expansion, or future improvements. Being sold as-is. Cash or conventional financing preferred.
Key facts
- 50x20 structure
- Spacious lot
- Outdoor living
Tags
Property features AI
Finance
- Other: Horses allowed on the property
- Financial info: No financial details provided
- HOA & community: Short-term rentals allowed
Exterior
- Parking: Gravel parking
- Security: No security features listed
- Utilities: Well water; Water available; Septic available
- Home design: Single-story home; Pillar/post/pier foundation
- Construction: Shingle roof; Shingle siding; Wood siding; Built or configured as a 1-story structure
- Exterior features: No notable exterior features listed; Chain link fencing
Interior
- Kitchen: Kitchen details not provided
- Bedrooms: Bedroom count not provided
- Flooring: Carpet; Vinyl
- Bathrooms: 1 full bathroom
- Heating & cooling: Window unit heating; Window unit cooling
- Interior features: No notable interior features listed
- Laundry & utility: Dryer hookup; Dryer included
Neighborhood map
What this means for you Summary
Snapshot
- This is a 3-bed/1.0-bath single-family listed at $69k. Condition is rated fair.
Deal economics
- At list price, monthly cash flow is $333 ($4k/yr) — positive.
- The deal already cash-flows at list — no discount required.
- Meets the 1% rule at list price ($989 rent vs $69k).
- Recommended offer: $68k (1.5% below list) — sets the bar for market timing.
Location & tenants
- Location reads 56/100 on livability (#1,319 in TX) — a working-class tenant base; expect higher turnover. Strengths: cost of living A+, crime A, housing B; Watch: health & safety C-, schools F, amenities F.
- Orange Grove ISD (rural): math 49% / reading 49% proficiency, ranked #196 of 826 in TX (top 24%) — families likely to look elsewhere, expect single-tenant / working-renter base with shorter leases.
- Market conditions: 95 active listings in the ZIP; 6 units permitted in Jim Wells County in 2024 (0 in 5+ unit buildings).
Forward outlook
- In year one you build about $1k of equity ($477 loan paydown + $925 appreciation (1.3% local appreciation)).
- Jim Wells County population projected at +10% by 2050 — modest demand growth; plan on rents tracking national, not racing it.
- At projected returns (1.3% appreciation + 3.0% rent growth), your $19k cash investment doubles in ~4 years — after that, you're playing with house money.
Negotiation context
- It's been on market 27 days — a 2% lower offer ($68k) is reasonable based on typical stale-listing flexibility.
Risks & watch-outs
- Climate carrying-cost: severe wind risk, 99% chance of damaging wind over 30y; major wildfire risk; extreme-heat days projected 7→21/yr by 2055 (HVAC capex compounding) — expect insurance premiums to compound above CPI over the hold.
Questions for the listing agent
- Have any recent inspections been done? Can we get a copy of the seller's disclosures and any deferred-maintenance estimates?
- Is there a deadline driving the sale (1031 exchange, divorce, estate, relocation)? That informs how much negotiation room exists.
- Schools are F-rated, which usually means shorter tenancies and higher turnover. Who's the typical renter profile here, and what's been the actual vacancy rate?
- What's the average days-on-market for RENTAL listings here right now (not sales)? A rising rental-DOM trend means longer vacancies and softer asking-rent achievability than the comps imply.
- What's the recent tenant-quality profile in this submarket — average credit score on applications, eviction rate, late-payment / NSF rate, and stable-employment percentage? A property-management company in the area should have these aggregated.
- How much new for-sale + rental construction is in the pipeline within 1–3 miles? Heavy new supply typically softens prices + rents 12–24 months out; constrained supply supports both.
Investment metrics
- 1% rule
- 1.43% ✓
- Cap rate
- 12.09%
- Cash-on-cash
- 20.69%
- DSCR
- 1.92
- GRM
- 5.8
CMA / ARV
No comps found within radius.
Projected returns pro-forma
1.34% appreciation · 3.0% rent growth · sell at horizon
- IRR
- 23.5%
- Equity multiple
- 2.22×
- Total profit
- $23,657
- Equity at exit
- $24,785
- IRR
- 26.0%
- Equity multiple
- 4.22×
- Total profit
- $62,305
- Equity at exit
- $33,909
Cash invested: $19,320 (down + closing). Projections, not guarantees.
Landlord ↔ Tenant lean methodology
- Overall (STATE)
- 87 Strongly Landlord-Friendly
- State Texas
- 87 Strongly Landlord-Friendly · R+5
- County
- — inherits STATE
- City
- — inherits STATE
ZIP-level market 78372
- Home prices YoY
- 1.1%
- Active inventory
- 95
- Price-to-rent
- 5.8×
Monthly cashflow live
- Estimated rent
- $989 medium interval (Pro) →
- Mortgage (P&I)
- −$362
- Tax from tax record
- −$57 /mo · $688/yr
- Insurance
- −$29
- HOA
- −$0
- Vacancy / Maint / Mgmt
- −$208
- Net cashflow
- $333
Break-even live
UW: 25.0% down · 7.5% · 30yr · 1.5% tax · 5.0% vac · 8.0% maint · 8.0% mgmt
Financing live
Cash to close
- Down payment
- $17,250
- Closing costs
- $2,070
- Reserves months
- —
- Total cash needed
- —
Loan-product check · same deal, 3 products live
Conventional
25% down · 7.5% · 30yr
- Down + closing
- —
- Monthly P&I
- —
- Monthly cashflow
- —
- DSCR
- —
- Eligible?
- —
Personal DTI + credit; lowest rate.
DSCR
20% down · 8.5% · 30yr
- Down + closing
- —
- Monthly P&I
- —
- Monthly cashflow
- —
- DSCR
- —
- Eligible?
- —
No personal income docs; deal must DSCR.
Hard money
10% down · 12.0% · 12mo
- Down + closing
- —
- Monthly P&I
- —
- Monthly cashflow
- —
- DSCR
- —
- Eligible?
- —
Short-term bridge; refi at stabilization.
Listing history 16 events
-
2026-06-18days on market $69,000 Active 27 DOM
-
2026-06-17days on market $69,000 Active 26 DOM
-
2026-06-16days on market $69,000 Active 25 DOM
-
2026-06-15days on market $69,000 Active 24 DOM
-
2026-06-15days on market $69,000 Active 23 DOM
-
2026-06-13days on market $69,000 Active 22 DOM
-
2026-06-12days on market $69,000 Active 21 DOM
-
2026-06-10days on market $69,000 Active 18 DOM
-
2026-06-08days on market $69,000 Active 17 DOM
-
2026-06-08days on market $69,000 Active 16 DOM
-
2026-06-07days on market $69,000 Active 15 DOM
-
2026-06-03days on market $69,000 Active 12 DOM
-
2026-06-02days on market $69,000 Active 11 DOM
-
2026-06-01days on market $69,000 Active 10 DOM
-
2026-05-31days on market $69,000 Active 9 DOM
-
2026-05-22$69,000 Active
ⓘ Source: listings_history table (triggers on properties + properties_extension) + one-shot
backfill from property_details.listing_events for pre-trigger history.
Tax reassessment forecast TX · Resets to sale price
- Current annual tax
- $688 · $57/mo
- Projected year-2 tax
- $1,263 · $105/mo
- Expected delta
- +$575/yr (+$48/mo · 83.5%)
ⓘ Screening estimate from a state-policy table — verify with the county assessor before closing.
Climate risk First Street
- Flood 1/10 Low FEMA zone X (unshaded) · 0% chance over 30 yrs
- Wildfire 7/10 Severe
- Heat 9/10 Extreme 7 d/yr ≥110°F today · 21 d/yr by 30 yrs out
- Wind 8/10 Severe 99% chance of damaging wind over 30 yrs
- Air quality 1/10 Low 0 unhealthy d/yr today · 0 by 30 yrs out
Nearby sold comps map
Loading sold comps map…
Walkable amenities ~0.75 mi
Loading nearby amenities…
Taxation est. · year 1
- Rental income
- $11,864
- − Mortgage interest
- −$3,865
- − Property taxes
- −$688
- − Insurance
- −$345
- − Repairs & maintenance
- −$949
- − Management
- −$949
- − Depreciation
- −$2,007
- Taxable income
- $3,060
- Est. tax owed @ 24.0%
- −$734
- After-tax cash flow
- $3,263/yr
For passive investors: Depreciation is non-cash, so a rental often shows a tax loss while cash-flowing — sheltering income. Rental losses are passive: they offset passive income freely, and up to $25,000/yr can offset ordinary (W-2) income if you actively participate and your MAGI is under $100k (phasing out to $0 by $150k); unused losses carry forward. On sale, claimed depreciation is recaptured at up to 25%, and gains may owe capital-gains tax (a 1031 exchange can defer both). Figures are a year-1 estimate at your 24.0% rate — not tax advice; consult a CPA.
Condition & rehab AI · 12 photos
This 3-bedroom home requires moderate renovations to improve its condition and increase its value. Key areas for improvement include the kitchen and bathroom, with updates to the exterior and interior paint also recommended.
Repairs flagged
- Moderate kitchen cabinets — dated and worn
- Moderate bathroom fixtures — basic and dated
- Minor exterior paint — some discoloration
Value-add opportunities
- Resale paint interior walls — enhances curb appeal and interior aesthetics
- Resale replace carpeting — improves living space and adds value
- Resale replace kitchen cabinets — modernizes kitchen and adds value
- Resale replace bathroom fixtures — modernizes bathroom and adds value
Renovation cost estimate screening
| Repair item | Severity | Est. cost |
|---|---|---|
| kitchen cabinets · dated and worn | Moderate | $3,000–15,000 |
| bathroom fixtures · basic and dated | Moderate | $3,000–15,000 |
| exterior paint · some discoloration | Minor | $500–3,000 |
| Total estimated repair cost · 3 items | $6,500–33,000 |
Value-add ROI direction
- Resale paint interior walls — enhances curb appeal and interior aesthetics ↑
- Resale replace carpeting — improves living space and adds value ↑
- Resale replace kitchen cabinets — modernizes kitchen and adds value ↑
- Resale replace bathroom fixtures — modernizes bathroom and adds value ↑
ⓘ Cost ranges are severity-bucket heuristics (US national rule-of-thumb). Get contractor quotes + a written scope before underwriting a rehab budget.
Schools (NCES district)
- District
- Orange Grove ISD
- NCES district ID
- 4833720
- Math proficiency
- 49% ▼ -6.00%
- Reading proficiency
- 49% ▲ 4.00%
- Median HH income
- $49,348
- Composite
- 41.9/100
- National rank
- #3367
- State rank
- #196 of 826 in TX
Livability — South La Paloma
- Score
- 56/100
- State rank
- #1319
- US rank
- #22732
Category grades
Schools grade is shown separately in the Schools card above.
Census & demographics
- Census place
- South La Paloma, TX
- Population (ZIP)
- 5,066
Population outlook (Jim Wells County) Hauer SSP2
- Today (2025)
- 43,325 people
- By 2030
- 44,156 · +1.9%
- By 2040
- 45,790 · +5.7%
- By 2050
- 47,455 · +9.5%
- By 2075
- 51,800 · +19.6%
- By 2100
- 52,006 · +20.0%
Race, ethnicity, and origin ACS 2023
- Neighborhood character
- Majority Hispanic (56%)
- Race & ethnicity
- Hispanic / Latino 56% White 41% Two or more races 14%
- Hispanic origin (detail)
- Mexican 54%
- Common ancestry
- Arab 2% Italian 1% Romanian 1%
- Foreign-born
- 7% · Canada
- Languages at home
- 60% English-only · Spanish 36% Arabic 4%
Political lean MEDSL · Jim Wells
- 2024 margin
- R (+15.5) · D 42.0% · R 57.5%
- 2008→2024 swing
- -31.6pp toward R · 2008: 16.1pp · 2024: -15.5pp
- All cycles
- 2024: R+15.5 2020: R+9.8 2016: D+10.3 2012: D+17.0 2008: D+16.1
Not yet ingested
- Civics
- —
Market trends
- HPI YoY
- ▲ 1.34%
- Current HPI
- 126.8482
- Rent YoY
- —
- Metro
- —
- State GDP YoY
- ▲ 3.95%
- F500 in state
- 110
Industry mix (Fortune 500 HQ in TX)
| Industry | F500 HQs | Revenue |
|---|---|---|
| Energy | 16 | $1,198B |
|
||
| Technology | 5 | $198B |
|
||
| Engineering / Construction | 4 | $72B |
|
||
| Energy Services | 3 | $60B |
|
||
| Utilities | 3 | $41B |
|
||
| Healthcare | 2 | $330B |
|
||
Price history
1 event — show timeline
- 2026-05-22 Listed $69,000 CBMLS
Property tax history
+15.1%/yrLatest (2025): $688 · +15.1% YoY. Source: county tax records.
Cash-flow waterfall
monthlySold comps — $/sqft
last 12 mo · ≤1 miLoading sold comps…