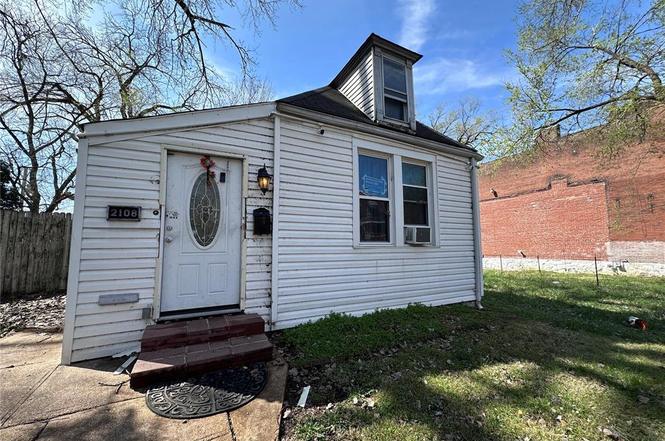
2108 Chippewa St · St. Louis, MO
Flood risk 1/10 · Minimal
- FEMA flood zone
- X (unshaded)
- Chance of flooding over 30 yrs
- 0.0%
- Est. flood insurance / yr
- $473 – $860
Fire risk 1/10 · Minimal
- Est. fire insurance / yr
- $1,054 – $1,958
Heat risk 5/10 · Moderate
- Hot days now (above 109°F)
- 7 days/yr
- Hot days in 30 yrs
- 21 days/yr
Wind risk 2/10 · Minimal
- Chance of severe wind over 30 yrs
- 1.0%
Air-quality risk 3/10 · Minor
- Unhealthy air days now
- 3 days/yr
- Unhealthy air days in 30 yrs
- 4 days/yr
Risk factors via First Street. Map © Google.
Why this score? — see what drove the B grade
The composite is a weighted blend of 9 inputs, each scored 0–100. Each bar is that input's sub-score; the figure is the points it added to the 100-point composite (weight × sub-score).
- Cash flow +30.0/30.0
- ARV discount +15.0/15.0
- 1% rule +10.0/10.0
- DSCR +10.0/10.0
- Rent growth +3.7/5.0
- Livability +2.5/5.0
- Condition / age +2.5/5.0
- Schools +1.2/10.0
- Appreciation +0.0/10.0
$35,000
🖨 Deal sheet (PDF) 📄 Offer letter ✓ Due diligence
Listing remarks
Short sale approved with US Bank. Story and a half home with 3 bedrooms and 1 full bath. The home has a foyer, big living room, kitchen and 1 bedroom on the main level. Upstairs has 2 bedrooms and an unfinished attic space. The kitchen has laundry hook ups in it and can hold a small dining set. Home is equipped for central air and uses window units for cooling. Seller notes that the electric panel, sewer line and a portion of the roof need repairing. There is a portion of the roof that is 2 years old. Home is ready for its next owner to make it their own. Seller is requesting a Special Sales Contract and not to participate in any buyer inspections or St. Louis City Occupancy. Approved short
Key facts
- 6,251 sq ft lot
- Garage
- Built 1887
Neighborhood map
What this means for you Summary
Snapshot
- This is a 3-bed/1.0-bath single-family listed at $35k.
Deal economics
- At list price, monthly cash flow is $674 ($8k/yr) — positive.
- The deal already cash-flows at list — no discount required.
- Meets the 1% rule at list price ($1k rent vs $35k).
- Recommended offer: $32k (9.0% below list) — sets the bar for market timing.
- Cap rate 29.4% vs local median 5.0% in St. Louis — top-decile yield for the area; either an underpriced asset or a hidden risk that comps aren't pricing in. Stress-test before assuming the spread holds.
Location & tenants
- Location reads: area grade B — affects rentability + tenant quality, not the cash-flow math above.
- St. Louis City (urban): math 10% / reading 18% proficiency, ranked #312 of 324 in MO (top 96%) — low school quality limits family demand, transient renter base, plan for 1-2y turnover; 80% free/reduced lunch — lower-income household profile, screen leases tightly.
- Zoned schools: Monroe Elem. (math 2% / reading 2%, grade F, #1,099 of 1,115 statewide, top 100%, 158 students, 98% FRL); Roosevelt High (math 2% / reading 8%, grade F, #517 of 521 statewide, top 100%, 460 students, 99% FRL) — zoned schools average 99% FRL vs 80% district-wide (18 pts higher); higher-poverty schools than district average — tighter screening recommended.
- Market conditions: Rents rising fast (+4.9%/yr); 243 active listings in the ZIP; 40 comparable units currently listed for rent nearby; rentals at typical pace (median 25d on market — plan ~3-4 weeks tenant-placement turnaround); 42% of comp listings sitting > 30 days — soft ceiling on asking rent; 294 units permitted in St. Louis city in 2024 (227 in 5+ unit buildings).
Forward outlook
- Local home prices are declining (-3.0%/yr); year-one equity from $242 of loan paydown is wiped out by about $1k of value loss. Plan a longer hold.
- St. Louis County population projected to shrink 6% by 2050 — rents likely to lag national; underwrite the cash flow, not the appreciation.
- At projected returns (-3.0% appreciation + 4.9% rent growth), your $10k cash investment doubles in ~2 years — after that, you're playing with house money.
Negotiation context
- It's been on market 104 days — a 9% lower offer ($32k) is reasonable based on typical stale-listing flexibility.
- 3 sale attempts; this cycle's ask has dropped $25k (42%) from the opening price — seller is motivated, your offer sets the floor, not the list.
Risks & watch-outs
- Watch-outs: built in 1887 — expect roof / HVAC / electrical / plumbing capex.
- Climate carrying-cost: extreme-heat days projected 7→21/yr by 2055 (HVAC capex compounding) — expect insurance premiums to compound above CPI over the hold.
Questions for the listing agent
- It's been on market 104 days. Have you received any prior offers? Is the seller open to a 9% concession, seller financing, or rate buy-down credit?
- Built in 1887 — when were the roof, HVAC, electrical panel, plumbing, and water heater last replaced?
- Why hasn't it sold? Are there any deal-killer items the seller is aware of (foundation, flood, title, zoning, code violations)?
- Is there a deadline driving the sale (1031 exchange, divorce, estate, relocation)? That informs how much negotiation room exists.
- What's the average days-on-market for RENTAL listings here right now (not sales)? A rising rental-DOM trend means longer vacancies and softer asking-rent achievability than the comps imply.
- What's the recent tenant-quality profile in this submarket — average credit score on applications, eviction rate, late-payment / NSF rate, and stable-employment percentage? A property-management company in the area should have these aggregated.
- How much new for-sale + rental construction is in the pipeline within 1–3 miles? Heavy new supply typically softens prices + rents 12–24 months out; constrained supply supports both.
Investment metrics
- 1% rule
- 3.32% ✓
- Cap rate
- 29.41%
- Cash-on-cash
- 82.55%
- DSCR
- 4.67
- GRM
- 2.5
CMA / ARV
- ARV (on-the-fly)
- $66,999
- Comps found
- 12
Show comp detail 12 sales within ~0.75 mi
| Address | Dist | Beds/Ba | Sqft | Sold | Price | $/sf | Match |
|---|---|---|---|---|---|---|---|
| 2806 Keokuk St | 0.45mi | 3/1.0 | 963 (-1%) | 6mo | $144,900 | $150 | 72 |
| 3315 Texas Ave | 0.65mi | 2/1.0 (-1) | 950 (-2%) | 7mo | $139,900 | $147 | 55 |
| 3931 Pennsylvania Ave | 0.64mi | 4/1.0 (+1) | 1,009 (+4%) | 8mo | $69,900 | $69 | 52 |
| 3819 California Ave | 0.43mi | 2/1.0 (-1) | 864 (-11%) | 8mo | $55,000 | $64 | 50 |
| 2719 Keokuk St | 0.35mi | 2/1.5 (-1) | 836 (-14%) | 5mo | $55,000 | $66 | 49 |
| 4106 Nebraska Ave | 0.65mi | 3/1.0 | 1,080 (+11%) | 4mo | $40,000 | $37 | 48 |
| 4110 Oregon Ave | 0.61mi | 2/1.5 (-1) | 1,088 (+12%) | 1mo | $39,000 | $36 | 44 |
| 3426 Nebraska Ave | 0.69mi | 3/1.5 | 1,100 (+13%) | 1mo | $159,900 | $145 | 43 |
| 4031 Pennsylvania Ave | 0.68mi | 3/1.0 | 850 (-12%) | 10mo | $20,000 | $24 | 39 |
| 3607 Oregon Ave | 0.55mi | 2/2.0 (-1) | 838 (-14%) | 7mo | $89,990 | $107 | 37 |
| 2125 Utah St | 0.65mi | 2/2.0 (-1) | 845 (-13%) | 8mo | $179,900 | $213 | 33 |
| 3841 Michigan Ave | 0.75mi | 2/1.0 (-1) | 1,098 (+13%) | 8mo | $42,000 | $38 | 32 |
Match score weights: distance 35% · size 25% · config 20% · recency 20%. Top-matched comps best support the ARV.
Projected returns pro-forma
-3.0% appreciation · 4.89% rent growth · sell at horizon
- IRR
- 85.0%
- Equity multiple
- 5.03×
- Total profit
- $39,540
- Equity at exit
- $5,219
- IRR
- 88.6%
- Equity multiple
- 11.14×
- Total profit
- $99,413
- Equity at exit
- $3,026
Cash invested: $9,800 (down + closing). Projections, not guarantees.
Landlord ↔ Tenant lean methodology
- Overall (STATE)
- 81 Strongly Landlord-Friendly
- State Missouri
- 81 Strongly Landlord-Friendly · R+10
- County
- — inherits STATE
- City
- — inherits STATE
ZIP-level market 63118
- Rents YoY
- 4.9%
- Active inventory
- 243
- Price-to-rent
- 2.5×
Monthly cashflow live
- Estimated rent
- $1,163 high interval (Pro) →
- Mortgage (P&I)
- −$184
- Tax from tax record
- −$47 /mo · $561/yr
- Insurance
- −$15
- HOA
- −$0
- Vacancy / Maint / Mgmt
- −$244
- Net cashflow
- $674
Break-even live
Sensitivity live
| Price | -10% $694 | -5% $684 | +0% $674 | +5% $664 | +10% $654 |
|---|---|---|---|---|---|
| Rent | -10% $582 | -5% $628 | +0% $674 | +5% $720 | +10% $766 |
| Rate | -1.0pp $692 | -0.5pp $683 | base $674 | +0.5pp $665 | +1.0pp $656 |
UW: 25.0% down · 7.5% · 30yr · 1.5% tax · 5.0% vac · 8.0% maint · 8.0% mgmt
Financing live
Cash to close
- Down payment
- $8,750
- Closing costs
- $1,050
- Reserves months
- —
- Total cash needed
- —
Loan-product check · same deal, 3 products live
Conventional
25% down · 7.5% · 30yr
- Down + closing
- —
- Monthly P&I
- —
- Monthly cashflow
- —
- DSCR
- —
- Eligible?
- —
Personal DTI + credit; lowest rate.
DSCR
20% down · 8.5% · 30yr
- Down + closing
- —
- Monthly P&I
- —
- Monthly cashflow
- —
- DSCR
- —
- Eligible?
- —
No personal income docs; deal must DSCR.
Hard money
10% down · 12.0% · 12mo
- Down + closing
- —
- Monthly P&I
- —
- Monthly cashflow
- —
- DSCR
- —
- Eligible?
- —
Short-term bridge; refi at stabilization.
Rent comps 40 comps
| Address | Beds | Baths | Sqft | Rent | $/sqft | DOM | Units | Dist |
|---|---|---|---|---|---|---|---|---|
| 3743 Wisconsin Ave Unit 37433RDF St. Louis, MO | 2.0 | 1.5 | 750 | $895 | $1.19 | 45d | 1 | 0.08mi |
| 3700 S Broadway St Unit 2N St. Louis, MO | 2.0 | 1.0 | 975 | $925 | $0.95 | 25d | 1 | 0.11mi |
| 2641 Keokuk St Unit 1R St. Louis, MO | 3.0 | 1.0 | 800 | $1,295 | $1.62 | 45d | 1 | 0.29mi |
| 3739 Ohio Ave Unit A St. Louis, MO | 2.0 | 1.0 | 900 | $1,000 | $1.11 | 5d | 1 | 0.30mi |
| 2649 Keokuk St Unit 1L St. Louis, MO | 2.0 | 1.0 | 800 | $1,195 | $1.49 | 45d | 1 | 0.30mi |
| 3450 Wisconsin Ave Saint Louis, MO | 1.0–3.0 | 1.0–2.0 | 1219 | $2,300 | $1.89 | 0d | 15 | 0.42mi |
| 3530 Oregon Ave Unit 3532 St. Louis, MO | 2.0 | 1.0 | 1035 | $825 | $0.80 | 45d | 1 | 0.54mi |
| 3534 Nebraska Ave Saint Louis, MO | 2.0 | 1.0 | 1100 | $1,100 | $1.00 | 45d | 1 | 0.59mi |
| 3839 Pennsylvania Ave Saint Louis, MO | 2.0 | 1.0 | 725 | $1,000 | $1.38 | 21d | 1 | 0.61mi |
| 4127 Oregon Ave Unit 2F St. Louis, MO | 2.0 | 1.0 | 1000 | $1,203 | $1.20 | 25d | 1 | 0.66mi |
| 3434 Nebraska Ave Saint Louis, MO | 2.0 | 1.0 | 747 | $1,100 | $1.47 | 45d | 1 | 0.66mi |
| 3922 Minnesota Ave Saint Louis, MO | 2.0 | 1.0 | 1000 | $925 | $0.93 | 45d | 1 | 0.67mi |
| 3855 Minnesota Ave Unit B St. Louis, MO | 2.0 | 1.0 | 900 | $850 | $0.94 | 45d | 1 | 0.68mi |
| 3106 Keokuk St Saint Louis, MO | 2.0 | 1.0 | 850 | $850 | $1.00 | 17d | 1 | 0.70mi |
| 3116 Keokuk St Saint Louis, MO | 2.0 | 1.0 | 900 | $850 | $0.94 | 4d | 1 | 0.71mi |
| 3116 Keokuk St Unit 1F St. Louis, MO | 2.0 | 1.0 | 900 | $850 | $0.94 | 3d | 1 | 0.71mi |
| 4238 California Ave St. Louis, MO | 2.0 | 1.0 | 1000 | $1,300 | $1.30 | 45d | 1 | 0.72mi |
| 3829 S Compton Ave Unit B St. Louis, MO | 2.0 | 1.0 | 1040 | $1,050 | $1.01 | 25d | 1 | 0.80mi |
| 3829 S Compton Ave Unit A St. Louis, MO | 2.0 | 1.0 | 1040 | $1,000 | $0.96 | 17d | 1 | 0.80mi |
| 3506 S Compton Ave Saint Louis, MO | 2.0 | 2.0 | 1100 | $1,300 | $1.18 | 12d | 1 | 0.84mi |
| 4308 Nebraska Ave Unit B St. Louis, MO | 2.0 | 2.0 | 1012 | $1,148 | $1.13 | 9d | 1 | 0.85mi |
| 3614 Virginia Ave Saint Louis, MO | 2.0 | 1.0 | 980 | $1,200 | $1.22 | 45d | 1 | 0.86mi |
| 3220 Nebraska Ave Unit 1f St. Louis, MO | 2.0 | 1.0 | 850 | $1,100 | $1.29 | 45d | 1 | 0.86mi |
| 3220 Nebraska Ave Unit 1f St. Louis, MO | 2.0 | 1.0 | 850 | $1,100 | $1.29 | 0d | 1 | 0.86mi |
| 3220 Nebraska Ave Unit 1f St. Louis, MO | 2.0 | 1.0 | 850 | $1,100 | $1.29 | 25d | 1 | 0.86mi |
| 2846 Wyoming St Unit 2F St. Louis, MO | 2.0 | 1.0 | 840 | $900 | $1.07 | 45d | 1 | 0.88mi |
| 2848 Wyoming St Unit 2850 St. Louis, MO | 2.0 | 1.0 | 800 | $895 | $1.12 | 25d | 1 | 0.88mi |
| 3428 Dunnica Ave Saint Louis, MO | 2.0 | 1.0 | 1050 | $995 | $0.95 | 45d | 1 | 0.97mi |
| 3238 S Compton Ave St. Louis, MO | 2.0 | 1.0 | 875 | $1,150 | $1.31 | 45d | 1 | 1.01mi |
| 3221 Gravois Ave Unit B St. Louis, MO | 2.0 | 1.0 | 950 | $1,000 | $1.05 | 25d | 1 | 1.08mi |
| 3514 Alberta St Unit 1W St. Louis, MO | 2.0 | 1.0 | 800 | $800 | $1.00 | 45d | 1 | 1.09mi |
| 4528 Nebraska Ave Unit 305 St. Louis, MO | 2.0 | 2.0 | 950 | $1,345 | $1.42 | 25d | 1 | 1.09mi |
| 3310 Wyoming St Unit 2E St. Louis, MO | 2.0 | 1.0 | 900 | $995 | $1.11 | 13d | 1 | 1.13mi |
| 3432 Utah St Unit 3434 St. Louis, MO | 2.0 | 1.0 | 1000 | $1,150 | $1.15 | 45d | 1 | 1.14mi |
| 3434 Utah St St. Louis, MO | 2.0 | 1.0 | 1000 | $1,150 | $1.15 | 45d | 1 | 1.15mi |
| 3009 Pennsylvania Ave Saint Louis, MO | 1.0–2.0 | 1.0–2.0 | 928 | $1,195 | $1.29 | 21d | 6 | 1.19mi |
| 2924 Pennsylvania Ave Saint Louis, MO | 2.0 | 1.0 | 1020 | $1,150 | $1.13 | 9d | 1 | 1.20mi |
| 3521 Utah St Unit 3525 St. Louis, MO | 2.0 | 1.0 | 1100 | $1,445 | $1.31 | 5d | 1 | 1.25mi |
| 3702 Meramec St Unit 1e St. Louis, MO | 2.0 | 1.0 | 725 | $950 | $1.31 | 0d | 1 | 1.25mi |
| 3702 Meramec St Unit 1e St. Louis, MO | 2.0 | 1.0 | 725 | $950 | $1.31 | 9d | 1 | 1.25mi |
Listing history 8 events
-
2025-07-23status Pending
-
2025-07-14price $35,000
-
2025-07-02status Active
-
2025-06-20price $40,000
-
2025-06-09status Active
-
2025-04-24price $57,475
-
2025-03-30$60,000 Active
-
2001-08-07soldstatus $54,000
ⓘ Source: listings_history table (triggers on properties + properties_extension) + one-shot
backfill from property_details.listing_events for pre-trigger history.
Tax reassessment forecast MO · Resets to sale price
- Current annual tax
- $561 · $47/mo
- Projected year-2 tax
- $561 · $47/mo
- Expected delta
- $0/yr ($0/mo · 0.0%)
ⓘ Screening estimate from a state-policy table — verify with the county assessor before closing.
Climate risk First Street
- Flood 1/10 Low FEMA zone X (unshaded) · 0% chance over 30 yrs
- Wildfire 1/10 Low
- Heat 5/10 Major 7 d/yr ≥109°F today · 21 d/yr by 30 yrs out
- Wind 2/10 Low 100% chance of damaging wind over 30 yrs
- Air quality 3/10 Moderate 3 unhealthy d/yr today · 4 by 30 yrs out
Nearby sold comps map
Loading sold comps map…
Walkable amenities ~0.75 mi
Loading nearby amenities…
Taxation est. · year 1
- Rental income
- $13,961
- − Mortgage interest
- −$1,961
- − Property taxes
- −$561
- − Insurance
- −$175
- − Repairs & maintenance
- −$1,117
- − Management
- −$1,117
- − Depreciation
- −$1,018
- Taxable income
- $8,012
- Est. tax owed @ 24.0%
- −$1,923
- After-tax cash flow
- $6,167/yr
For passive investors: Depreciation is non-cash, so a rental often shows a tax loss while cash-flowing — sheltering income. Rental losses are passive: they offset passive income freely, and up to $25,000/yr can offset ordinary (W-2) income if you actively participate and your MAGI is under $100k (phasing out to $0 by $150k); unused losses carry forward. On sale, claimed depreciation is recaptured at up to 25%, and gains may owe capital-gains tax (a 1031 exchange can defer both). Figures are a year-1 estimate at your 24.0% rate — not tax advice; consult a CPA.
Schools (NCES district)
- District
- St. Louis City
- NCES district ID
- 2929280
- Math proficiency
- 10% ▼ -6.00%
- Reading proficiency
- 18% ▼ -3.00%
- Median HH income
- $35,685
- Composite
- 11.54/100
- National rank
- #9699
- State rank
- #312 of 324 in MO
Livability — St. Louis
No livability data for this city. (Only ~50 U.S. cities are tracked.)
Census & demographics
- Census place
- St. Louis, MO
- County
- Saint Louis City · 254,015 people
- City population
- 283,259
- Metro
- St. Louis, MO-IL
- Population (ZIP)
- 25,913
- Household income
- $57,762
- Rent vs Own
- Severe rent burden
- 1495.0
Population outlook (St. Louis County) Hauer SSP2
- Today (2025)
- 315,737 people
- By 2030
- 313,865 · -0.6%
- By 2040
- 305,439 · -3.3%
- By 2050
- 296,529 · -6.1%
- By 2075
- 271,028 · -14.2%
- By 2100
- 255,359 · -19.1%
Race, ethnicity, and origin ACS 2023
- Neighborhood character
- Diverse neighborhood (Simpson 0.63)
- Race & ethnicity
- White 44% Black 41% Two or more races 8% Hispanic / Latino 8% Asian 2%
- Hispanic origin (detail)
- Mexican 6%
- Common ancestry
- Slovak 2% Lithuanian 2% Romanian 2%
- Foreign-born
- 6% · Canada, Vietnam
- Languages at home
- 90% English-only · Spanish 5% Vietnamese 1% French/Haitian/Cajun 1%
Political lean MEDSL · St. Louis
- 2024 margin
- Solid D (+64.7) · D 81.4% · R 16.7% · Other 2.0%
- 2008→2024 swing
- -3.5pp toward R · 2008: 68.2pp · 2024: 64.7pp
- All cycles
- 2024: D+64.7 2020: D+66.2 2016: D+63.7 2012: D+66.6 2008: D+68.2
Not yet ingested
- Civics
- —
Market trends
- HPI YoY
- ▼ -347.51%
- Current HPI
- 171.5963
- Rent YoY
- ▲ 4.89%
- Metro
- St. Louis, MO-IL
- State GDP YoY
- ▲ 1.84%
- F500 in state
- 20
Industry mix (Fortune 500 HQ in MO)
| Industry | F500 HQs | Revenue |
|---|---|---|
| Healthcare | 1 | $163B |
|
||
| Insurance | 1 | $21B |
|
||
| Industrial Technology | 1 | $17B |
|
||
| Retail | 1 | $16B |
|
||
| Industrial Distribution | 1 | $10B |
|
||
| Utilities | 1 | $9B |
|
||
Price history
-35.2% since first listed8 events — show timeline
- 2025-07-23 Pending — MARIS as Distributed by MLS Grid
- 2025-07-14 Price Changed $35,000 MARIS as Distributed by MLS Grid
- 2025-07-02 Relisted — MARIS as Distributed by MLS Grid
- 2025-06-20 Price Changed $40,000 MARIS as Distributed by MLS Grid
- 2025-06-09 Relisted — MARIS as Distributed by MLS Grid
- 2025-04-24 Price Changed $57,475 MARIS as Distributed by MLS Grid
- 2025-03-30 Listed $60,000 MARIS as Distributed by MLS Grid
- 2001-08-07 Sold (Public Records) $54,000 Public Records
Property tax history
+2.2%/yrLatest (2024): $561 · +4.5% YoY. Source: county tax records.
Cash-flow waterfall
monthlySold comps — $/sqft
last 12 mo · ≤1 miLoading sold comps…