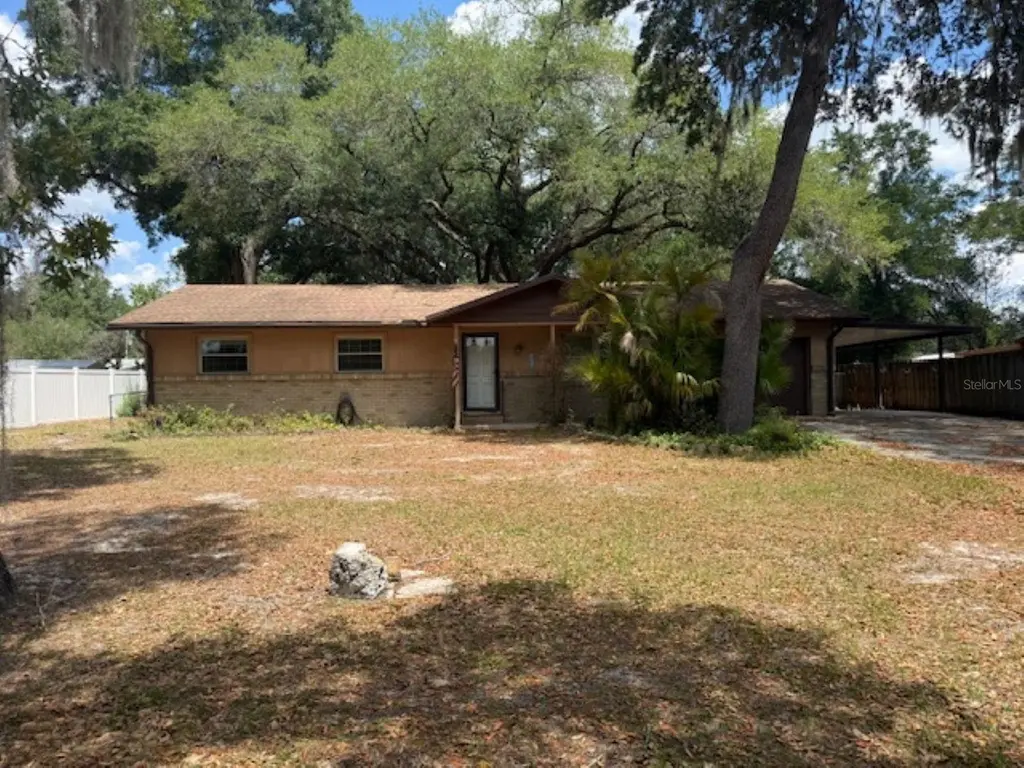
2161 NE 38th St · Ocala, FL
Flood risk 1/10 · Minimal
- FEMA flood zone
- X (unshaded)
- Chance of flooding over 30 yrs
- 0.0%
- Est. flood insurance / yr
- $507 – $1,088
Fire risk 4/10 · Minor
- Est. fire insurance / yr
- $947 – $1,759
Heat risk 8/10 · Major
- Hot days now (above 108°F)
- 7 days/yr
- Hot days in 30 yrs
- 21 days/yr
Wind risk 9/10 · Severe
- Chance of severe wind over 30 yrs
- 99.0%
Air-quality risk 4/10 · Minor
- Unhealthy air days now
- 5 days/yr
- Unhealthy air days in 30 yrs
- 5 days/yr
Risk factors via First Street. Map © Google.
Why this score? — see what drove the B- grade
The composite is a weighted blend of 9 inputs, each scored 0–100. Each bar is that input's sub-score; the figure is the points it added to the 100-point composite (weight × sub-score).
- Cash flow +26.0/30.0
- ARV discount +15.0/15.0
- DSCR +8.8/10.0
- 1% rule +6.9/10.0
- Schools +3.6/10.0
- Livability +3.5/5.0
- Rent growth +2.5/5.0
- Condition / age +2.2/5.0
- Appreciation +0.0/10.0
$152,000
🖨 Deal sheet (PDF) 📄 Offer letter ✓ Due diligence
Listing remarks
This spacious 3Bd/2Ba charmer can be your dream come true for owning an affordable home. It offers a gorgeous wood burning fireplace in the living room area and upgraded kitchen and baths. Experience the serenity of nature with several beautiful trees on over a third of an acre! This one has it all. It needs some TLC but is priced right. Hurry, this will go fast!
Key facts
- Upgraded kitchen
- 0.34 acre lot
- Garage
Tags
Property features AI
Finance
- Other: Residential zoning (R1); Property type: Single Family Residence
- Financial info: Lease restrictions apply
- HOA & community: No association
Exterior
- Parking: Attached garage (1 car); Carport (1 car)
- Utilities: Public water; Public sewer; Electricity connected
- Home design: Single-family residence; One story; South-facing entry
- Construction: Block construction; Shingle roof; Slab foundation; Built on approximately 0.34-acre lot
- Exterior features: Other exterior features; Asphalt road access; Lot dimensions approximately 90 x 166
Interior
- Kitchen: Dishwasher
- Bedrooms: 3 bedrooms
- Flooring: Carpet; Ceramic tile
- Bathrooms: 2 full bathrooms
- Heating & cooling: Central heating; Central air conditioning; Wood-burning fireplace
- Interior features: Ceiling fans
- Laundry & utility: Laundry room (Other)
Neighborhood map
What this means for you Summary
Snapshot
- This is a 3-bed/2.0-bath single-family listed at $152k. Condition is rated fair.
Deal economics
- At list price, monthly cash flow is $379 ($5k/yr) — positive.
- The deal already cash-flows at list — no discount required.
- Meets the 1% rule at list price ($2k rent vs $152k).
- Cap rate 9.3% vs local median 4.2% in Ocala — top-decile yield for the area; either an underpriced asset or a hidden risk that comps aren't pricing in. Stress-test before assuming the spread holds.
Location & tenants
- Location reads 69/100 on livability (#476 in FL) — a middle-class / working-renter tenant base. Strengths: cost of living A+, housing A+, health & safety A+; Watch: crime F, amenities F, commute F.
- Marion (rural): math 42% / reading 43% proficiency, ranked #61 of 73 in FL (top 84%) — families likely to look elsewhere, expect single-tenant / working-renter base with shorter leases; 61% free/reduced lunch — lower-income household profile, screen leases tightly.
- Market conditions: 173 active listings in the ZIP; 8 comparable units currently listed for rent nearby; rentals at typical pace (median 15d on market — plan ~3-4 weeks tenant-placement turnaround); 7,071 units permitted in Marion County in 2024 (534 in 5+ unit buildings).
- This rent runs 40% of the median local income ($54k/yr) — at the standard rent-burdened threshold; future hikes will face affordability resistance.
Forward outlook
- Local home prices are declining (-3.0%/yr); year-one equity from $1k of loan paydown is wiped out by about $5k of value loss. Plan a longer hold.
- Marion County population projected at +13% by 2050 — modest demand growth; plan on rents tracking national, not racing it.
Negotiation context
- Only 8 days on market — expect competitive offers; lowballing is unlikely to land.
Risks & watch-outs
- Climate carrying-cost: severe wind risk, 99% chance of damaging wind over 30y; extreme-heat days projected 7→21/yr by 2055 (HVAC capex compounding) — expect insurance premiums to compound above CPI over the hold.
Questions for the listing agent
- Have any recent inspections been done? Can we get a copy of the seller's disclosures and any deferred-maintenance estimates?
- Is there a deadline driving the sale (1031 exchange, divorce, estate, relocation)? That informs how much negotiation room exists.
- Crime grade is F in this area — have there been break-ins, vandalism, or insurance claims at this property in the last 3 years? What carrier currently insures it and at what premium?
- What's the average days-on-market for RENTAL listings here right now (not sales)? A rising rental-DOM trend means longer vacancies and softer asking-rent achievability than the comps imply.
- What's the recent tenant-quality profile in this submarket — average credit score on applications, eviction rate, late-payment / NSF rate, and stable-employment percentage? A property-management company in the area should have these aggregated.
- How much new for-sale + rental construction is in the pipeline within 1–3 miles? Heavy new supply typically softens prices + rents 12–24 months out; constrained supply supports both.
Investment metrics
- 1% rule
- 1.19% ✓
- Cap rate
- 9.28%
- Cash-on-cash
- 10.68%
- DSCR
- 1.48
- GRM
- 7.0
CMA / ARV
- ARV (median comp)
- $227,010
- List price
- $152,000
- Delta
- -33.04%
- Verdict
- UNDERPRICED
- Comps
- 20 within 1.0 mi
Show comp detail 12 sales within ~0.75 mi
| Address | Dist | Beds/Ba | Sqft | Sold | Price | $/sf | Match |
|---|---|---|---|---|---|---|---|
| 3881 NE 22nd Ct | 0.14mi | 3/2.0 | 1,408 (-0%) | 4mo | $265,000 | $188 | 90 |
| 3601 NE 24th Ct | 0.35mi | 3/2.0 | 1,308 (-7%) | 12mo | $199,900 | $153 | 61 |
| 3052 NE 21st Court Rd | 0.60mi | 3/2.0 | 1,504 (+6%) | 2mo | $254,490 | $169 | 60 |
| 1841 NE 38th St | 0.22mi | 3/2.0 | 1,603 (+14%) | 10mo | $275,200 | $172 | 58 |
| 2310 NE 43rd St | 0.38mi | 3/2.0 | 1,482 (+5%) | 20mo | $240,000 | $162 | 58 |
| 3993 NE 19th Ave | 0.21mi | 4/2.0 (+1) | 1,600 (+13%) | 7mo | $250,000 | $156 | 57 |
| 3601 NE 18th Ter | 0.25mi | 3/2.0 | 1,288 (-9%) | 21mo | $200,000 | $155 | 56 |
| 2048 NE 45th St | 0.46mi | 3/2.0 | 1,370 (-3%) | 21mo | $234,000 | $171 | 56 |
| 4056 NE 20th Ave | 0.21mi | 3/2.0 | 1,243 (-12%) | 19mo | $250,000 | $201 | 55 |
| 4480 NE 25th Ave | 0.58mi | 4/2.0 (+1) | 1,377 (-2%) | 15mo | $236,999 | $172 | 52 |
| 2220 NE 41st St | 0.22mi | 3/2.0 | 1,204 (-15%) | 17mo | $131,000 | $109 | 51 |
| 2864 NE 21st Court Rd | 0.72mi | 3/2.0 | 1,504 (+6%) | 11mo | $272,990 | $182 | 46 |
Match score weights: distance 35% · size 25% · config 20% · recency 20%. Top-matched comps best support the ARV.
Projected returns pro-forma
-3.0% appreciation · 3.0% rent growth · sell at horizon
- IRR
- -0.3%
- Equity multiple
- 0.99×
- Total profit
- $-474
- Equity at exit
- $22,664
- IRR
- 9.4%
- Equity multiple
- 1.72×
- Total profit
- $30,768
- Equity at exit
- $13,142
Cash invested: $42,560 (down + closing). Projections, not guarantees.
Landlord ↔ Tenant lean methodology
- Overall (STATE)
- 87 Strongly Landlord-Friendly
- State Florida
- 87 Strongly Landlord-Friendly · R+3
- County
- — inherits STATE
- City
- — inherits STATE
ZIP-level market 34479
- Home prices YoY
- -31.0%
- Active inventory
- 173
- Price-to-rent
- 7.0×
Monthly cashflow live
- Estimated rent
- $1,809 high interval (Pro) →
- Mortgage (P&I)
- −$797
- Tax est. 1.5%
- −$190 /mo · $2,280/yr
- Insurance
- −$63
- HOA
- −$0
- Vacancy / Maint / Mgmt
- −$380
- Net cashflow
- $379
Break-even live
Sensitivity live
| Price | -10% $484 | -5% $431 | +0% $379 | +5% $326 | +10% $274 |
|---|---|---|---|---|---|
| Rent | -10% $236 | -5% $307 | +0% $379 | +5% $450 | +10% $522 |
| Rate | -1.0pp $455 | -0.5pp $418 | base $379 | +0.5pp $339 | +1.0pp $299 |
UW: 25.0% down · 7.5% · 30yr · 1.5% tax · 5.0% vac · 8.0% maint · 8.0% mgmt
Financing live
Cash to close
- Down payment
- $38,000
- Closing costs
- $4,560
- Reserves months
- —
- Total cash needed
- —
Loan-product check · same deal, 3 products live
Conventional
25% down · 7.5% · 30yr
- Down + closing
- —
- Monthly P&I
- —
- Monthly cashflow
- —
- DSCR
- —
- Eligible?
- —
Personal DTI + credit; lowest rate.
DSCR
20% down · 8.5% · 30yr
- Down + closing
- —
- Monthly P&I
- —
- Monthly cashflow
- —
- DSCR
- —
- Eligible?
- —
No personal income docs; deal must DSCR.
Hard money
10% down · 12.0% · 12mo
- Down + closing
- —
- Monthly P&I
- —
- Monthly cashflow
- —
- DSCR
- —
- Eligible?
- —
Short-term bridge; refi at stabilization.
Rent comps 8 comps
| Address | Beds | Baths | Sqft | Rent | $/sqft | DOM | Units | Dist |
|---|---|---|---|---|---|---|---|---|
| 3219 NE 16th Ct Unit 3219 Ocala, FL | 3.0 | 2.0 | 1200 | $1,700 | $1.42 | 14d | 1 | 0.67mi |
| 2855 NE 20th Ter Ocala, FL | 3.0 | 2.0 | 1504 | $1,875 | $1.25 | 14d | 1 | 0.77mi |
| 2122 NE 28th Pl Ocala, FL | 3.0 | 2.0 | 1328 | $2,100 | $1.58 | 14d | 1 | 0.78mi |
| 3656 NE 30th Ter Ocala, FL | 4.0 | 2.5 | 1853 | $2,150 | $1.16 | 14d | 1 | 0.87mi |
| 2190 NE 54th St Ocala, FL | 3.0 | 2.0 | 1620 | $1,450 | $0.90 | 14d | 1 | 1.05mi |
| 3380 NE 44th Pl Ocala, FL | 3.0 | 2.0 | 1392 | $1,650 | $1.19 | 22d | 1 | 1.19mi |
| 1405 NE 55th St Ocala, FL | 2.0 | 1.0 | 1032 | $1,400 | $1.36 | 22d | 1 | 1.35mi |
| 2205 NE 14th Ave Ocala, FL | 3.0 | 1.0 | 1020 | $1,345 | $1.32 | 22d | 1 | 1.42mi |
Listing history 1 events
-
2026-05-12$152,000 Active 366-char remark
ⓘ Source: listings_history table (triggers on properties + properties_extension) + one-shot
backfill from property_details.listing_events for pre-trigger history.
Climate risk First Street
- Flood 1/10 Low FEMA zone X (unshaded) · 0% chance over 30 yrs
- Wildfire 4/10 Moderate
- Heat 8/10 Severe 7 d/yr ≥108°F today · 21 d/yr by 30 yrs out
- Wind 9/10 Extreme 99% chance of damaging wind over 30 yrs
- Air quality 4/10 Moderate 5 unhealthy d/yr today · 5 by 30 yrs out
Nearby sold comps map
Loading sold comps map…
Walkable amenities ~0.75 mi
Loading nearby amenities…
Taxation est. · year 1
- Rental income
- $21,711
- − Mortgage interest
- −$8,514
- − Property taxes
- −$2,280
- − Insurance
- −$760
- − Repairs & maintenance
- −$1,737
- − Management
- −$1,737
- − Depreciation
- −$4,422
- Taxable income
- $2,261
- Est. tax owed @ 24.0%
- −$543
- After-tax cash flow
- $4,004/yr
For passive investors: Depreciation is non-cash, so a rental often shows a tax loss while cash-flowing — sheltering income. Rental losses are passive: they offset passive income freely, and up to $25,000/yr can offset ordinary (W-2) income if you actively participate and your MAGI is under $100k (phasing out to $0 by $150k); unused losses carry forward. On sale, claimed depreciation is recaptured at up to 25%, and gains may owe capital-gains tax (a 1031 exchange can defer both). Figures are a year-1 estimate at your 24.0% rate — not tax advice; consult a CPA.
Condition & rehab AI · 10 photos
This 3-bedroom, 2-bathroom home requires moderate renovations to update the kitchen and bathrooms, paint interior walls, and replace carpeting with hardwood or tile. The home's location and size make it a good investment opportunity.
Repairs flagged
- Moderate kitchen cabinets — dated and in need of updating
- Minor bathroom fixtures — standard fixtures
- Moderate exterior siding — showing some wear
Value-add opportunities
- Both update kitchen cabinets and countertops — modernizing the kitchen would appeal to buyers and renters
- Both update bathrooms with new fixtures and tile — modernizing bathrooms would appeal to buyers and renters
- Both paint interior walls — fresh paint would improve the home's curb appeal and interior aesthetics
- Both replace carpeting with hardwood or tile — hardwood or tile flooring would increase the home's value and appeal to buyers and renters
- Both trim and maintain landscaping — well-maintained landscaping would improve the home's curb appeal and attract buyers and renters
Renovation cost estimate screening
| Repair item | Severity | Est. cost |
|---|---|---|
| kitchen cabinets · dated and in need of updating | Moderate | $3,000–15,000 |
| bathroom fixtures · standard fixtures | Minor | $500–3,000 |
| exterior siding · showing some wear | Moderate | $3,000–15,000 |
| Total estimated repair cost · 3 items | $6,500–33,000 |
Value-add ROI direction
- Both update kitchen cabinets and countertops — modernizing the kitchen would appeal to buyers and renters ↑
- Both update bathrooms with new fixtures and tile — modernizing bathrooms would appeal to buyers and renters ↑
- Both paint interior walls — fresh paint would improve the home's curb appeal and interior aesthetics ↑
- Both replace carpeting with hardwood or tile — hardwood or tile flooring would increase the home's value and appeal to buyers and renters ↑
- Both trim and maintain landscaping — well-maintained landscaping would improve the home's curb appeal and attract buyers and renters ↑
ⓘ Cost ranges are severity-bucket heuristics (US national rule-of-thumb). Get contractor quotes + a written scope before underwriting a rehab budget.
Schools (NCES district)
- District
- Marion
- NCES district ID
- 1201260
- Math proficiency
- 42% ▼ -7.00%
- Reading proficiency
- 43% ▼ -4.00%
- Median HH income
- $40,015
- Composite
- 35.61/100
- National rank
- #4890
- State rank
- #61 of 73 in FL
Livability — Ocala
- Score
- 69/100
- State rank
- #476
- US rank
- #8461
Category grades
Schools grade is shown separately in the Schools card above.
Census & demographics
- County
- Marion County · 315,796 people
- City population
- 263,375
- Metro
- Ocala, FL
- Population (ZIP)
- 13,264
- Household income
- $54,283
- Rent vs Own
- Severe rent burden
- 664.0
Population outlook (Marion County) Hauer SSP2
- Today (2025)
- 365,905 people
- By 2030
- 376,768 · +3.0%
- By 2040
- 396,555 · +8.4%
- By 2050
- 412,723 · +12.8%
- By 2075
- 446,090 · +21.9%
- By 2100
- 436,193 · +19.2%
Race, ethnicity, and origin ACS 2023
- Neighborhood character
- Predominantly White (66%)
- Race & ethnicity
- White 66% Hispanic / Latino 15% Black 14% Two or more races 9%
- Hispanic origin (detail)
- Mexican 5% Puerto Rican 6% Cuban 2%
- Common ancestry
- Lithuanian 2% Italian 2% Estonian 1%
- Foreign-born
- 5% · Canada, Jamaica
- Languages at home
- 87% English-only · Spanish 11% Other Indo-European 1%
Political lean MEDSL · Marion
- 2024 margin
- Solid R (+31.6) · D 33.8% · R 65.5%
- 2008→2024 swing
- -20.0pp toward R · 2008: -11.6pp · 2024: -31.6pp
- All cycles
- 2024: R+31.6 2020: R+25.9 2016: R+26.2 2012: R+16.2 2008: R+11.6
Not yet ingested
- Civics
- —
Market trends
- HPI YoY
- ▼ -111.70%
- Current HPI
- 248.7063
- Rent YoY
- —
- Metro
- Ocala, FL
- State GDP YoY
- ▲ 3.28%
- F500 in state
- 36
Industry mix (Fortune 500 HQ in FL)
| Industry | F500 HQs | Revenue |
|---|---|---|
| Industrial Technology | 2 | $29B |
|
||
| Insurance | 2 | $17B |
|
||
| Retail | 1 | $60B |
|
||
| Technology Distribution | 1 | $58B |
|
||
| Homebuilding | 1 | $35B |
|
||
| Technology Manufacturing | 1 | $35B |
|
||
Price history
2 events — show timeline
- 2026-05-20 Pending — Stellar MLS as Distributed by MLS Grid
- 2026-05-12 Listed $152,000 Stellar MLS as Distributed by MLS Grid
Cash-flow waterfall
monthlySold comps — $/sqft
last 12 mo · ≤1 miLoading sold comps…