630 Snug Harbor Dr Unit C14 · Boynton Beach, FL
Flood risk 6/10 · Moderate
- FEMA flood zone
- X (shaded)
- Chance of flooding over 30 yrs
- 0.56%
- Est. flood insurance / yr
- $507 – $1,088
Fire risk 1/10 · Minimal
- Est. fire insurance / yr
- $947 – $1,759
Heat risk 10/10 · Severe
- Hot days now (above 105°F)
- 7 days/yr
- Hot days in 30 yrs
- 29 days/yr
Wind risk 10/10 · Severe
- Chance of severe wind over 30 yrs
- 99.0%
Air-quality risk 2/10 · Minimal
- Unhealthy air days now
- 1 days/yr
- Unhealthy air days in 30 yrs
- 2 days/yr
Risk factors via First Street. Map © Google.
Why this score? — see what drove the C+ grade
The composite is a weighted blend of 9 inputs, each scored 0–100. Each bar is that input's sub-score; the figure is the points it added to the 100-point composite (weight × sub-score).
- Cash flow +25.1/30.0
- 1% rule +10.0/10.0
- DSCR +8.2/10.0
- ARV discount +7.5/15.0
- Schools +4.3/10.0
- Livability +3.6/5.0
- Rent growth +3.4/5.0
- Condition / age +2.5/5.0
- Appreciation +0.0/10.0
$110,000
🖨 Deal sheet (PDF) 📄 Offer letter ✓ Due diligence
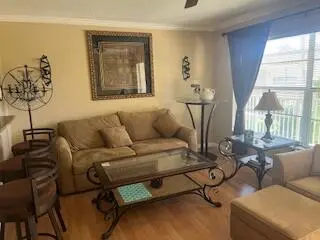
Listing remarks
Beautifully remodeled 1 bedroom, 1 bath unit located in the heart of growing Boynton Beach. There are 2 large closets ( 1 walk in) in the large master bedroom, both with built in organizers. Kitchen has been opened up with breakfast bar. Beautiful clubhouse and pool right on the intracoastal. This 55+ complex is very well maintained. Condo is move in ready and will not last long. Furniture is negotiable. Artwork over the couch does not convey. All assessments have been paid in full.
Key facts
- $547 HOA
- 127 parking spots
- Community pool
Property features AI
Finance
- Other: Pets not allowed
- HOA & community: Part of Snug Harbor association; Monthly HOA fee (includes grounds and structure maintenance, sewer, trash, water, common areas); Community amenities: clubhouse, car wash area, fitness center, pool, community room, maintenance; Senior community
Exterior
- Parking: Assigned parking; Guest parking; 1 open parking space (127 total parking spaces in property)
- Utilities: Public water; Public sewer; Cable available
- Home design: Condominium; Resale property; Second-floor entry; 2-story building; Faces east
- Construction: Block construction; Other roof
- Exterior features: Open porch
Interior
- Kitchen: Electric range; Gas range; Dishwasher; Microwave; Refrigerator; Garbage disposal; Electric water heater
- Bedrooms: 1 bedroom on the main level
- Flooring: Ceramic tile; Laminate
- Bathrooms: 1 full bathroom
- Heating & cooling: Electric heating; Electric cooling
- Interior features: Closet cabinetry; Blinds
- Laundry & utility: Washer/dryer hookups negotiable (furnished status: negotiable)
Neighborhood map
What this means for you Summary
Snapshot
- This is a 1-bed/1.0-bath condo listed at $110k.
Deal economics
- At list price, monthly cash flow is $242 ($3k/yr) — positive.
- The deal already cash-flows at list — no discount required.
- Meets the 1% rule at list price ($2k rent vs $110k).
- Recommended offer: $100k (9.0% below list) — sets the bar for market timing.
Location & tenants
- Location reads 72/100 on livability (#351 in FL) — a middle-class / working-renter tenant base. Strengths: housing A+, health & safety B+, cost of living B; Watch: amenities D+, crime D-, commute F.
- Palm Beach (suburban): math 46% / reading 53% proficiency, ranked #34 of 73 in FL (top 47%) — families likely to look elsewhere, expect single-tenant / working-renter base with shorter leases.
- Zoned schools: Forest Park Elementary School (math 42% / reading 38%, grade F, #1,491 of 2,144 statewide, top 70%, 571 students, 81% FRL); Boynton Beach Community High (math 13% / reading 25%, grade F, #565 of 667 statewide, top 85%, 1,547 students, 65% FRL) — zoned schools average 73% FRL vs 52% district-wide (21 pts higher); higher-poverty schools than district average — tighter screening recommended.
- Zoned-school proficiency averages 30% at this address vs 50% district-wide (-20 pts) — the specific schools serving this property underperform the Palm Beach average; the district grade overstates school quality for this exact location.
- Market conditions: Rents rising (+3.6%/yr); 542 active listings in the ZIP; 38 comparable units currently listed for rent nearby; rentals at typical pace (median 22d on market — plan ~3-4 weeks tenant-placement turnaround); 3,974 units permitted in Palm Beach County in 2024 (1,012 in 5+ unit buildings).
Forward outlook
- Local home prices are declining (-3.0%/yr); year-one equity from $761 of loan paydown is wiped out by about $3k of value loss. Plan a longer hold.
- Palm Beach County population projected at +30% by 2050 — long-run rental-demand tailwind backs the buy-and-hold thesis.
- At projected returns (-3.0% appreciation + 3.6% rent growth), your $31k cash investment doubles in ~10 years — after that, you're playing with house money.
Negotiation context
- It's been on market 97 days — a 9% lower offer ($100k) is reasonable based on typical stale-listing flexibility.
- 7 sale attempts since 25y ago with the ask held roughly flat each time — persistent listings suggest the price (not the market) is what's stuck; bring a comps-based counter.
- Current owner paid $56k; list at $110k implies a 95% gain — meaningful room to come down on a strong offer.
Risks & watch-outs
- Watch-outs: HOA is 27% of rent.
- Climate carrying-cost: major flood risk; severe wind risk, 99% chance of damaging wind over 30y; extreme-heat days projected 7→29/yr by 2055 (HVAC capex compounding) — expect insurance premiums to compound above CPI over the hold.
Questions for the listing agent
- It's been on market 97 days. Have you received any prior offers? Is the seller open to a 9% concession, seller financing, or rate buy-down credit?
- Built in 1971 — when were the roof, HVAC, electrical panel, plumbing, and water heater last replaced?
- What does the HOA fee cover, when was the last increase, and are there any pending special assessments or reserve-fund shortfalls?
- Any open or pending special assessments — roof, HVAC, plumbing, elevator, façade? What's the per-unit balance and payoff schedule, and is the seller paying it off at close or rolling it to the buyer?
- Why hasn't it sold? Are there any deal-killer items the seller is aware of (foundation, flood, title, zoning, code violations)?
- Is there a deadline driving the sale (1031 exchange, divorce, estate, relocation)? That informs how much negotiation room exists.
- Crime grade is D in this area — have there been break-ins, vandalism, or insurance claims at this property in the last 3 years? What carrier currently insures it and at what premium?
- What's the average days-on-market for RENTAL listings here right now (not sales)? A rising rental-DOM trend means longer vacancies and softer asking-rent achievability than the comps imply.
- What's the recent tenant-quality profile in this submarket — average credit score on applications, eviction rate, late-payment / NSF rate, and stable-employment percentage? A property-management company in the area should have these aggregated.
- How much new apartment / multifamily construction is in the pipeline within 1–3 miles? Heavy new supply (>2% of stock underway) typically softens rents 12–24 months out; light construction supports rent growth.
Investment metrics
- 1% rule
- 1.83% ✓
- Cap rate
- 8.94%
- Cash-on-cash
- 9.45%
- DSCR
- 1.42
- GRM
- 4.6
CMA / ARV
No comps found within radius.
Projected returns pro-forma
-3.0% appreciation · 3.64% rent growth · sell at horizon
- IRR
- -0.6%
- Equity multiple
- 0.98×
- Total profit
- $-689
- Equity at exit
- $16,401
- IRR
- 10.4%
- Equity multiple
- 1.85×
- Total profit
- $26,281
- Equity at exit
- $9,511
Cash invested: $30,800 (down + closing). Projections, not guarantees.
Landlord ↔ Tenant lean methodology
- Overall (STATE)
- 87 Strongly Landlord-Friendly
- State Florida
- 87 Strongly Landlord-Friendly · R+3
- County
- — inherits STATE
- City
- — inherits STATE
ZIP-level market 33435
- Rents YoY
- 3.6%
- Active inventory
- 542
- Price-to-rent
- 4.6×
Monthly cashflow live
- Estimated rent
- $2,009 high interval (Pro) →
- Mortgage (P&I)
- −$577
- Tax from tax record
- −$175 /mo · $2,099/yr
- Insurance
- −$46
- HOA
- −$547
- Lot rent
- −$0
- Vacancy / Maint / Mgmt
- −$422
- Net cashflow
- $242
Break-even live
Sensitivity live
| Price | -10% $305 | -5% $274 | +0% $242 | +5% $211 | +10% $180 |
|---|---|---|---|---|---|
| Rent | -10% $84 | -5% $163 | +0% $242 | +5% $322 | +10% $401 |
| Rate | -1.0pp $298 | -0.5pp $270 | base $242 | +0.5pp $214 | +1.0pp $185 |
UW: 25.0% down · 7.5% · 30yr · 1.5% tax · 5.0% vac · 8.0% maint · 8.0% mgmt
Financing live
Cash to close
- Down payment
- $27,500
- Closing costs
- $3,300
- Reserves months
- —
- Total cash needed
- —
Loan-product check · same deal, 3 products live
Conventional
25% down · 7.5% · 30yr
- Down + closing
- —
- Monthly P&I
- —
- Monthly cashflow
- —
- DSCR
- —
- Eligible?
- —
Personal DTI + credit; lowest rate.
DSCR
20% down · 8.5% · 30yr
- Down + closing
- —
- Monthly P&I
- —
- Monthly cashflow
- —
- DSCR
- —
- Eligible?
- —
No personal income docs; deal must DSCR.
Hard money
10% down · 12.0% · 12mo
- Down + closing
- —
- Monthly P&I
- —
- Monthly cashflow
- —
- DSCR
- —
- Eligible?
- —
Short-term bridge; refi at stabilization.
Rent comps 38 comps
| Address | Beds | Baths | Sqft | Rent | $/sqft | DOM | Units | Dist |
|---|---|---|---|---|---|---|---|---|
| 638 Snug Harbor Dr Boynton Beach, FL | 1.0–2.0 | 1.0–2.0 | 747 | $1,600 | $2.14 | 26d | 2 | 0.05mi |
| 640 Snug Harbor Dr Unit F3 Boynton Beach, FL | 1.0 | 1.0 | 629 | $2,500 | $3.97 | 13d | 1 | 0.05mi |
| 1001 S Federal Hwy Unit 3 Boynton Beach, FL | 1.0 | 1.0 | 650 | $1,995 | $3.07 | 26d | 1 | 0.23mi |
| 800 Horizons W #211 Boynton Beach, FL | 1.0 | 1.0 | 570 | $1,650 | $2.89 | 17d | 1 | 0.37mi |
| 5505 N Ocean Blvd Ocean Ridge, FL | 1.0–2.0 | 1.0–2.0 | 774 | $1,950 | $2.52 | 13d | 3 | 0.37mi |
| 850 Horizons E #309 Boynton Beach, FL | 1.0 | 1.5 | 646 | $1,990 | $3.08 | 23d | 1 | 0.39mi |
| 515 SE 20th Ave Boynton Beach, FL | 2.0 | 1.0 | 787 | $1,719 | $2.18 | 1d | 5 | 0.40mi |
| 405 SE 20th Ave Unit 5F Boynton Beach, FL | — | 1.0 | 600 | $1,489 | $2.48 | 24d | 1 | 0.43mi |
| 620 Horizons W #207 Boynton Beach, FL | 1.0 | 1.0 | 570 | $1,200 | $2.11 | 26d | 1 | 0.45mi |
| 650 Horizons E #107 Boynton Beach, FL | 1.0 | 1.0 | 570 | $1,600 | $2.81 | 26d | 1 | 0.46mi |
| 2303 S Federal Hwy #19 Boynton Beach, FL | 1.0 | 1.0 | 615 | $1,450 | $2.36 | 7d | 1 | 0.55mi |
| 1407 Tuscany Way #1407 Boynton Beach, FL | 1.0 | 1.0 | 721 | $2,100 | $2.91 | 5d | 1 | 0.55mi |
| 22 Oceanview Dr Ocean Ridge, FL | 1.0 | 1.0 | 620 | $3,500 | $5.65 | 26d | 1 | 0.57mi |
| 2412 Tuscany Way Boynton Beach, FL | 1.0 | 1.0 | 750 | $3,000 | $4.00 | 26d | 1 | 0.58mi |
| 2301 SE 4th St Unit 15 Boynton Beach, FL | 1.0 | 1.0 | 573 | $1,545 | $2.70 | 26d | 1 | 0.58mi |
| 2301 SE 4th St #11 Boynton Beach, FL | 1.0 | 1.0 | 573 | $1,595 | $2.78 | 26d | 1 | 0.58mi |
| 207 SE 4th Ave Boynton Beach, FL | 1.0 | 1.0 | 650 | $1,795 | $2.76 | 4d | 1 | 0.59mi |
| 240 Horizons W #108 Boynton Beach, FL | 1.0 | 1.5 | 646 | $1,600 | $2.48 | 26d | 1 | 0.60mi |
| 640 SE 2nd Ave Unit 111 Boynton Beach, FL | 1.0 | 1.0 | 650 | $1,720 | $2.65 | 5d | 1 | 0.66mi |
| 21 Ruthmary Ave Unit G Briny Breezes, FL | 1.0 | 1.0 | 396 | $2,850 | $7.20 | 26d | 1 | 0.69mi |
| 101 S Federal Hwy Boynton Beach, FL | 1.0–2.0 | 1.0–2.0 | 906 | $2,012 | $2.22 | 0d | 15 | 0.69mi |
| 14 South Ln Unit A Boynton Beach, FL | — | 1.0 | 430 | $1,500 | $3.49 | 1d | 1 | 0.71mi |
| 4603 N Ocean Blvd Unit 1018163P Boynton Beach, FL | 2.0 | 1.0 | 581 | $2,573 | $4.43 | 24d | 1 | 0.72mi |
| 205 Coral Rd Unit 1 Boynton Beach, FL | 1.0 | 1.0 | 500 | $2,300 | $4.60 | 26d | 1 | 0.77mi |
| 100 NE 6th St Boynton Beach, FL | 1.0 | 1.0 | 745 | $2,975 | $3.99 | 22d | 3 | 0.80mi |
| 100 NE 6th St Boynton Beach, FL | 1.0 | 1.0 | 745 | $2,975 | $3.99 | 14d | 3 | 0.80mi |
| 115 SW 1st Ave Boynton Beach, FL | 1.0–2.0 | 1.0–2.0 | 804 | $1,875 | $2.33 | 17d | 2 | 0.84mi |
| 400 N Federal Hwy Unit N304 Boynton Beach, FL | 1.0 | 1.0 | 640 | $2,400 | $3.75 | 26d | 1 | 0.95mi |
| 518 NE 4th St Unit A Boynton Beach, FL | 1.0 | 1.0 | 500 | $1,700 | $3.40 | 18d | 1 | 1.05mi |
| 3851 N Ocean Blvd Gulf Stream, FL | 1.0–2.0 | 1.0 | 677 | $2,900 | $4.28 | 0d | 3 | 1.15mi |
| 689 NE 6th Ct #4070 Boynton Beach, FL | 1.0 | 1.0 | 703 | $1,900 | $2.70 | 19d | 1 | 1.18mi |
| 689 NE 6th Ct #404 Boynton Beach, FL | 1.0 | 1.0 | 703 | $2,000 | $2.84 | 26d | 1 | 1.18mi |
| 6520 N Ocean Blvd Apt 3 Ocean Ridge, FL | 1.0 | 1.0 | 702 | $3,500 | $4.99 | 26d | 1 | 1.18mi |
| 6520 N Ocean Blvd Ocean Ridge, FL | 1.0–2.0 | 1.0 | 776 | $2,400 | $3.09 | 14d | 1 | 1.18mi |
| 615 NE 7th Ave Boynton Beach, FL | 1.0 | 1.0 | 698 | $1,699 | $2.43 | 19d | 1 | 1.22mi |
| 2861 S Seacrest Blvd Boynton Beach, FL | 1.0 | 1.0 | 710 | $1,680 | $2.37 | 4d | 3 | 1.24mi |
| 717 NE 10th Ave Unit 6 Boynton Beach, FL | 1.0 | 1.0 | 700 | $1,600 | $2.29 | 10d | 1 | 1.41mi |
| 656 Manor Dr Unit 3 Boynton Beach, FL | — | 1.0 | 650 | $1,600 | $2.46 | 24d | 1 | 1.45mi |
HOA detail condo
- Monthly dues
- $547 · $6,564/yr
- Likely covers
- pool
- Assessments
- None detected in remarks — confirm with the listing agent.
Listing history 36 events
-
2026-06-22days on market $110,000 Active 97 DOM
-
2026-06-21days on market $110,000 Active 96 DOM
-
2026-06-18days on market $110,000 Active 93 DOM
-
2026-06-17days on market $110,000 Active 92 DOM
-
2026-06-16days on market $110,000 Active 91 DOM
-
2026-06-15days on market $110,000 Active 90 DOM
-
2026-06-13days on market $110,000 Active 88 DOM
-
2026-06-09days on market $110,000 Active 84 DOM
-
2026-06-08days on market $110,000 Active 83 DOM
-
2026-06-07days on market $110,000 Active 82 DOM
-
2026-06-04days on market $110,000 Active 79 DOM
-
2026-06-03days on market $110,000 Active 78 DOM
-
2026-06-02days on market $110,000 Active 77 DOM
-
2026-06-01days on market $110,000 Active 76 DOM
-
2026-05-31days on market $110,000 Active 75 DOM
-
2026-03-17status Active
-
2026-03-17historical
-
2026-03-16$110,000 Active
-
2016-05-01historical
-
2014-10-28historical
-
2012-11-13soldstatus $56,500
-
2012-11-08soldstatus $56,500
-
2012-11-07historical
-
2012-09-14$62,000
-
2012-04-30historical
-
2011-11-08$89,900
-
2006-04-25$123,500
-
2003-08-21soldstatus $66,000
-
2002-09-09$68,000
-
2001-09-04soldstatus $51,000
-
2001-08-31soldstatus $51,000
-
2001-07-27historical
-
2001-05-03$55,000
-
1996-02-09soldstatus $34,500
-
1995-12-06soldstatus $29,500
-
1991-08-22soldstatus $30,000
ⓘ Source: listings_history table (triggers on properties + properties_extension) + one-shot
backfill from property_details.listing_events for pre-trigger history.
Tax reassessment forecast FL · Resets to sale price
- Current annual tax
- $2,099 · $175/mo
- Projected year-2 tax
- $2,099 · $175/mo
- Expected delta
- $0/yr ($0/mo · 0.0%)
ⓘ Screening estimate from a state-policy table — verify with the county assessor before closing.
Climate risk First Street
- Flood 6/10 Major FEMA zone X (shaded) · 56% chance over 30 yrs
- Wildfire 1/10 Low
- Heat 10/10 Extreme 7 d/yr ≥105°F today · 29 d/yr by 30 yrs out
- Wind 10/10 Extreme 99% chance of damaging wind over 30 yrs
- Air quality 2/10 Low 1 unhealthy d/yr today · 2 by 30 yrs out
Nearby sold comps map
Loading sold comps map…
Walkable amenities ~0.75 mi
Loading nearby amenities…
Taxation est. · year 1
- Rental income
- $24,108
- − Mortgage interest
- −$6,162
- − Property taxes
- −$2,099
- − Insurance
- −$550
- − Repairs & maintenance
- −$1,929
- − Management
- −$1,929
- − HOA
- −$6,564
- − Depreciation
- −$3,200
- Taxable income
- $1,676
- Est. tax owed @ 24.0%
- −$402
- After-tax cash flow
- $2,508/yr
For passive investors: Depreciation is non-cash, so a rental often shows a tax loss while cash-flowing — sheltering income. Rental losses are passive: they offset passive income freely, and up to $25,000/yr can offset ordinary (W-2) income if you actively participate and your MAGI is under $100k (phasing out to $0 by $150k); unused losses carry forward. On sale, claimed depreciation is recaptured at up to 25%, and gains may owe capital-gains tax (a 1031 exchange can defer both). Figures are a year-1 estimate at your 24.0% rate — not tax advice; consult a CPA.
Schools (NCES district)
- District
- Palm Beach
- NCES district ID
- 1201500
- Math proficiency
- 46% ▼ -16.00%
- Reading proficiency
- 53% ▼ -4.00%
- Median HH income
- $53,943
- Composite
- 42.72/100
- National rank
- #3160
- State rank
- #34 of 73 in FL
Livability — Boynton Beach
- Score
- 72/100
- State rank
- #351
- US rank
- #6098
Category grades
Schools grade is shown separately in the Schools card above.
Census & demographics
- Census place
- Boynton Beach, FL
- County
- Palm Beach County · 1,438,312 people
- City population
- 148,060
- Metro
- Miami-Fort Lauderdale-Pompano Beach, FL
- Population (ZIP)
- 37,833
- Household income
- $67,979
- Rent vs Own
- Severe rent burden
- 1623.0
Population outlook (Palm Beach County) Hauer SSP2
- Today (2025)
- 1,637,487 people
- By 2030
- 1,743,255 · +6.5%
- By 2040
- 1,948,712 · +19.0%
- By 2050
- 2,132,979 · +30.3%
- By 2075
- 2,530,027 · +54.5%
- By 2100
- 2,706,979 · +65.3%
Race, ethnicity, and origin ACS 2023
- Neighborhood character
- Diverse neighborhood (Simpson 0.65)
- Race & ethnicity
- White 41% Black 40% Hispanic / Latino 15% Two or more races 10%
- Hispanic origin (detail)
- Mexican 3% Puerto Rican 3% Cuban 2% Dominican 1%
- Common ancestry
- Hispanic 23% Romanian 2% Lithuanian 2%
- Foreign-born
- 30% · Canada, Jamaica
- Languages at home
- 61% English-only · French/Haitian/Cajun 24% Spanish 11% Other Indo-European 2%
Political lean MEDSL · Palm Beach
- 2024 margin
- Toss-up / Even · D 50.0% · R 49.2%
- 2008→2024 swing
- -22.1pp toward R · 2008: 22.9pp · 2024: 0.8pp
- All cycles
- 2024: D+0.8 2020: D+12.8 2016: D+15.3 2012: D+17.0 2008: D+22.9
Not yet ingested
- Civics
- —
Market trends
- HPI YoY
- ▼ -345.86%
- Current HPI
- 371.0527
- Rent YoY
- ▲ 3.64%
- Metro
- Miami-Fort Lauderdale-Pompano Beach, FL
- State GDP YoY
- ▲ 3.28%
- F500 in state
- 36
Industry mix (Fortune 500 HQ in FL)
| Industry | F500 HQs | Revenue |
|---|---|---|
| Industrial Technology | 2 | $29B |
|
||
| Insurance | 2 | $17B |
|
||
| Retail | 1 | $60B |
|
||
| Technology Distribution | 1 | $58B |
|
||
| Homebuilding | 1 | $35B |
|
||
| Technology Manufacturing | 1 | $35B |
|
||
Price history
+266.7% since first listed21 events — show timeline
- 2026-03-17 Relisted — Beaches MLS
- 2026-03-17 Listing Removed — Beaches MLS
- 2026-03-16 Listed $110,000 Beaches MLS
- 2016-05-01 Listing Removed — Beaches MLS
- 2014-10-28 Listing Removed — Beaches MLS
- 2012-11-13 Sold (Public Records) $56,500 Public Records
- 2012-11-08 Sold (MLS) $56,500 Beaches MLS
- 2012-11-07 Listing Removed — Beaches MLS
- 2012-09-14 Listed $62,000 Beaches MLS
- 2012-04-30 Listing Removed — Beaches MLS
- 2011-11-08 Listed $89,900 Beaches MLS
- 2006-04-25 Listed $123,500 Beaches MLS
- 2003-08-21 Sold (Public Records) $66,000 Public Records
- 2002-09-09 Listed $68,000 Beaches MLS
- 2001-09-04 Sold (Public Records) $51,000 Public Records
- 2001-08-31 Sold (MLS) $51,000 Beaches MLS
- 2001-07-27 Listing Removed — Beaches MLS
- 2001-05-03 Listed $55,000 Beaches MLS
- 1996-02-09 Sold (Public Records) $34,500 Public Records
- 1995-12-06 Sold (Public Records) $29,500 Public Records
- 1991-08-22 Sold (Public Records) $30,000 Public Records
Property tax history
+7.5%/yrLatest (2025): $2,099 · +8.7% YoY. Source: county tax records.
Cash-flow waterfall
monthlySold comps — $/sqft
last 12 mo · ≤1 miLoading sold comps…