500 Munn Rd · Delhi, NY
Flood risk 1/10 · Minimal
- FEMA flood zone
- X (unshaded)
- Chance of flooding over 30 yrs
- 0.0%
- Est. flood insurance / yr
- $473 – $860
Fire risk 3/10 · Minor
- Est. fire insurance / yr
- $691 – $1,283
Heat risk 1/10 · Minimal
- Hot days now (above 89°F)
- 7 days/yr
- Hot days in 30 yrs
- 17 days/yr
Wind risk 2/10 · Minimal
- Chance of severe wind over 30 yrs
- 1.0%
Air-quality risk 2/10 · Minimal
- Unhealthy air days now
- 0 days/yr
- Unhealthy air days in 30 yrs
- 1 days/yr
Risk factors via First Street. Map © Google.
Why this score? — see what drove the C+ grade
The composite is a weighted blend of 9 inputs, each scored 0–100. Each bar is that input's sub-score; the figure is the points it added to the 100-point composite (weight × sub-score).
- Cash flow +21.7/30.0
- Appreciation +7.9/10.0
- ARV discount +7.5/15.0
- DSCR +6.9/10.0
- 1% rule +5.5/10.0
- Livability +3.6/5.0
- Schools +3.5/10.0
- Rent growth +2.5/5.0
- Condition / age +2.5/5.0
$270,000
🖨 Deal sheet 📄 Offer letter ✓ Due diligence
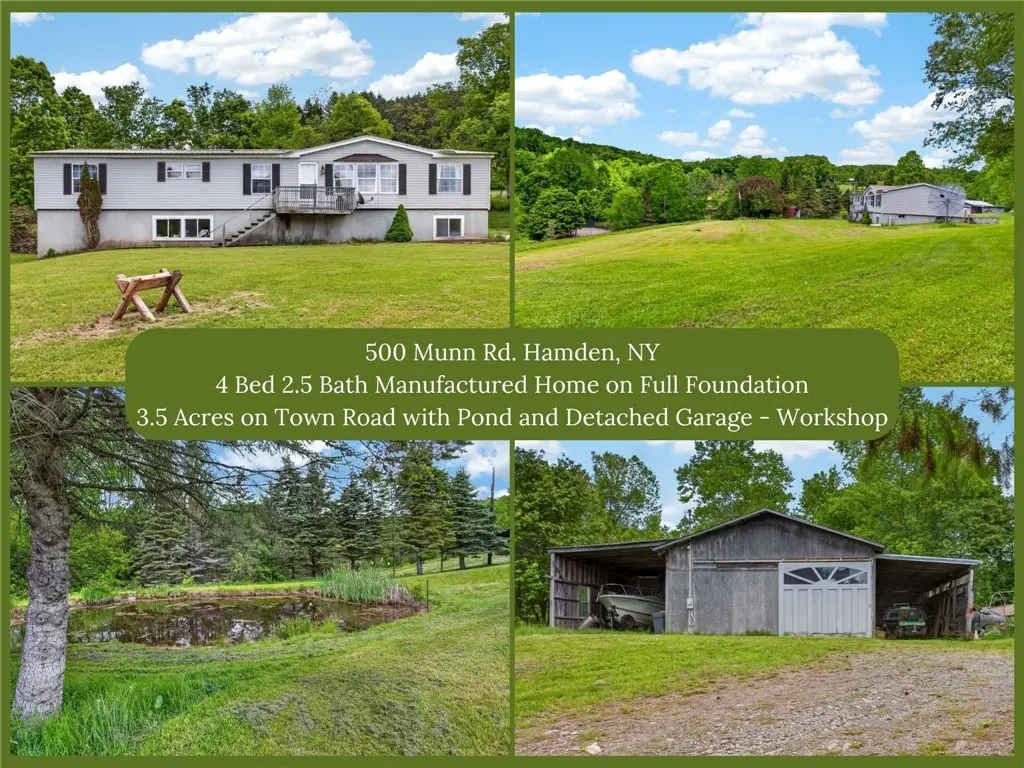
Listing remarks
This well maintained property exemplifies pride of ownership and site design. The home itself is a 1995 doublewide manufactured home, with an inviting layout and plenty of living space. Enter from the enclosed 3 season covered porch (always a bonus to have that dedicated entry room for all your gear), past the laundry room, and into a spacious combination living-kitchen-dining area. The corner woodstove adds ambience and cost effective heating to the majority of the living area. A bar height island gives just enough separation for the spaces to feel discrete yet sensibly combined. One end of the home features the primary suite containing the large bedroom, walk-in closet, and full bathroom
Key facts
- Corner woodstove
- Full basement
- Bar height island
Tags
Property features AI
Exterior
- Parking: Attached garage; 2 garage spaces
- Utilities: Well water; Septic tank
- Home design: Single-story (1 story); Double wide mobile body type; Existing construction
- Construction: Vinyl siding; Poured foundation
- Exterior features: Gravel driveway; Open porch; Pond on property; Barn(s), outbuilding(s), and storage/shed(s); Irregular, rural lot
Interior
- Kitchen: Gas oven; Gas range; Dishwasher; Refrigerator; Kitchen island
- Bedrooms: 4 main level bedrooms
- Flooring: Carpet; Laminate; Tile; Vinyl; Varies
- Bathrooms: 2 full bathrooms; 1 half bathroom; 2 main level bathrooms
- Heating & cooling: Propane heating; Oil heating; Wood stove; Baseboard heating; Stove heating; Has heating
- Interior features: Cathedral ceilings; Kitchen island; Primary suite; Primary on main level; Bedroom on main level; Finished full basement; See remarks
- Laundry & utility: Washer; Dryer; Main level laundry; Oil water heater
Neighborhood map
What this means for you Summary
Snapshot
- This is a 3-bed/2.0-bath manufactured listed at $270k.
Deal economics
- At list price, monthly cash flow is $415 ($5k/yr) — positive.
- The deal already cash-flows at list — no discount required.
- Meets the 1% rule at list price ($3k rent vs $270k).
Location & tenants
- Location reads 71/100 on livability (#393 in NY) — a middle-class / working-renter tenant base. Strengths: housing A+, health & safety A+, cost of living B+; Watch: amenities F, commute F.
- Walton Central School District (town): math 36% / reading 47% proficiency, ranked #510 of 590 in NY (top 86%) — families likely to look elsewhere, expect single-tenant / working-renter base with shorter leases.
- Market conditions: 57 active listings in the ZIP; 66 units permitted in Delaware County in 2024 (0 in 5+ unit buildings).
Forward outlook
- In year one you build about $18k of equity ($2k loan paydown + $16k appreciation (5.8% local appreciation)).
- Delaware County population projected at -27% by 2050 — secular population decline; favor cash flow + early exit over multi-decade hold.
- At projected returns (5.8% appreciation + 3.0% rent growth), your $76k cash investment doubles in ~4 years — after that, you're playing with house money.
- By year 3, paydown + projected appreciation supports a ~$43k cash-out refi (75% LTV) — recoverable capital for the next deal without selling this one.
Negotiation context
- Only 10 days on market — expect competitive offers; lowballing is unlikely to land.
Questions for the listing agent
- Is there a deadline driving the sale (1031 exchange, divorce, estate, relocation)? That informs how much negotiation room exists.
- What's the average days-on-market for RENTAL listings here right now (not sales)? A rising rental-DOM trend means longer vacancies and softer asking-rent achievability than the comps imply.
- What's the recent tenant-quality profile in this submarket — average credit score on applications, eviction rate, late-payment / NSF rate, and stable-employment percentage? A property-management company in the area should have these aggregated.
- How much new for-sale + rental construction is in the pipeline within 1–3 miles? Heavy new supply typically softens prices + rents 12–24 months out; constrained supply supports both.
Investment metrics
- 1% rule
- 1.05% ✓
- Cap rate
- 8.14%
- Cash-on-cash
- 6.60%
- DSCR
- 1.29
- GRM
- 8.0
CMA / ARV
No comps found within radius.
Projected returns pro-forma
5.79% appreciation · 3.0% rent growth · sell at horizon
- IRR
- 20.3%
- Equity multiple
- 2.34×
- Total profit
- $101,141
- Equity at exit
- $166,232
- IRR
- 19.7%
- Equity multiple
- 4.67×
- Total profit
- $277,716
- Equity at exit
- $298,476
Cash invested: $75,600 (down + closing). Projections, not guarantees.
Landlord ↔ Tenant lean methodology
- Overall (STATE)
- 15 Strongly Tenant-Friendly
- State New York
- 15 Strongly Tenant-Friendly · D+10
- County
- — inherits STATE
- City
- — inherits STATE
ZIP-level market 13856
- Home prices YoY
- 1.8%
- Active inventory
- 57
- Price-to-rent
- 8.0×
Monthly cashflow live
- Estimated rent
- $2,830 medium interval (Pro) →
- Mortgage (P&I)
- −$1,416
- Tax from tax record
- −$292 /mo · $3,501/yr
- Insurance
- −$112
- HOA
- −$0
- Vacancy / Maint / Mgmt
- −$594
- Net cashflow
- $415
Break-even live
UW: 25.0% down · 7.5% · 30yr · 1.5% tax · 5.0% vac · 8.0% maint · 8.0% mgmt
Financing live
Cash to close
- Down payment
- $67,500
- Closing costs
- $8,100
- Reserves months
- —
- Total cash needed
- —
Loan-product check · same deal, 3 products live
Conventional
25% down · 7.5% · 30yr
- Down + closing
- —
- Monthly P&I
- —
- Monthly cashflow
- —
- DSCR
- —
- Eligible?
- —
Personal DTI + credit; lowest rate.
DSCR
20% down · 8.5% · 30yr
- Down + closing
- —
- Monthly P&I
- —
- Monthly cashflow
- —
- DSCR
- —
- Eligible?
- —
No personal income docs; deal must DSCR.
Hard money
10% down · 12.0% · 12mo
- Down + closing
- —
- Monthly P&I
- —
- Monthly cashflow
- —
- DSCR
- —
- Eligible?
- —
Short-term bridge; refi at stabilization.
Listing history 8 events
-
2026-06-18days on market $270,000 Active 10 DOM
-
2026-06-17days on market $270,000 Active 9 DOM
-
2026-06-16days on market $270,000 Active 8 DOM
-
2026-06-15days on market $270,000 Active 7 DOM
-
2026-06-13days on market $270,000 Active 5 DOM
-
2026-06-12days on market $270,000 Active 4 DOM
-
2026-06-09remarks 699-char remark
-
2026-06-09$270,000 Active 1 DOM
ⓘ Source: listings_history table (triggers on properties + properties_extension) + one-shot
backfill from property_details.listing_events for pre-trigger history.
Tax reassessment forecast NY · Partial reset (capped growth)
- Current annual tax
- $3,501 · $292/mo
- Projected year-2 tax
- $4,032 · $336/mo
- Expected delta
- +$531/yr (+$44/mo · 15.2%)
ⓘ Screening estimate from a state-policy table — verify with the county assessor before closing.
Climate risk First Street
- Flood 1/10 Low FEMA zone X (unshaded) · 0% chance over 30 yrs
- Wildfire 3/10 Moderate
- Heat 1/10 Low 7 d/yr ≥89°F today · 17 d/yr by 30 yrs out
- Wind 2/10 Low 100% chance of damaging wind over 30 yrs
- Air quality 2/10 Low 0 unhealthy d/yr today · 1 by 30 yrs out
Nearby sold comps map
Loading sold comps map…
Walkable amenities ~0.75 mi
Loading nearby amenities…
Taxation est. · year 1
- Rental income
- $33,959
- − Mortgage interest
- −$15,124
- − Property taxes
- −$3,501
- − Insurance
- −$1,350
- − Repairs & maintenance
- −$2,717
- − Management
- −$2,717
- − Depreciation
- −$7,855
- Taxable income
- $696
- Est. tax owed @ 24.0%
- −$167
- After-tax cash flow
- $4,819/yr
For passive investors: Depreciation is non-cash, so a rental often shows a tax loss while cash-flowing — sheltering income. Rental losses are passive: they offset passive income freely, and up to $25,000/yr can offset ordinary (W-2) income if you actively participate and your MAGI is under $100k (phasing out to $0 by $150k); unused losses carry forward. On sale, claimed depreciation is recaptured at up to 25%, and gains may owe capital-gains tax (a 1031 exchange can defer both). Figures are a year-1 estimate at your 24.0% rate — not tax advice; consult a CPA.
Schools (NCES district)
- District
- Walton Central School District
- NCES district ID
- 3629820
- Math proficiency
- 36% ▬ 0.00%
- Reading proficiency
- 47% ▲ 3.00%
- Median HH income
- $41,231
- Composite
- 34.86/100
- National rank
- #5088
- State rank
- #510 of 590 in NY
Livability — Delhi
- Score
- 71/100
- State rank
- #393
- US rank
- #6820
Category grades
Schools grade is shown separately in the Schools card above.
Census & demographics
- Population (ZIP)
- 5,915
Population outlook (Delaware County) Hauer SSP2
- Today (2025)
- 42,668 people
- By 2030
- 40,337 · -5.5%
- By 2040
- 35,514 · -16.8%
- By 2050
- 31,265 · -26.7%
- By 2075
- 24,455 · -42.7%
- By 2100
- 19,529 · -54.2%
Race, ethnicity, and origin ACS 2023
- Neighborhood character
- Predominantly White (90%)
- Race & ethnicity
- White 90% Black 5% Two or more races 5% Hispanic / Latino 2%
- Common ancestry
- Iranian 7% Slovak 3% Lithuanian 3%
- Foreign-born
- 3% · Canada, Philippines
- Languages at home
- 94% English-only · Spanish 2% Other Indo-European 1% French/Haitian/Cajun 1%
Political lean MEDSL · Delaware
- 2024 margin
- R (+19.8) · D 40.1% · R 59.9%
- 2008→2024 swing
- -14.6pp toward R · 2008: -5.2pp · 2024: -19.8pp
- All cycles
- 2024: R+19.8 2020: R+18.4 2016: R+29.2 2012: R+9.6 2008: R+5.2
Not yet ingested
- Civics
- —
Market trends
- HPI YoY
- ▲ 5.79%
- Current HPI
- 331.9799
- Rent YoY
- —
- Metro
- —
- State GDP YoY
- ▲ 2.60%
- F500 in state
- 92
Industry mix (Fortune 500 HQ in NY)
| Industry | F500 HQs | Revenue |
|---|---|---|
| Financial Services | 10 | $950B |
|
||
| Consumer Goods | 9 | $162B |
|
||
| Insurance | 4 | $225B |
|
||
| Telecommunications | 2 | $144B |
|
||
| Pharmaceuticals | 2 | $112B |
|
||
| Media / Entertainment | 2 | $69B |
|
||
Price history
1 event — show timeline
- 2026-06-08 Listed $270,000 UNYREIS
Property tax history
+5.5%/yrLatest (2025): $3,501 · -0.2% YoY. Source: county tax records.
Cash-flow waterfall
monthlySold comps — $/sqft
last 12 mo · ≤1 miLoading sold comps…