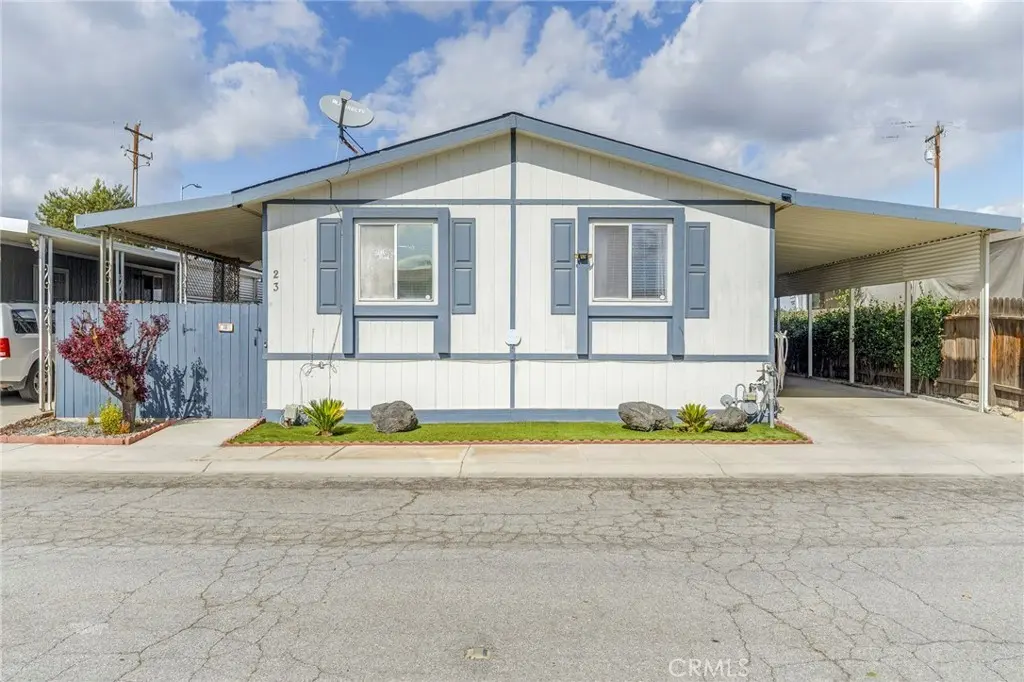
1225 Taft #23 · Bakersfield, CA
Flood risk 1/10 · Minimal
- FEMA flood zone
- X (unshaded)
- Chance of flooding over 30 yrs
- 0.0%
- Est. flood insurance / yr
- $507 – $1,088
Fire risk 1/10 · Minimal
- Est. fire insurance / yr
- $659 – $1,223
Heat risk 8/10 · Major
- Hot days now (above 104°F)
- 7 days/yr
- Hot days in 30 yrs
- 20 days/yr
Wind risk 1/10 · Minimal
- Chance of severe wind over 30 yrs
- —
Air-quality risk 10/10 · Severe
- Unhealthy air days now
- 33 days/yr
- Unhealthy air days in 30 yrs
- 37 days/yr
Risk factors via First Street. Map © Google.
Why this score? — see what drove the C+ grade
The composite is a weighted blend of 9 inputs, each scored 0–100. Each bar is that input's sub-score; the figure is the points it added to the 100-point composite (weight × sub-score).
- Cash flow +30.0/30.0
- 1% rule +10.0/10.0
- DSCR +10.0/10.0
- Rent growth +3.9/5.0
- Schools +3.4/10.0
- Livability +2.9/5.0
- Condition / age +2.5/5.0
- ARV discount +0.0/15.0
- Appreciation +0.0/10.0
$135,000
🖨 Deal sheet 📄 Offer letter ✓ Due diligence
Listing remarks MLS
Spacious and impeccably cared-for, this 3-bedroom, 2-bath manufactured home is located in the sought-after 55+ West Hills Mobile Home Park with easy access to Highway 99. The open floor plan creates a seamless flow between the expansive living area and the stylish kitchen, featuring granite countertops, crisp white cabinetry, and stainless steel appliances. The primary suite is designed for comfort, complete with a soaking tub, walk-in shower, and dual vanities. Step outside to unwind on the covered patio surrounded by mature greenery or enjoy morning coffee on the inviting front porch. With updated flooring, abundant natural light, and well-appointed finishes throughout, this home is truly move-in ready. The community offers a convenient lifestyle, just minutes from shopping, dining, and everyday amenities.
Key facts
- Soaking tub
- Walk-in shower
- Modern kitchen
Tags
Neighborhood map
What this means for you Summary
Snapshot
- This is a 3-bed/2.0-bath manufactured listed at $135k.
Deal economics
- At list price, monthly cash flow is $1k ($13k/yr) — positive.
- The deal already cash-flows at list — no discount required.
- Meets the 1% rule at list price ($2k rent vs $135k).
- Recommended offer: $119k (12.0% below list) — sets the bar for market timing.
- Cap rate 15.8% vs local median 3.6% in Bakersfield — top-decile yield for the area; either an underpriced asset or a hidden risk that comps aren't pricing in. Stress-test before assuming the spread holds.
Location & tenants
- Location reads 58/100 on livability (#716 in CA) — a working-class tenant base; expect higher turnover. Strengths: housing A+; Watch: health & safety D, schools D-, crime F.
- Kern High (urban): math 21% / reading 51% proficiency, ranked #860 of 1,400 in CA (top 61%) — families likely to look elsewhere, expect single-tenant / working-renter base with shorter leases.
- Market conditions: Rents rising fast (+5.7%/yr); 311 active listings in the ZIP; 17 comparable units currently listed for rent nearby; rentals leasing fast (median 3d on market — plan ~1-2 weeks tenant-placement turnaround); 3,244 units permitted in Kern County in 2024 (73 in 5+ unit buildings).
- At $2,402/mo this rent would consume 51% of the median local household income ($56k/yr) (locally 3246% of renters already pay >50% of income on rent) — very limited rent-growth headroom before tenants either downsize or default.
Forward outlook
- Local home prices are declining (-3.0%/yr); year-one equity from $933 of loan paydown is wiped out by about $4k of value loss. Plan a longer hold.
- Kern County population projected at +17% by 2050 — long-run rental-demand tailwind backs the buy-and-hold thesis.
- At projected returns (-3.0% appreciation + 5.7% rent growth), your $38k cash investment doubles in ~4 years — after that, you're playing with house money.
Negotiation context
- It's been on market 245 days — a 12% lower offer ($119k) is reasonable based on typical stale-listing flexibility.
- 8 sale attempts since 14y ago with the ask held roughly flat each time — persistent listings suggest the price (not the market) is what's stuck; bring a comps-based counter.
- Current owner paid $62k; list at $135k implies a 118% gain — meaningful room to come down on a strong offer.
Risks & watch-outs
- Climate carrying-cost: extreme-heat days projected 7→20/yr by 2055 (HVAC capex compounding) — expect insurance premiums to compound above CPI over the hold.
Questions for the listing agent
- It's been on market 245 days. Have you received any prior offers? Is the seller open to a 12% concession, seller financing, or rate buy-down credit?
- Why hasn't it sold? Are there any deal-killer items the seller is aware of (foundation, flood, title, zoning, code violations)?
- Is there a deadline driving the sale (1031 exchange, divorce, estate, relocation)? That informs how much negotiation room exists.
- Schools are D-rated, which usually means shorter tenancies and higher turnover. Who's the typical renter profile here, and what's been the actual vacancy rate?
- Crime grade is F in this area — have there been break-ins, vandalism, or insurance claims at this property in the last 3 years? What carrier currently insures it and at what premium?
- What's the average days-on-market for RENTAL listings here right now (not sales)? A rising rental-DOM trend means longer vacancies and softer asking-rent achievability than the comps imply.
- What's the recent tenant-quality profile in this submarket — average credit score on applications, eviction rate, late-payment / NSF rate, and stable-employment percentage? A property-management company in the area should have these aggregated.
- How much new for-sale + rental construction is in the pipeline within 1–3 miles? Heavy new supply typically softens prices + rents 12–24 months out; constrained supply supports both.
Investment metrics
- 1% rule
- 1.78% ✓
- Cap rate
- 15.80%
- Cash-on-cash
- 33.94%
- DSCR
- 2.51
- GRM
- 4.7
CMA / ARV
- ARV (median comp)
- $98,422
- List price
- $135,000
- Delta
- 37.16%
- Verdict
- OVERPRICED
- Comps
- 3 within 1.0 mi
Show comp detail 2 sales within ~0.75 mi
| Address | Dist | Beds/Ba | Sqft | Sold | Price | $/sf | Match |
|---|---|---|---|---|---|---|---|
| 1225 Taft #3 | 0.00mi | 3/2.0 | 1,782 (+4%) | 3mo | $144,000 | $81 | 91 |
| 1225 Taft Hwy #88 | 0.00mi | 2/2.0 (-1) | 1,638 (-4%) | 24mo | $148,000 | $90 | 68 |
Match score weights: distance 35% · size 25% · config 20% · recency 20%. Top-matched comps best support the ARV.
Projected returns pro-forma
-3.0% appreciation · 5.71% rent growth · sell at horizon
- IRR
- 32.2%
- Equity multiple
- 2.40×
- Total profit
- $52,916
- Equity at exit
- $20,129
- IRR
- 40.6%
- Equity multiple
- 5.31×
- Total profit
- $162,832
- Equity at exit
- $11,672
Cash invested: $37,800 (down + closing). Projections, not guarantees.
Landlord ↔ Tenant lean methodology
- Overall (STATE)
- 18 Strongly Tenant-Friendly
- State California
- 18 Strongly Tenant-Friendly · D+13
- County
- — inherits STATE
- City
- — inherits STATE
ZIP-level market 93307
- Rents YoY
- 5.7%
- Active inventory
- 311
- Price-to-rent
- 4.7×
Monthly cashflow live
- Estimated rent
- $2,402 high interval (Pro) →
- Mortgage (P&I)
- −$708
- Tax from tax record
- −$65 /mo · $776/yr
- Insurance
- −$56
- HOA
- −$0
- Vacancy / Maint / Mgmt
- −$505
- Net cashflow
- $1,069
Break-even live
UW: 25.0% down · 7.5% · 30yr · 1.5% tax · 5.0% vac · 8.0% maint · 8.0% mgmt
Financing live
Cash to close
- Down payment
- $33,750
- Closing costs
- $4,050
- Reserves months
- —
- Total cash needed
- —
Loan-product check · same deal, 3 products live
Conventional
25% down · 7.5% · 30yr
- Down + closing
- —
- Monthly P&I
- —
- Monthly cashflow
- —
- DSCR
- —
- Eligible?
- —
Personal DTI + credit; lowest rate.
DSCR
20% down · 8.5% · 30yr
- Down + closing
- —
- Monthly P&I
- —
- Monthly cashflow
- —
- DSCR
- —
- Eligible?
- —
No personal income docs; deal must DSCR.
Hard money
10% down · 12.0% · 12mo
- Down + closing
- —
- Monthly P&I
- —
- Monthly cashflow
- —
- DSCR
- —
- Eligible?
- —
Short-term bridge; refi at stabilization.
Rent comps 17 comps
| Address | Beds | Baths | Sqft | Rent | $/sqft | DOM | Units | Dist |
|---|---|---|---|---|---|---|---|---|
| 9118 Davedaly Ct Bakersfield, CA | 3.0 | 2.0 | 1700 | $2,300 | $1.35 | 3d | 1 | 0.78mi |
| 2401 Donnalynn St Bakersfield, CA | 4.0 | 2.0 | 2048 | $3,900 | $1.90 | 3d | 1 | 0.78mi |
| 265 Hudson Dr Bakersfield, CA | 4.0 | 2.0 | 1766 | $2,900 | $1.64 | 3d | 1 | 0.79mi |
| 2402 Lebow Ct Bakersfield, CA | 4.0 | 2.0 | 2100 | $2,495 | $1.19 | 44d | 1 | 0.84mi |
| 1408 Interlaken Dr Bakersfield, CA | 3.0 | 2.0 | 1159 | $2,250 | $1.94 | 21d | 1 | 0.87mi |
| 8914 S Union Ave Bakersfield, CA | 3.0 | 2.0 | 1500 | $1,950 | $1.30 | 3d | 1 | 0.88mi |
| 2717 Mercedes Dr Bakersfield, CA | 4.0 | 2.0 | 1900 | $2,600 | $1.37 | 19d | 1 | 1.02mi |
| 8602 Vincenso Way Bakersfield, CA | 3.0 | 2.0 | 1607 | $2,550 | $1.59 | 3d | 1 | 1.13mi |
| 8211 Slider Dr Bakersfield, CA | 4.0 | 2.0 | 2100 | $2,550 | $1.21 | 3d | 1 | 1.14mi |
| 600 Hosking Ave Apt 69A Bakersfield, CA | 3.0 | 2.0 | 1208 | $1,850 | $1.53 | 19d | 1 | 1.19mi |
| 600 Hosking Ave Unit 56A Bakersfield, CA | 3.0 | 2.0 | 1200 | $1,750 | $1.46 | 3d | 1 | 1.19mi |
| 600 Hosking Ave Unit 51D Bakersfield, CA | 3.0 | 2.0 | 1200 | $1,800 | $1.50 | 3d | 1 | 1.19mi |
| 600 Hosking Ave Unit 73D Bakersfield, CA | 3.0 | 2.0 | 1230 | $1,850 | $1.50 | 44d | 1 | 1.19mi |
| 600 Hosking Ave Unit 43B Bakersfield, CA | 2.0 | 1.5 | 1050 | $1,650 | $1.57 | 44d | 1 | 1.19mi |
| 301 Alysheba Dr Bakersfield, CA | 4.0 | 2.5 | 1864 | $2,650 | $1.42 | 10d | 1 | 1.24mi |
| 1305 Quartz Hill Rd Bakersfield, CA | 3.0 | 2.0 | 1351 | $2,250 | $1.67 | 3d | 1 | 1.31mi |
| 3106 Stone Meadows Dr Bakersfield, CA | 4.0 | 3.0 | 2223 | $2,700 | $1.21 | 3d | 1 | 1.38mi |
Listing history 40 events
-
2026-06-18days on market $135,000 Active 245 DOM
-
2026-06-17days on market $135,000 Active 244 DOM
-
2026-06-16days on market $135,000 Active 243 DOM
-
2026-06-15days on market $135,000 Active 242 DOM
-
2026-06-14days on market $135,000 Active 240 DOM
-
2026-06-13days on market $135,000 Active 239 DOM
-
2026-06-10days on market $135,000 Active 237 DOM
-
2026-06-09days on market $135,000 Active 236 DOM
-
2026-06-08days on market $135,000 Active 235 DOM
-
2026-06-07days on market $135,000 Active 234 DOM
-
2026-06-05days on market $135,000 Active 231 DOM
-
2026-06-03days on market $135,000 Active 230 DOM
-
2026-06-03days on market $135,000 Active 229 DOM
-
2026-06-01days on market $135,000 Active 228 DOM
-
2026-05-31days on market $135,000 Active 227 DOM
-
2026-04-18$135,000 Active 819-char remark
Show marketing remark (819 chars)
Spacious and impeccably cared-for, this 3-bedroom, 2-bath manufactured home is located in the sought-after 55+ West Hills Mobile Home Park with easy access to Highway 99. The open floor plan creates a seamless flow between the expansive living area and the stylish kitchen, featuring granite countertops, crisp white cabinetry, and stainless steel appliances. The primary suite is designed for comfort, complete with a soaking tub, walk-in shower, and dual vanities. Step outside to unwind on the covered patio surrounded by mature greenery or enjoy morning coffee on the inviting front porch. With updated flooring, abundant natural light, and well-appointed finishes throughout, this home is truly move-in ready. The community offers a convenient lifestyle, just minutes from shopping, dining, and everyday amenities.
-
2026-04-07price $135,000
-
2026-02-21price $135,000
-
2025-10-16$139,000 Active
-
2025-10-16$139,000 Active
-
2020-03-06price $62,000
-
2020-03-06soldstatus $62,000 Sold
-
2020-02-18status Pending
-
2020-02-18price $63,000
-
2020-01-07$63,000 Active
-
2018-11-05soldstatus $55,000 Sold
-
2018-10-10status Pending
-
2018-10-02status Active
-
2018-10-01historical
-
2018-06-22price $55,000
-
2018-04-06price $61,000
-
2018-01-22$61,900 Active
-
2017-10-17price $62,500
-
2017-07-31price $65,000
-
2015-06-11soldstatus $55,000
-
2015-04-19historical
-
2015-01-02$55,000
-
2012-02-13soldstatus $35,000
-
2012-02-02historical
-
2012-01-14$35,000
ⓘ Source: listings_history table (triggers on properties + properties_extension) + one-shot
backfill from property_details.listing_events for pre-trigger history.
Tax reassessment forecast CA · Resets to sale price
- Current annual tax
- $776 · $65/mo
- Projected year-2 tax
- $1,026 · $86/mo
- Expected delta
- +$250/yr (+$21/mo · 32.2%)
ⓘ Screening estimate from a state-policy table — verify with the county assessor before closing.
Climate risk First Street
- Flood 1/10 Low FEMA zone X (unshaded) · 0% chance over 30 yrs
- Wildfire 1/10 Low
- Heat 8/10 Severe 7 d/yr ≥104°F today · 20 d/yr by 30 yrs out
- Wind 1/10 Low
- Air quality 10/10 Extreme 33 unhealthy d/yr today · 37 by 30 yrs out
Nearby sold comps map
Loading sold comps map…
Walkable amenities ~0.75 mi
Loading nearby amenities…
Taxation est. · year 1
- Rental income
- $28,830
- − Mortgage interest
- −$7,562
- − Property taxes
- −$776
- − Insurance
- −$675
- − Repairs & maintenance
- −$2,306
- − Management
- −$2,306
- − Depreciation
- −$3,927
- Taxable income
- $11,277
- Est. tax owed @ 24.0%
- −$2,706
- After-tax cash flow
- $10,123/yr
For passive investors: Depreciation is non-cash, so a rental often shows a tax loss while cash-flowing — sheltering income. Rental losses are passive: they offset passive income freely, and up to $25,000/yr can offset ordinary (W-2) income if you actively participate and your MAGI is under $100k (phasing out to $0 by $150k); unused losses carry forward. On sale, claimed depreciation is recaptured at up to 25%, and gains may owe capital-gains tax (a 1031 exchange can defer both). Figures are a year-1 estimate at your 24.0% rate — not tax advice; consult a CPA.
Schools (NCES district)
- District
- Kern High
- NCES district ID
- 0619540
- Math proficiency
- 21% ▬ 0.00%
- Reading proficiency
- 51% ▲ 2.00%
- Median HH income
- $49,686
- Composite
- 33.68/100
- National rank
- #10443
- State rank
- #860 of 1400 in CA
Livability — Bakersfield
- Score
- 58/100
- State rank
- #716
- US rank
- #21355
Category grades
Schools grade is shown separately in the Schools card above.
Census & demographics
- Census place
- Bakersfield, CA
- County
- Kern County · 710,371 people
- City population
- 499,124
- Metro
- Bakersfield, CA
- Population (ZIP)
- 85,945
- Household income
- $56,446
- Rent vs Own
- Severe rent burden
- 3246.0
Population outlook (Kern County) Hauer SSP2
- Today (2025)
- 947,286 people
- By 2030
- 978,984 · +3.3%
- By 2040
- 1,045,018 · +10.3%
- By 2050
- 1,105,232 · +16.7%
- By 2075
- 1,229,538 · +29.8%
- By 2100
- 1,238,059 · +30.7%
Race, ethnicity, and origin ACS 2023
- Neighborhood character
- Predominantly Hispanic (80%)
- Race & ethnicity
- Hispanic / Latino 80% Two or more races 12% White 10% Black 6% Asian 3% Native American 1%
- Hispanic origin (detail)
- Mexican 73%
- Common ancestry
- Lithuanian 0%
- Foreign-born
- 31% · Canada
- Languages at home
- 28% English-only · Spanish 69% Other Indo-European 1% Arabic 1%
Political lean MEDSL · Kern
- 2024 margin
- Strong R (+21.1) · D 38.2% · R 59.3% · Other 2.5%
- 2008→2024 swing
- -3.3pp toward R · 2008: -17.8pp · 2024: -21.1pp
- All cycles
- 2024: R+21.1 2020: R+10.2 2016: R+15.0 2012: R+20.9 2008: R+17.8
Not yet ingested
- Civics
- —
Market trends
- HPI YoY
- ▼ -263.59%
- Current HPI
- 447.1746
- Rent YoY
- ▲ 5.71%
- Metro
- Bakersfield, CA
- State GDP YoY
- ▲ 3.21%
- F500 in state
- 116
Industry mix (Fortune 500 HQ in CA)
| Industry | F500 HQs | Revenue |
|---|---|---|
| Technology | 27 | $1,492B |
|
||
| Financial Services | 3 | $174B |
|
||
| Retail | 3 | $44B |
|
||
| Insurance | 3 | $26B |
|
||
| Media / Entertainment | 2 | $115B |
|
||
| Pharmaceuticals / Biotech | 2 | $62B |
|
||
Price history
+285.7% since first listed25 events — show timeline
- 2026-04-18 Listed $135,000 GEMLS
- 2026-04-07 Price Changed $135,000 CRMLS
- 2026-02-21 Price Changed $135,000 GEMLS
- 2025-10-16 Listed $139,000 CRMLS
- 2025-10-16 Listed $139,000 GEMLS
- 2020-03-06 Price Changed $62,000 GEMLS
- 2020-03-06 Sold (MLS) $62,000 GEMLS
- 2020-02-18 Pending — GEMLS
- 2020-02-18 Price Changed $63,000 GEMLS
- 2020-01-07 Listed $63,000 GEMLS
- 2018-11-05 Sold (MLS) $55,000 GEMLS
- 2018-10-10 Pending — GEMLS
- 2018-10-02 Relisted — GEMLS
- 2018-10-01 Delisted — GEMLS
- 2018-06-22 Price Changed $55,000 GEMLS
- 2018-04-06 Price Changed $61,000 GEMLS
- 2018-01-22 Listed $61,900 GEMLS
- 2017-10-17 Price Changed $62,500 GEMLS
- 2017-07-31 Price Changed $65,000 GEMLS
- 2015-06-11 Sold (MLS) $55,000 GEMLS
- 2015-04-19 Delisted — GEMLS
- 2015-01-02 Listed $55,000 GEMLS
- 2012-02-13 Sold (MLS) $35,000 GEMLS
- 2012-02-02 Delisted — GEMLS
- 2012-01-14 Listed $35,000 GEMLS
Property tax history
+4.4%/yrLatest (2025): $776 · +4.9% YoY. Source: county tax records.
Cash-flow waterfall
monthlySold comps — $/sqft
last 12 mo · ≤1 miLoading sold comps…