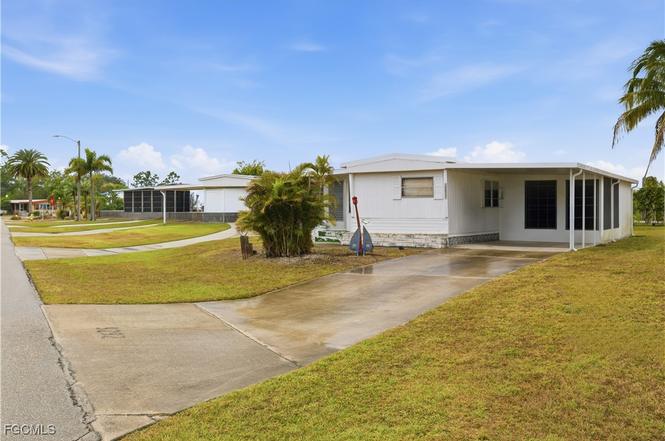
9292 Duke Rd · Bonita Springs, FL
Flood risk 7/10 · Major
- FEMA flood zone
- AE
- Chance of flooding over 30 yrs
- 0.94%
- Est. flood insurance / yr
- $1,737 – $8,500
Fire risk 1/10 · Minimal
- Est. fire insurance / yr
- $947 – $1,759
Heat risk 10/10 · Severe
- Hot days now (above 107°F)
- 7 days/yr
- Hot days in 30 yrs
- 27 days/yr
Wind risk 10/10 · Severe
- Chance of severe wind over 30 yrs
- 99.0%
Air-quality risk 3/10 · Minor
- Unhealthy air days now
- 2 days/yr
- Unhealthy air days in 30 yrs
- 2 days/yr
Risk factors via First Street. Map © Google.
Why this score? — see what drove the B grade
The composite is a weighted blend of 9 inputs, each scored 0–100. Each bar is that input's sub-score; the figure is the points it added to the 100-point composite (weight × sub-score).
- Cash flow +30.0/30.0
- 1% rule +10.0/10.0
- DSCR +10.0/10.0
- ARV discount +10.0/15.0
- Schools +4.1/10.0
- Livability +3.5/5.0
- Condition / age +2.5/5.0
- Rent growth +2.3/5.0
- Appreciation +0.0/10.0
$119,000
🖨 Deal sheet 📄 Offer letter ✓ Due diligence
Listing remarks
Imperial Harbor is an absolute gem of a community in the heart of Bonita Springs. It's deed restricted and over 55, AND has no HOA. Also, please note that this property comes with owning your own land - no lot rent. It affords a very peaceful and affordable lifestyle and is loved by its residents. This home is a little gem, move in ready, and all it needs is for you to make it your own. The home had a new roof in 2024, and although the interior needs some updating and fresh painting, the home is solid, and provides a very affordable entry level for this part of SW Forida. The kitchen has been partially updated with new cabinets, and the Florida room was extended into the rest of the home to
Key facts
- Owning your own land
- Deed restricted
- Screened area
Tags
Property features AI
Finance
- Financial info: Pets allowed
- HOA & community: Community has 678 units; Senior community; Clubhouse; Fitness center; Billiard room / billiards; Street lights
Exterior
- Parking: Covered parking; Attached carport; 1 carport space; Driveway (paved)
- Utilities: Public water; Public sewer; Cable available; Underground utilities
- Home design: Manufactured home; 1 story; Entry level 1; Faces south; Resale property
- Construction: Aluminum siding; Roof over
- Exterior features: Storage; Lanai; Porch; Screened porch; Rectangular lot; Public maintained road; North exposure
Interior
- Kitchen: Range; Refrigerator; Freezer
- Bedrooms: Bedroom on main level
- Flooring: Carpet; Vinyl
- Bathrooms: 1 full bathroom
- Heating & cooling: Central heating (electric); Central air conditioning (electric)
- Interior features: Furnished; Tub with shower; Workshop; Screened porch; Great Room; Other
- Laundry & utility: Washer; Dryer; Laundry in garage
Neighborhood map
What this means for you Summary
Snapshot
- This is a 2-bed/1.0-bath manufactured listed at $119k.
Deal economics
- At list price, monthly cash flow is $334 ($4k/yr) — positive.
- The deal already cash-flows at list — no discount required.
- Meets the 1% rule at list price ($2k rent vs $119k).
- Recommended offer: $105k (12.0% below list) — sets the bar for market timing.
- Cap rate 14.0% vs local median 1.7% in Bonita Springs — top-decile yield for the area; either an underpriced asset or a hidden risk that comps aren't pricing in. Stress-test before assuming the spread holds.
Location & tenants
- Location reads 70/100 on livability (#428 in FL) — a middle-class / working-renter tenant base. Strengths: crime A+, housing A+, employment A; Watch: schools C-, cost of living C-, health & safety D.
- Lee (suburban): math 47% / reading 50% proficiency, ranked #42 of 73 in FL (top 58%) — families likely to look elsewhere, expect single-tenant / working-renter base with shorter leases.
- Market conditions: Rents soft (-0.6%/yr); 835 active listings in the ZIP; 9 comparable units currently listed for rent nearby; rentals at typical pace (median 24d on market — plan ~3-4 weeks tenant-placement turnaround); solid renter incomes; 15,411 units permitted in Lee County in 2024 (4,686 in 5+ unit buildings).
Forward outlook
- Local home prices are declining (-3.0%/yr); year-one equity from $823 of loan paydown is wiped out by about $4k of value loss. Plan a longer hold.
- Lee County population projected at +44% by 2050 — long-run rental-demand tailwind backs the buy-and-hold thesis.
Negotiation context
- It's been on market 135 days — a 12% lower offer ($105k) is reasonable based on typical stale-listing flexibility.
- Current owner paid $39k; list at $119k implies a 205% gain — meaningful room to come down on a strong offer.
Risks & watch-outs
- Watch-outs: flood insurance adds $427/mo.
- Climate carrying-cost: in FEMA flood zone AE (mandatory federal flood insurance); severe wind risk, 99% chance of damaging wind over 30y; extreme-heat days projected 7→27/yr by 2055 (HVAC capex compounding) — expect insurance premiums to compound above CPI over the hold.
Questions for the listing agent
- It's been on market 135 days. Have you received any prior offers? Is the seller open to a 12% concession, seller financing, or rate buy-down credit?
- Built in 1973 — when were the roof, HVAC, electrical panel, plumbing, and water heater last replaced?
- What's the actual annual flood-insurance premium (NFIP or private), and is the property in a SFHA with mandatory coverage?
- Why hasn't it sold? Are there any deal-killer items the seller is aware of (foundation, flood, title, zoning, code violations)?
- Is there a deadline driving the sale (1031 exchange, divorce, estate, relocation)? That informs how much negotiation room exists.
- What's the average days-on-market for RENTAL listings here right now (not sales)? A rising rental-DOM trend means longer vacancies and softer asking-rent achievability than the comps imply.
- What's the recent tenant-quality profile in this submarket — average credit score on applications, eviction rate, late-payment / NSF rate, and stable-employment percentage? A property-management company in the area should have these aggregated.
- How much new for-sale + rental construction is in the pipeline within 1–3 miles? Heavy new supply typically softens prices + rents 12–24 months out; constrained supply supports both.
Investment metrics
- 1% rule
- 1.67% ✓
- Cap rate
- 13.96%
- Cash-on-cash
- 27.38%
- DSCR
- 2.22
- GRM
- 5.0
CMA / ARV
- ARV (on-the-fly)
- $126,000
- Comps found
- 1
Show comp detail 1 sale within ~0.75 mi
| Address | Dist | Beds/Ba | Sqft | Sold | Price | $/sf | Match |
|---|---|---|---|---|---|---|---|
| 26118 Cabana Rd | 0.30mi | 2/1.0 | 480 (-5%) | 17mo | $120,000 | $250 | 64 |
Match score weights: distance 35% · size 25% · config 20% · recency 20%. Top-matched comps best support the ARV.
Projected returns pro-forma
-3.0% appreciation · 0.0% rent growth · sell at horizon
- IRR
- -3.0%
- Equity multiple
- 0.89×
- Total profit
- $-3,570
- Equity at exit
- $17,743
- IRR
- 1.5%
- Equity multiple
- 1.09×
- Total profit
- $2,899
- Equity at exit
- $10,289
Cash invested: $33,320 (down + closing). Projections, not guarantees.
Landlord ↔ Tenant lean methodology
- Overall (STATE)
- 87 Strongly Landlord-Friendly
- State Florida
- 87 Strongly Landlord-Friendly · R+3
- County
- — inherits STATE
- City
- — inherits STATE
ZIP-level market 34135
- Rents YoY
- -0.6%
- Active inventory
- 835
- Price-to-rent
- 5.0×
Monthly cashflow live
- Estimated rent
- $1,988 high interval (Pro) →
- Mortgage (P&I)
- −$624
- Tax from tax record
- −$137 /mo · $1,642/yr
- Insurance
- −$50
- Flood insurance flood zone
- −$427 /mo · $5,118/yr
- HOA
- −$0
- Vacancy / Maint / Mgmt
- −$418
- Net cashflow
- $334
Break-even live
UW: 25.0% down · 7.5% · 30yr · 1.5% tax · 5.0% vac · 8.0% maint · 8.0% mgmt
Financing live
Cash to close
- Down payment
- $29,750
- Closing costs
- $3,570
- Reserves months
- —
- Total cash needed
- —
Loan-product check · same deal, 3 products live
Conventional
25% down · 7.5% · 30yr
- Down + closing
- —
- Monthly P&I
- —
- Monthly cashflow
- —
- DSCR
- —
- Eligible?
- —
Personal DTI + credit; lowest rate.
DSCR
20% down · 8.5% · 30yr
- Down + closing
- —
- Monthly P&I
- —
- Monthly cashflow
- —
- DSCR
- —
- Eligible?
- —
No personal income docs; deal must DSCR.
Hard money
10% down · 12.0% · 12mo
- Down + closing
- —
- Monthly P&I
- —
- Monthly cashflow
- —
- DSCR
- —
- Eligible?
- —
Short-term bridge; refi at stabilization.
Rent comps 9 comps
| Address | Beds | Baths | Sqft | Rent | $/sqft | DOM | Units | Dist |
|---|---|---|---|---|---|---|---|---|
| 8754 River Homes Ln #307 Bonita Springs, FL | 1.0 | 1.0 | 645 | $1,775 | $2.75 | 23d | 1 | 0.99mi |
| 27020 Williams Rd #5 Bonita Springs, FL | 1.0 | 1.0 | 595 | $1,700 | $2.86 | 23d | 1 | 1.01mi |
| 8687 River Homes Ln #4202 Bonita Springs, FL | 1.0 | 1.0 | 602 | $2,500 | $4.15 | 23d | 1 | 1.11mi |
| 8687 River Homes Ln #4207 Bonita Springs, FL | 1.0 | 1.0 | 602 | $1,400 | $2.33 | 23d | 1 | 1.11mi |
| 8920 Colonnades Ct E #514 Bonita Springs, FL | 1.0 | 1.0 | 713 | $1,500 | $2.10 | 23d | 1 | 1.13mi |
| 8617 River Homes Ln #3307 Bonita Springs, FL | 1.0 | 1.0 | 645 | $1,650 | $2.56 | 23d | 1 | 1.18mi |
| 8617 River Homes Ln #3203 Bonita Springs, FL | 1.0 | 1.0 | 699 | $1,500 | $2.15 | 3d | 1 | 1.18mi |
| 10284 Pennsylvania Ave Bonita Springs, FL | 1.0 | 1.0 | 480 | $2,000 | $4.17 | 23d | 1 | 1.42mi |
| 27250 Shriver Ave Unit 1073504P Bonita Springs, FL | 2.0 | 1.0 | 661 | $4,275 | $6.46 | 3d | 2 | 1.46mi |
Listing history 13 events
-
2026-06-17days on market $119,000 Active 135 DOM
-
2026-06-16days on market $119,000 Active 134 DOM
-
2026-06-15days on market $119,000 Active 133 DOM
-
2026-06-13days on market $119,000 Active 131 DOM
-
2026-06-10days on market $119,000 Active 128 DOM
-
2026-06-09days on market $119,000 Active 127 DOM
-
2026-06-07days on market $119,000 Active 125 DOM
-
2026-06-02days on market $119,000 Active 120 DOM
-
2026-06-01days on market $119,000 Active 119 DOM
-
2026-06-01days on market $119,000 Active 118 DOM
-
2026-03-21price $119,000
-
2026-02-02$135,000 Active
-
1992-04-09soldstatus $39,000
ⓘ Source: listings_history table (triggers on properties + properties_extension) + one-shot
backfill from property_details.listing_events for pre-trigger history.
Tax reassessment forecast FL · Resets to sale price
- Current annual tax
- $1,642 · $137/mo
- Projected year-2 tax
- $1,642 · $137/mo
- Expected delta
- $0/yr ($0/mo · 0.0%)
ⓘ Screening estimate from a state-policy table — verify with the county assessor before closing.
Climate risk First Street
- Flood 7/10 Severe FEMA zone AE · 94% chance over 30 yrs
- Wildfire 1/10 Low
- Heat 10/10 Extreme 7 d/yr ≥107°F today · 27 d/yr by 30 yrs out
- Wind 10/10 Extreme 99% chance of damaging wind over 30 yrs
- Air quality 3/10 Moderate 2 unhealthy d/yr today · 2 by 30 yrs out
Nearby sold comps map
Loading sold comps map…
Walkable amenities ~0.75 mi
Loading nearby amenities…
Taxation est. · year 1
- Rental income
- $23,859
- − Mortgage interest
- −$6,666
- − Property taxes
- −$1,642
- − Insurance
- −$5,714
- − Repairs & maintenance
- −$1,909
- − Management
- −$1,909
- − Depreciation
- −$3,462
- Taxable income
- $2,559
- Est. tax owed @ 24.0%
- −$614
- After-tax cash flow
- $3,391/yr
For passive investors: Depreciation is non-cash, so a rental often shows a tax loss while cash-flowing — sheltering income. Rental losses are passive: they offset passive income freely, and up to $25,000/yr can offset ordinary (W-2) income if you actively participate and your MAGI is under $100k (phasing out to $0 by $150k); unused losses carry forward. On sale, claimed depreciation is recaptured at up to 25%, and gains may owe capital-gains tax (a 1031 exchange can defer both). Figures are a year-1 estimate at your 24.0% rate — not tax advice; consult a CPA.
Schools (NCES district)
- District
- Lee
- NCES district ID
- 1201080
- Math proficiency
- 47% ▼ -11.00%
- Reading proficiency
- 50% ▼ -4.00%
- Median HH income
- $49,518
- Composite
- 41.49/100
- National rank
- #3458
- State rank
- #42 of 73 in FL
Livability — Bonita Springs
- Score
- 70/100
- State rank
- #428
- US rank
- #7576
Category grades
Schools grade is shown separately in the Schools card above.
Census & demographics
- Census place
- Bonita Springs, FL
- County
- Lee County · 788,662 people
- City population
- 64,727
- Metro
- Cape Coral-Fort Myers, FL
- Population (ZIP)
- 48,252
- Household income
- $91,380
- Rent vs Own
- Severe rent burden
- 976.0
Population outlook (Lee County) Hauer SSP2
- Today (2025)
- 871,946 people
- By 2030
- 955,468 · +9.6%
- By 2040
- 1,113,587 · +27.7%
- By 2050
- 1,256,891 · +44.1%
- By 2075
- 1,560,270 · +78.9%
- By 2100
- 1,726,848 · +98.0%
Race, ethnicity, and origin ACS 2023
- Neighborhood character
- Predominantly White (69%)
- Race & ethnicity
- White 69% Hispanic / Latino 26% Two or more races 13% Native American 3% Black 2%
- Hispanic origin (detail)
- Mexican 8% Puerto Rican 4% Cuban 3%
- Common ancestry
- Romanian 5% Lithuanian 2% Slovak 2%
- Foreign-born
- 22% · Canada, Jamaica
- Languages at home
- 74% English-only · Spanish 21% French/Haitian/Cajun 1% Russian/Polish/Slavic 1%
Political lean MEDSL · Lee
- 2024 margin
- Strong R (+28.4) · D 35.5% · R 63.9%
- 2008→2024 swing
- -18.0pp toward R · 2008: -10.4pp · 2024: -28.4pp
- All cycles
- 2024: R+28.4 2020: R+19.2 2016: R+20.4 2012: R+16.6 2008: R+10.4
Not yet ingested
- Civics
- —
Market trends
- HPI YoY
- ▼ -188.86%
- Current HPI
- 243.4153
- Rent YoY
- ▼ -0.61%
- Metro
- Cape Coral-Fort Myers, FL
- State GDP YoY
- ▲ 3.28%
- F500 in state
- 36
Industry mix (Fortune 500 HQ in FL)
| Industry | F500 HQs | Revenue |
|---|---|---|
| Industrial Technology | 2 | $29B |
|
||
| Insurance | 2 | $17B |
|
||
| Retail | 1 | $60B |
|
||
| Technology Distribution | 1 | $58B |
|
||
| Homebuilding | 1 | $35B |
|
||
| Technology Manufacturing | 1 | $35B |
|
||
Price history
+205.1% since first listed3 events — show timeline
- 2026-03-21 Price Changed $119,000 FORTMLS
- 2026-02-02 Listed $135,000 FORTMLS
- 1992-04-09 Sold (Public Records) $39,000 Public Records
Property tax history
+7.7%/yrLatest (2025): $1,642 · +4.8% YoY. Source: county tax records.
Cash-flow waterfall
monthlySold comps — $/sqft
last 12 mo · ≤1 miLoading sold comps…