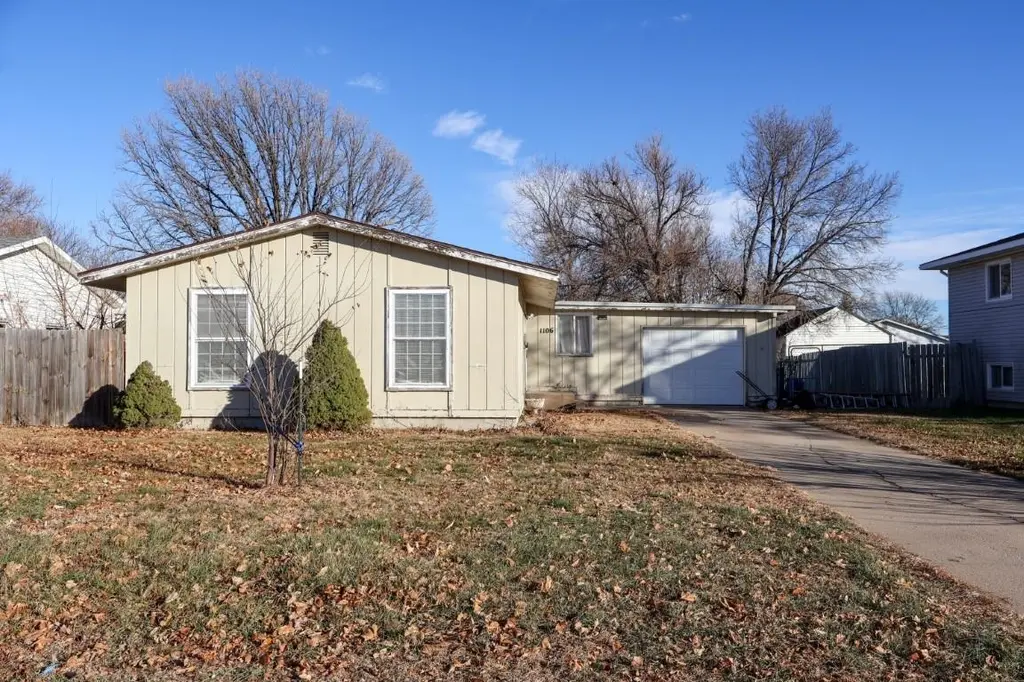
1106 N Pierce St · Lexington, NE
Flood risk 2/10 · Minimal
- FEMA flood zone
- X (shaded)
- Chance of flooding over 30 yrs
- 0.09%
- Est. flood insurance / yr
- $507 – $1,088
Fire risk 1/10 · Minimal
- Est. fire insurance / yr
- $1,161 – $2,155
Heat risk 3/10 · Minor
- Hot days now (above 98°F)
- 7 days/yr
- Hot days in 30 yrs
- 17 days/yr
Wind risk 2/10 · Minimal
- Chance of severe wind over 30 yrs
- —
Air-quality risk 1/10 · Minimal
- Unhealthy air days now
- 0 days/yr
- Unhealthy air days in 30 yrs
- 0 days/yr
Risk factors via First Street. Map © Google.
Why this score? — see what drove the C+ grade
The composite is a weighted blend of 9 inputs, each scored 0–100. Each bar is that input's sub-score; the figure is the points it added to the 100-point composite (weight × sub-score).
- Cash flow +21.7/30.0
- ARV discount +15.0/15.0
- DSCR +6.9/10.0
- 1% rule +5.6/10.0
- Livability +3.7/5.0
- Schools +2.7/10.0
- Rent growth +2.5/5.0
- Condition / age +2.5/5.0
- Appreciation +0.0/10.0
$130,000
🖨 Deal sheet 📄 Offer letter ✓ Due diligence
Listing remarks MLS
Discover the potential in this 3-bedroom, 2-bath ranch-style home located in a quiet, established neighborhood. This spacious single-level layout offers two generous living areas, providing flexibility for relaxing, entertaining, or creating a dedicated home office. While the exterior needs some TLC, the solid floor plan and location make this property an excellent opportunity for buyers looking to add value with updates
Key facts
- Ranch-style home
- Solid floor plan
- 9,198 sq ft lot
Tags
Neighborhood map
What this means for you Summary
Snapshot
- This is a 3-bed/1.5-bath single-family listed at $130k.
Deal economics
- At list price, monthly cash flow is $199 ($2k/yr) — positive.
- The deal already cash-flows at list — no discount required.
- Meets the 1% rule at list price ($1k rent vs $130k).
- Recommended offer: $114k (12.0% below list) — sets the bar for market timing.
- Cap rate 8.1% vs local median 3.6% in Lexington — top-decile yield for the area; either an underpriced asset or a hidden risk that comps aren't pricing in. Stress-test before assuming the spread holds.
Location & tenants
- Location reads 74/100 on livability (#112 in NE, #4,483 nationally) — a middle-class / working-renter tenant base. Strengths: cost of living A+, housing A+, health & safety A+; Watch: employment C-, schools F, amenities F.
- Lexington Public Schools (town): math 31% / reading 31% proficiency, ranked #106 of 111 in NE (top 96%) — families likely to look elsewhere, expect single-tenant / working-renter base with shorter leases; 65% free/reduced lunch — lower-income household profile, screen leases tightly.
- Market conditions: 57 active listings in the ZIP; 1 comparable units currently listed for rent nearby; 61 units permitted in Dawson County in 2024 (36 in 5+ unit buildings).
Forward outlook
- Local home prices are declining (-3.0%/yr); year-one equity from $899 of loan paydown is wiped out by about $4k of value loss. Plan a longer hold.
- Dawson County population projected to shrink 8% by 2050 — rents likely to lag national; underwrite the cash flow, not the appreciation.
Negotiation context
- It's been on market 180 days — a 12% lower offer ($114k) is reasonable based on typical stale-listing flexibility.
Questions for the listing agent
- It's been on market 180 days. Have you received any prior offers? Is the seller open to a 12% concession, seller financing, or rate buy-down credit?
- Built in 1966 — when were the roof, HVAC, electrical panel, plumbing, and water heater last replaced?
- Why hasn't it sold? Are there any deal-killer items the seller is aware of (foundation, flood, title, zoning, code violations)?
- Is there a deadline driving the sale (1031 exchange, divorce, estate, relocation)? That informs how much negotiation room exists.
- Schools are F-rated, which usually means shorter tenancies and higher turnover. Who's the typical renter profile here, and what's been the actual vacancy rate?
- What's the average days-on-market for RENTAL listings here right now (not sales)? A rising rental-DOM trend means longer vacancies and softer asking-rent achievability than the comps imply.
- What's the recent tenant-quality profile in this submarket — average credit score on applications, eviction rate, late-payment / NSF rate, and stable-employment percentage? A property-management company in the area should have these aggregated.
- How much new for-sale + rental construction is in the pipeline within 1–3 miles? Heavy new supply typically softens prices + rents 12–24 months out; constrained supply supports both.
Investment metrics
- 1% rule
- 1.06% ✓
- Cap rate
- 8.13%
- Cash-on-cash
- 6.57%
- DSCR
- 1.29
- GRM
- 7.9
CMA / ARV
- ARV (median comp)
- $192,684
- List price
- $130,000
- Delta
- -32.53%
- Verdict
- UNDERPRICED
- Comps
- 20 within 1.0 mi
Show comp detail 9 sales within ~0.75 mi
| Address | Dist | Beds/Ba | Sqft | Sold | Price | $/sf | Match |
|---|---|---|---|---|---|---|---|
| 1112 N Fillmore St | 0.07mi | 3/2.0 | 1,529 (-5%) | 11mo | $225,000 | $147 | 77 |
| 405 E 12th St | 0.26mi | 3/1.0 | 1,675 (+4%) | 2mo | $66,000 | $39 | 77 |
| 1205 N Pierce St | 0.08mi | 3/1.0 | 1,741 (+8%) | 8mo | $190,000 | $109 | 75 |
| 504 E 5th St | 0.53mi | 3/2.0 | 1,560 (-3%) | 4mo | $150,000 | $96 | 64 |
| 503 N Fillmore St | 0.48mi | 2/2.0 (-1) | 1,624 (+1%) | 11mo | $200,000 | $123 | 60 |
| 1109 E 4th St | 0.59mi | 3/2.0 | 1,524 (-6%) | 13mo | $279,900 | $184 | 51 |
| 1113 E 4th St | 0.59mi | 3/2.0 | 1,524 (-6%) | 16mo | $279,900 | $184 | 48 |
| 509 N Fillmore St | 0.47mi | 2/2.0 (-1) | 1,798 (+12%) | 7mo | $130,000 | $72 | 46 |
| 1302 N Madison St | 0.64mi | 2/2.0 (-1) | 1,380 (-14%) | 5mo | $162,500 | $118 | 35 |
Match score weights: distance 35% · size 25% · config 20% · recency 20%. Top-matched comps best support the ARV.
Projected returns pro-forma
-3.0% appreciation · 3.0% rent growth · sell at horizon
- IRR
- -6.2%
- Equity multiple
- 0.77×
- Total profit
- $-8,359
- Equity at exit
- $19,383
- IRR
- 3.5%
- Equity multiple
- 1.25×
- Total profit
- $9,125
- Equity at exit
- $11,240
Cash invested: $36,400 (down + closing). Projections, not guarantees.
Landlord ↔ Tenant lean methodology
- Overall (STATE)
- 83 Strongly Landlord-Friendly
- State Nebraska
- 83 Strongly Landlord-Friendly · R+13
- County
- — inherits STATE
- City
- — inherits STATE
ZIP-level market 68850
- Home prices YoY
- -29.8%
- Active inventory
- 57
- Price-to-rent
- 7.9×
Monthly cashflow live
- Estimated rent
- $1,377 medium interval (Pro) →
- Mortgage (P&I)
- −$682
- Tax from tax record
- −$153 /mo · $1,835/yr
- Insurance
- −$54
- HOA
- −$0
- Vacancy / Maint / Mgmt
- −$289
- Net cashflow
- $199
Break-even live
UW: 25.0% down · 7.5% · 30yr · 1.5% tax · 5.0% vac · 8.0% maint · 8.0% mgmt
Financing live
Cash to close
- Down payment
- $32,500
- Closing costs
- $3,900
- Reserves months
- —
- Total cash needed
- —
Loan-product check · same deal, 3 products live
Conventional
25% down · 7.5% · 30yr
- Down + closing
- —
- Monthly P&I
- —
- Monthly cashflow
- —
- DSCR
- —
- Eligible?
- —
Personal DTI + credit; lowest rate.
DSCR
20% down · 8.5% · 30yr
- Down + closing
- —
- Monthly P&I
- —
- Monthly cashflow
- —
- DSCR
- —
- Eligible?
- —
No personal income docs; deal must DSCR.
Hard money
10% down · 12.0% · 12mo
- Down + closing
- —
- Monthly P&I
- —
- Monthly cashflow
- —
- DSCR
- —
- Eligible?
- —
Short-term bridge; refi at stabilization.
Rent comps 1 comps
| Address | Beds | Baths | Sqft | Rent | $/sqft | DOM | Units | Dist |
|---|---|---|---|---|---|---|---|---|
| 1002 E 7th St Unit 14-1114 Lexington, NE | 3.0 | 2.0 | 1360 | $768 | $0.56 | 43d | 1 | 0.40mi |
Listing history 13 events
-
2026-06-12statusdays on market $130,000 Pending 180 DOM
-
2026-06-09days on market $130,000 Active 179 DOM
-
2026-06-08days on market $130,000 Active 178 DOM
-
2026-06-07days on market $130,000 Active 177 DOM
-
2026-06-05days on market $130,000 Active 175 DOM
-
2026-06-04pricedays on market $130,000 Active 173 DOM
-
2026-06-02days on market $145,000 Active 172 DOM
-
2026-06-01days on market $145,000 Active 171 DOM
-
2026-05-31days on market $145,000 Active 170 DOM
-
2026-05-31days on market $145,000 Active 169 DOM
-
2026-04-08price $145,000 424-char remark
Show marketing remark (424 chars)
Discover the potential in this 3-bedroom, 2-bath ranch-style home located in a quiet, established neighborhood. This spacious single-level layout offers two generous living areas, providing flexibility for relaxing, entertaining, or creating a dedicated home office. While the exterior needs some TLC, the solid floor plan and location make this property an excellent opportunity for buyers looking to add value with updates
-
2026-02-17price $155,000 424-char remark
Show marketing remark (424 chars)
Discover the potential in this 3-bedroom, 2-bath ranch-style home located in a quiet, established neighborhood. This spacious single-level layout offers two generous living areas, providing flexibility for relaxing, entertaining, or creating a dedicated home office. While the exterior needs some TLC, the solid floor plan and location make this property an excellent opportunity for buyers looking to add value with updates
-
2025-12-11$165,000 Active 424-char remark
Show marketing remark (424 chars)
Discover the potential in this 3-bedroom, 2-bath ranch-style home located in a quiet, established neighborhood. This spacious single-level layout offers two generous living areas, providing flexibility for relaxing, entertaining, or creating a dedicated home office. While the exterior needs some TLC, the solid floor plan and location make this property an excellent opportunity for buyers looking to add value with updates
ⓘ Source: listings_history table (triggers on properties + properties_extension) + one-shot
backfill from property_details.listing_events for pre-trigger history.
Tax reassessment forecast NE · Resets to sale price
- Current annual tax
- $1,835 · $153/mo
- Projected year-2 tax
- $2,249 · $187/mo
- Expected delta
- +$414/yr (+$34/mo · 22.6%)
ⓘ Screening estimate from a state-policy table — verify with the county assessor before closing.
Climate risk First Street
- Flood 2/10 Low FEMA zone X (shaded) · 9% chance over 30 yrs
- Wildfire 1/10 Low
- Heat 3/10 Moderate 7 d/yr ≥98°F today · 17 d/yr by 30 yrs out
- Wind 2/10 Low
- Air quality 1/10 Low 0 unhealthy d/yr today · 0 by 30 yrs out
Nearby sold comps map
Loading sold comps map…
Walkable amenities ~0.75 mi
Loading nearby amenities…
Taxation est. · year 1
- Rental income
- $16,528
- − Mortgage interest
- −$7,282
- − Property taxes
- −$1,835
- − Insurance
- −$650
- − Repairs & maintenance
- −$1,322
- − Management
- −$1,322
- − Depreciation
- −$3,782
- Taxable income
- $335
- Est. tax owed @ 24.0%
- −$80
- After-tax cash flow
- $2,311/yr
For passive investors: Depreciation is non-cash, so a rental often shows a tax loss while cash-flowing — sheltering income. Rental losses are passive: they offset passive income freely, and up to $25,000/yr can offset ordinary (W-2) income if you actively participate and your MAGI is under $100k (phasing out to $0 by $150k); unused losses carry forward. On sale, claimed depreciation is recaptured at up to 25%, and gains may owe capital-gains tax (a 1031 exchange can defer both). Figures are a year-1 estimate at your 24.0% rate — not tax advice; consult a CPA.
Schools (NCES district)
- District
- Lexington Public Schools
- NCES district ID
- 3172810
- Math proficiency
- 31% ▼ -8.00%
- Reading proficiency
- 31% ▼ -7.00%
- Median HH income
- $44,799
- Composite
- 26.54/100
- National rank
- #7195
- State rank
- #106 of 111 in NE
Livability — Lexington
- Score
- 74/100
- State rank
- #112
- US rank
- #4483
Category grades
Schools grade is shown separately in the Schools card above.
Census & demographics
- Census place
- Lexington, NE
- County
- Dawson County · 12,428 people
- City population
- 12,428
- Metro
- Lexington, NE
- Population (ZIP)
- 12,428
- Household income
- $69,238
- Rent vs Own
- Severe rent burden
- 199.0
Population outlook (Dawson County) Hauer SSP2
- Today (2025)
- 23,318 people
- By 2030
- 22,912 · -1.7%
- By 2040
- 22,097 · -5.2%
- By 2050
- 21,358 · -8.4%
- By 2075
- 19,801 · -15.1%
- By 2100
- 17,647 · -24.3%
Race, ethnicity, and origin ACS 2023
- Neighborhood character
- Majority Hispanic (62%)
- Race & ethnicity
- Hispanic / Latino 62% White 23% Two or more races 18% Black 11%
- Hispanic origin (detail)
- Mexican 29% Cuban 2%
- Common ancestry
- Iranian 1%
- Foreign-born
- 39% · Canada
- Languages at home
- 35% English-only · Spanish 56% Arabic 1%
Political lean MEDSL · Dawson
- 2024 margin
- Solid R (+49.6) · D 24.7% · R 74.3%
- 2008→2024 swing
- -11.3pp toward R · 2008: -38.3pp · 2024: -49.6pp
- All cycles
- 2024: R+49.6 2020: R+43.8 2016: R+45.0 2012: R+41.8 2008: R+38.3
Not yet ingested
- Civics
- —
Market trends
- HPI YoY
- ▼ -98.28%
- Current HPI
- 231.9947
- Rent YoY
- —
- Metro
- Lexington, NE
- State GDP YoY
- ▲ 0.68%
- F500 in state
- 2
Industry mix (Fortune 500 HQ in NE)
| Industry | F500 HQs | Revenue |
|---|---|---|
| Conglomerate | 1 | $371B |
|
||
Price history
-12.1% since first listed3 events — show timeline
- 2026-04-08 Price Changed $145,000 GMNMLS
- 2026-02-17 Price Changed $155,000 GMNMLS
- 2025-12-11 Listed $165,000 GMNMLS
Property tax history
-0.1%/yrLatest (2025): $1,835 · +0.6% YoY. Source: county tax records.
Cash-flow waterfall
monthlySold comps — $/sqft
last 12 mo · ≤1 miLoading sold comps…