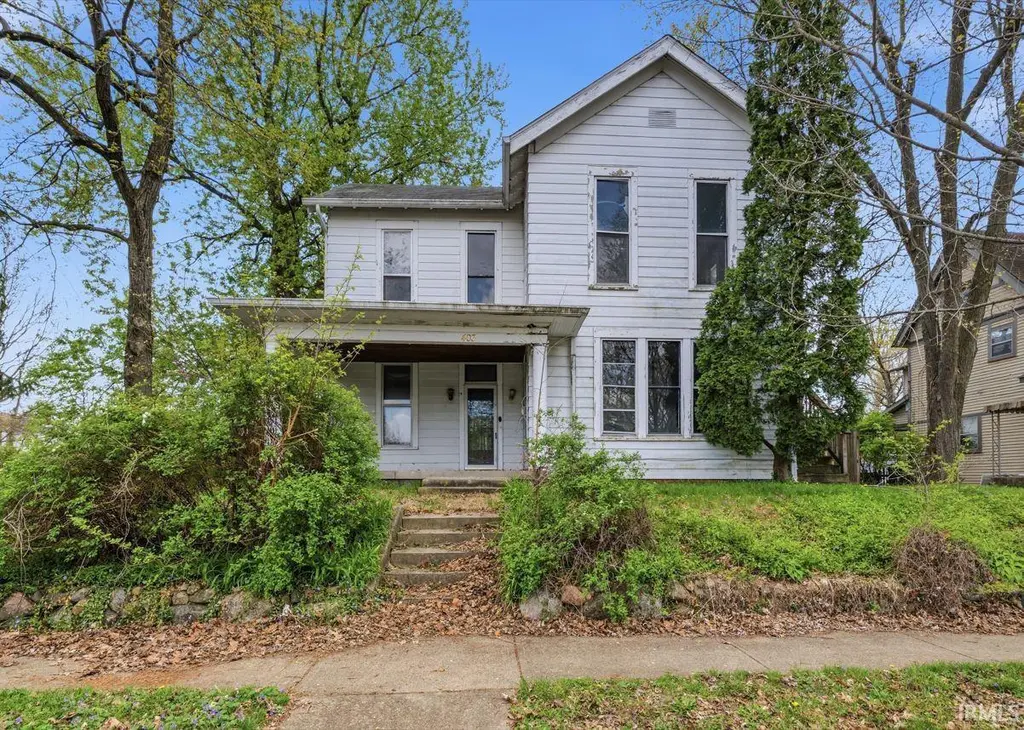
403 W North St · Greenfield, IN
Flood risk 1/10 · Minimal
- FEMA flood zone
- X (unshaded)
- Chance of flooding over 30 yrs
- 0.0%
- Est. flood insurance / yr
- $473 – $860
Fire risk 1/10 · Minimal
- Est. fire insurance / yr
- $717 – $1,331
Heat risk 3/10 · Minor
- Hot days now (above 102°F)
- 7 days/yr
- Hot days in 30 yrs
- 18 days/yr
Wind risk 2/10 · Minimal
- Chance of severe wind over 30 yrs
- 1.0%
Air-quality risk 2/10 · Minimal
- Unhealthy air days now
- 1 days/yr
- Unhealthy air days in 30 yrs
- 2 days/yr
Risk factors via First Street. Map © Google.
Why this score? — see what drove the C+ grade
The composite is a weighted blend of 9 inputs, each scored 0–100. Each bar is that input's sub-score; the figure is the points it added to the 100-point composite (weight × sub-score).
- Cash flow +20.0/30.0
- ARV discount +15.0/15.0
- DSCR +6.3/10.0
- 1% rule +5.8/10.0
- Schools +4.0/10.0
- Livability +3.7/5.0
- Rent growth +3.2/5.0
- Condition / age +2.5/5.0
- Appreciation +0.0/10.0
$220,000
🖨 Deal sheet 📄 Offer letter ✓ Due diligence
Listing remarks MLS
Opportunities like this don't come around often-this spacious traditional home offers flexibility, character, and room to grow. From the moment you step inside, you'll notice the generous layout and the potential for multi-generational living or added income. Whether you're looking for space, versatility, or a smart investment, this property is worth a closer look. Built in 1938, this two-level home offers 3,128 square feet of living space with aluminum siding and classic wood windows that add to its timeless appeal. Currently set up with two kitchens-one on the main level and one upstairs-the layout opens the door to a possible duplex configuration or extended living arrangement. The main level features 2 bedrooms and 2 full baths, while the upper level offers 2 additional bedrooms, 2 full baths, and the potential for a 5th bedroom. A 2-car detached garage adds convenience, making this a unique property with endless possibilities.
Key facts
- 0.23 acre lot
- 2 garage spots
- Built 1938
Neighborhood map
What this means for you Summary
Snapshot
- This is a 4-bed/4.0-bath single-family listed at $220k.
Deal economics
- At list price, monthly cash flow is $269 ($3k/yr) — positive.
- The deal already cash-flows at list — no discount required.
- Meets the 1% rule at list price ($2k rent vs $220k).
- Cap rate 7.8% vs local median 4.4% in Greenfield — top-decile yield for the area; either an underpriced asset or a hidden risk that comps aren't pricing in. Stress-test before assuming the spread holds.
Location & tenants
- Location reads 73/100 on livability (#88 in IN) — a middle-class / working-renter tenant base. Strengths: cost of living A+, housing A+; Watch: amenities F, commute F.
- Greenfield-Central Community Schools (other): math 47% / reading 45% proficiency, ranked #83 of 301 in IN (top 28%) — families likely to look elsewhere, expect single-tenant / working-renter base with shorter leases.
- Zoned schools: Greenfield-Central High School (math 37% / reading 65%, grade D+, #115 of 369 statewide, top 31%, 1,462 students, 35% FRL).
- Market conditions: Rents rising (+2.9%/yr); 481 active listings in the ZIP; 2 comparable units currently listed for rent nearby; solid renter incomes; 1,091 units permitted in Hancock County in 2024 (0 in 5+ unit buildings).
- This rent runs 34% of the median local income ($83k/yr) — at the standard rent-burdened threshold; future hikes will face affordability resistance.
Forward outlook
- Local home prices are declining (-3.0%/yr); year-one equity from $2k of loan paydown is wiped out by about $7k of value loss. Plan a longer hold.
- Hancock County population projected at +7% by 2050 — modest demand growth; plan on rents tracking national, not racing it.
Negotiation context
- Only 11 days on market — expect competitive offers; lowballing is unlikely to land.
- 4 sale attempts since 24y ago with the ask held roughly flat each time — persistent listings suggest the price (not the market) is what's stuck; bring a comps-based counter.
- Current owner paid $155k; 42% above their basis — modest negotiation headroom, anchor on the comps not their cost.
Risks & watch-outs
- Watch-outs: built in 1938 — expect roof / HVAC / electrical / plumbing capex.
Questions for the listing agent
- Built in 1938 — when were the roof, HVAC, electrical panel, plumbing, and water heater last replaced?
- Is there a deadline driving the sale (1031 exchange, divorce, estate, relocation)? That informs how much negotiation room exists.
- Schools are B-rated — typically a magnet for longer-tenancy family renters. What's the average tenant stay here, and is there a school-zone premium baked into asking?
- What's the average days-on-market for RENTAL listings here right now (not sales)? A rising rental-DOM trend means longer vacancies and softer asking-rent achievability than the comps imply.
- What's the recent tenant-quality profile in this submarket — average credit score on applications, eviction rate, late-payment / NSF rate, and stable-employment percentage? A property-management company in the area should have these aggregated.
- How much new for-sale + rental construction is in the pipeline within 1–3 miles? Heavy new supply typically softens prices + rents 12–24 months out; constrained supply supports both.
Investment metrics
- 1% rule
- 1.08% ✓
- Cap rate
- 7.76%
- Cash-on-cash
- 5.23%
- DSCR
- 1.23
- GRM
- 7.7
CMA / ARV
- ARV (on-the-fly)
- $319,056
- Comps found
- 12
Show comp detail 12 sales within ~0.75 mi
| Address | Dist | Beds/Ba | Sqft | Sold | Price | $/sf | Match |
|---|---|---|---|---|---|---|---|
| 265 Riley Rae Way | 0.18mi | 5/3.5 (+1) | 3,054 (-2%) | 1mo | $385,000 | $126 | 80 |
| 403 W North St | 0.00mi | 4/4.0 | 3,519 (+12%) | 1mo | $204,000 | $58 | 78 |
| 252 Walnut St | 0.12mi | 4/2.0 | 3,226 (+3%) | 20mo | $299,900 | $93 | 64 |
| 273 Riley Rae Way | 0.18mi | 5/3.0 (+1) | 2,736 (-12%) | 1mo | $370,000 | $135 | 61 |
| 535 Reed Ct | 0.50mi | 4/2.5 | 3,084 (-1%) | 16mo | $315,000 | $102 | 55 |
| 830 W Main St | 0.29mi | 4/2.0 | 2,974 (-5%) | 22mo | $187,500 | $63 | 52 |
| 919 W Main St | 0.45mi | 5/2.0 (+1) | 3,192 (+2%) | 17mo | $308,000 | $96 | 49 |
| 22 School St | 0.08mi | 4/2.0 | 2,699 (-14%) | 23mo | $225,000 | $83 | 46 |
| 784 Center St | 0.66mi | 4/2.5 | 2,825 (-10%) | 2mo | $387,318 | $137 | 45 |
| 32 Douglas St | 0.46mi | 3/2.5 (-1) | 2,730 (-13%) | 6mo | $345,000 | $126 | 41 |
| 710 N Spring St | 0.66mi | 4/2.5 | 3,426 (+10%) | 11mo | $385,000 | $112 | 38 |
| 522 Pratt St | 0.73mi | 3/1.5 (-1) | 2,776 (-11%) | 17mo | $258,000 | $93 | 18 |
Match score weights: distance 35% · size 25% · config 20% · recency 20%. Top-matched comps best support the ARV.
Projected returns pro-forma
-3.0% appreciation · 2.88% rent growth · sell at horizon
- IRR
- -8.3%
- Equity multiple
- 0.70×
- Total profit
- $-18,733
- Equity at exit
- $32,803
- IRR
- 1.1%
- Equity multiple
- 1.08×
- Total profit
- $4,925
- Equity at exit
- $19,022
Cash invested: $61,600 (down + closing). Projections, not guarantees.
Landlord ↔ Tenant lean methodology
- Overall (STATE)
- 90 Strongly Landlord-Friendly
- State Indiana
- 90 Strongly Landlord-Friendly · R+11
- County
- — inherits STATE
- City
- — inherits STATE
ZIP-level market 46140
- Rents YoY
- 2.9%
- Active inventory
- 481
- Price-to-rent
- 7.7×
Monthly cashflow live
- Estimated rent
- $2,385 medium interval (Pro) →
- Mortgage (P&I)
- −$1,154
- Tax from tax record
- −$370 /mo · $4,441/yr
- Insurance
- −$92
- HOA
- −$0
- Vacancy / Maint / Mgmt
- −$501
- Net cashflow
- $269
Break-even live
UW: 25.0% down · 7.5% · 30yr · 1.5% tax · 5.0% vac · 8.0% maint · 8.0% mgmt
Financing live
Cash to close
- Down payment
- $55,000
- Closing costs
- $6,600
- Reserves months
- —
- Total cash needed
- —
Loan-product check · same deal, 3 products live
Conventional
25% down · 7.5% · 30yr
- Down + closing
- —
- Monthly P&I
- —
- Monthly cashflow
- —
- DSCR
- —
- Eligible?
- —
Personal DTI + credit; lowest rate.
DSCR
20% down · 8.5% · 30yr
- Down + closing
- —
- Monthly P&I
- —
- Monthly cashflow
- —
- DSCR
- —
- Eligible?
- —
No personal income docs; deal must DSCR.
Hard money
10% down · 12.0% · 12mo
- Down + closing
- —
- Monthly P&I
- —
- Monthly cashflow
- —
- DSCR
- —
- Eligible?
- —
Short-term bridge; refi at stabilization.
Rent comps 2 comps
| Address | Beds | Baths | Sqft | Rent | $/sqft | DOM | Units | Dist |
|---|---|---|---|---|---|---|---|---|
| 683 Horsetail Dr Greenfield, IN | 5.0 | 3.0 | 2600 | $2,379 | $0.92 | 14d | 1 | 0.60mi |
| 968 Lotus Dr Greenfield, IN | 3.0–5.0 | 2.0–3.0 | 2049 | $2,245 | $1.10 | 1d | 8 | 0.74mi |
Listing history 9 events
-
2026-04-28status Pending
Show marketing remark (945 chars)
Opportunities like this don't come around often-this spacious traditional home offers flexibility, character, and room to grow. From the moment you step inside, you'll notice the generous layout and the potential for multi-generational living or added income. Whether you're looking for space, versatility, or a smart investment, this property is worth a closer look. Built in 1938, this two-level home offers 3,128 square feet of living space with aluminum siding and classic wood windows that add to its timeless appeal. Currently set up with two kitchens-one on the main level and one upstairs-the layout opens the door to a possible duplex configuration or extended living arrangement. The main level features 2 bedrooms and 2 full baths, while the upper level offers 2 additional bedrooms, 2 full baths, and the potential for a 5th bedroom. A 2-car detached garage adds convenience, making this a unique property with endless possibilities.
-
2026-04-28status Pending 945-char remark
Show marketing remark (945 chars)
Opportunities like this don't come around often-this spacious traditional home offers flexibility, character, and room to grow. From the moment you step inside, you'll notice the generous layout and the potential for multi-generational living or added income. Whether you're looking for space, versatility, or a smart investment, this property is worth a closer look. Built in 1938, this two-level home offers 3,128 square feet of living space with aluminum siding and classic wood windows that add to its timeless appeal. Currently set up with two kitchens-one on the main level and one upstairs-the layout opens the door to a possible duplex configuration or extended living arrangement. The main level features 2 bedrooms and 2 full baths, while the upper level offers 2 additional bedrooms, 2 full baths, and the potential for a 5th bedroom. A 2-car detached garage adds convenience, making this a unique property with endless possibilities.
-
2026-04-22$220,000 Active 945-char remark
Show marketing remark (945 chars)
Opportunities like this don't come around often-this spacious traditional home offers flexibility, character, and room to grow. From the moment you step inside, you'll notice the generous layout and the potential for multi-generational living or added income. Whether you're looking for space, versatility, or a smart investment, this property is worth a closer look. Built in 1938, this two-level home offers 3,128 square feet of living space with aluminum siding and classic wood windows that add to its timeless appeal. Currently set up with two kitchens-one on the main level and one upstairs-the layout opens the door to a possible duplex configuration or extended living arrangement. The main level features 2 bedrooms and 2 full baths, while the upper level offers 2 additional bedrooms, 2 full baths, and the potential for a 5th bedroom. A 2-car detached garage adds convenience, making this a unique property with endless possibilities.
-
2026-04-17$220,000 Active
-
2006-03-24soldstatus $155,000 368-char remark
Show marketing remark (368 chars)
Restored 2 story in very nice established area of older homes. Home has 2 high-efficency gas furnaces. Kitchen updated and has Butler Pantry and Jennaire Grill, smooth top range. Hardwood floors, leaded glass, Lg cove red porches up and down, 2-C det garage and built-in walnut bookcases in the Library/Den. Lots of room to spread out in this very nice family home.
-
2006-02-15$159,900 368-char remark
Show marketing remark (368 chars)
Restored 2 story in very nice established area of older homes. Home has 2 high-efficency gas furnaces. Kitchen updated and has Butler Pantry and Jennaire Grill, smooth top range. Hardwood floors, leaded glass, Lg cove red porches up and down, 2-C det garage and built-in walnut bookcases in the Library/Den. Lots of room to spread out in this very nice family home.
-
2004-02-03soldstatus $151,500
-
2004-02-03soldstatus $151,500
-
2002-08-06$158,900
ⓘ Source: listings_history table (triggers on properties + properties_extension) + one-shot
backfill from property_details.listing_events for pre-trigger history.
Tax reassessment forecast IN · Partial reset (capped growth)
- Current annual tax
- $4,441 · $370/mo
- Projected year-2 tax
- $4,441 · $370/mo
- Expected delta
- $0/yr ($0/mo · 0.0%)
ⓘ Screening estimate from a state-policy table — verify with the county assessor before closing.
Climate risk First Street
- Flood 1/10 Low FEMA zone X (unshaded) · 0% chance over 30 yrs
- Wildfire 1/10 Low
- Heat 3/10 Moderate 7 d/yr ≥102°F today · 18 d/yr by 30 yrs out
- Wind 2/10 Low 100% chance of damaging wind over 30 yrs
- Air quality 2/10 Low 1 unhealthy d/yr today · 2 by 30 yrs out
Nearby sold comps map
Loading sold comps map…
Walkable amenities ~0.75 mi
Loading nearby amenities…
Taxation est. · year 1
- Rental income
- $28,620
- − Mortgage interest
- −$12,323
- − Property taxes
- −$4,441
- − Insurance
- −$1,100
- − Repairs & maintenance
- −$2,290
- − Management
- −$2,290
- − Depreciation
- −$6,400
- Taxable loss
- −$224
- Est. tax savings @ 24.0%
- +$54
- After-tax cash flow
- $3,277/yr
For passive investors: Depreciation is non-cash, so a rental often shows a tax loss while cash-flowing — sheltering income. Rental losses are passive: they offset passive income freely, and up to $25,000/yr can offset ordinary (W-2) income if you actively participate and your MAGI is under $100k (phasing out to $0 by $150k); unused losses carry forward. On sale, claimed depreciation is recaptured at up to 25%, and gains may owe capital-gains tax (a 1031 exchange can defer both). Figures are a year-1 estimate at your 24.0% rate — not tax advice; consult a CPA.
Schools (NCES district)
- District
- Greenfield-Central Community Schools
- NCES district ID
- 1804050
- Math proficiency
- 47% ▼ -12.00%
- Reading proficiency
- 45% ▼ -11.00%
- Median HH income
- $55,533
- Composite
- 40.01/100
- National rank
- #3827
- State rank
- #83 of 301 in IN
Livability — Greenfield
- Score
- 73/100
- State rank
- #88
- US rank
- #5094
Category grades
Schools grade is shown separately in the Schools card above.
Census & demographics
- Census place
- Greenfield, IN
- County
- Hancock County · 59,521 people
- City population
- 43,511
- Metro
- Indianapolis-Carmel-Anderson, IN
- Population (ZIP)
- 43,511
- Household income
- $83,056
- Rent vs Own
- Severe rent burden
- 795.0
Population outlook (Hancock County) Hauer SSP2
- Today (2025)
- 77,820 people
- By 2030
- 79,914 · +2.7%
- By 2040
- 82,734 · +6.3%
- By 2050
- 83,348 · +7.1%
- By 2075
- 82,439 · +5.9%
- By 2100
- 74,181 · -4.7%
Race, ethnicity, and origin ACS 2023
- Neighborhood character
- Predominantly White (92%)
- Race & ethnicity
- White 92% Two or more races 5% Hispanic / Latino 3% Black 1%
- Common ancestry
- Italian 3% Lithuanian 3% Slovak 1%
- Foreign-born
- 3% · Canada
- Languages at home
- 96% English-only · Spanish 2% Other Indo-European 1%
Political lean MEDSL · Hancock
- 2024 margin
- Solid R (+33.7) · D 32.2% · R 65.9% · Other 1.9%
- 2008→2024 swing
- -4.1pp toward R · 2008: -29.6pp · 2024: -33.7pp
- All cycles
- 2024: R+33.7 2020: R+37.5 2016: R+44.8 2012: R+41.0 2008: R+29.6
Not yet ingested
- Civics
- —
Market trends
- HPI YoY
- ▼ -131.67%
- Current HPI
- 225.0367
- Rent YoY
- ▲ 2.88%
- Metro
- Indianapolis-Carmel-Anderson, IN
- State GDP YoY
- ▲ 2.90%
- F500 in state
- 18
Industry mix (Fortune 500 HQ in IN)
| Industry | F500 HQs | Revenue |
|---|---|---|
| Industrial Machinery | 2 | $37B |
|
||
| Healthcare | 1 | $177B |
|
||
| Pharmaceuticals | 1 | $45B |
|
||
| Metals / Steel | 1 | $18B |
|
||
| Agriculture | 1 | $17B |
|
||
| Packaging | 1 | $12B |
|
||
Price history
+38.5% since first listed9 events — show timeline
- 2026-04-28 Pending — MIBOR as Distributed by MLS Grid
- 2026-04-28 Pending — IRMLS
- 2026-04-22 Listed $220,000 IRMLS
- 2026-04-17 Listed $220,000 MIBOR as Distributed by MLS Grid
- 2006-03-24 Sold (MLS) $155,000 MIBOR as Distributed by MLS Grid
- 2006-02-15 Listed $159,900 MIBOR as Distributed by MLS Grid
- 2004-02-03 Sold (Public Records) $151,500 Public Records
- 2004-02-03 Sold (MLS) $151,500 MIBOR as Distributed by MLS Grid
- 2002-08-06 Listed $158,900 MIBOR as Distributed by MLS Grid
Property tax history
+3.9%/yrLatest (2025): $4,441 · +101.2% YoY. Source: county tax records.
Cash-flow waterfall
monthlySold comps — $/sqft
last 12 mo · ≤1 miLoading sold comps…