 Multi-family
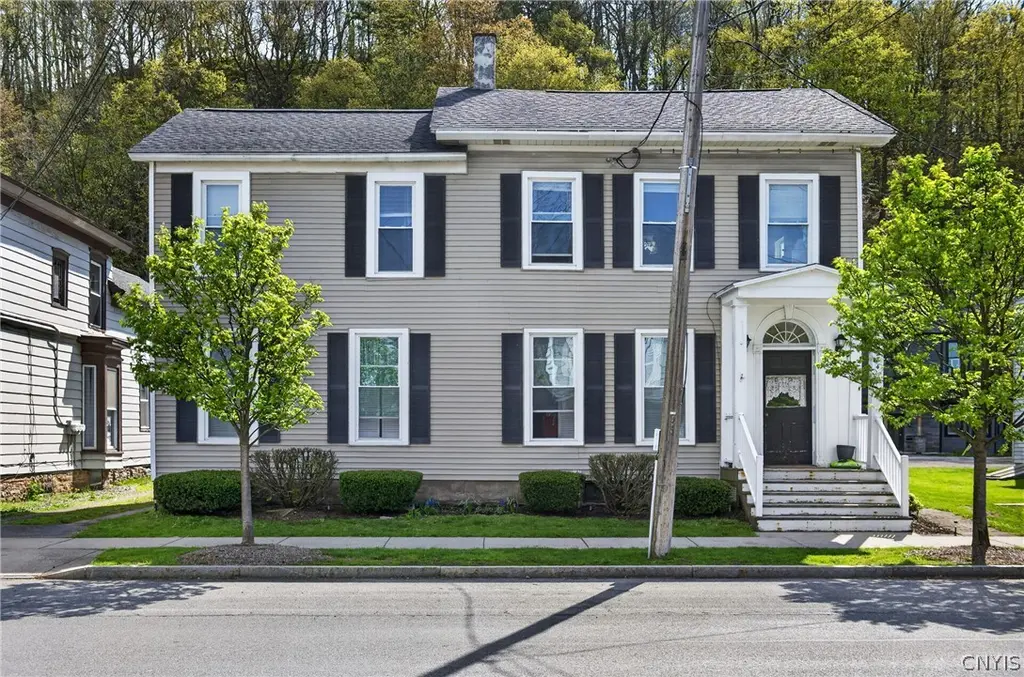
284 Genesee St · Chittenango, NY
Flood risk 4/10 · Minor
- FEMA flood zone
- X
- Chance of flooding over 30 yrs
- 0.22%
- Est. flood insurance / yr
- $473 – $860
Fire risk 1/10 · Minimal
- Est. fire insurance / yr
- $691 – $1,283
Heat risk 3/10 · Minor
- Hot days now (above 94°F)
- 7 days/yr
- Hot days in 30 yrs
- 17 days/yr
Wind risk 1/10 · Minimal
- Chance of severe wind over 30 yrs
- 0.0%
Air-quality risk 2/10 · Minimal
- Unhealthy air days now
- 0 days/yr
- Unhealthy air days in 30 yrs
- 1 days/yr
Risk factors via First Street. Map © Google.
Why this score? — see what drove the B grade
The composite is a weighted blend of 9 inputs, each scored 0–100. Each bar is that input's sub-score; the figure is the points it added to the 100-point composite (weight × sub-score).
- Cash flow +30.0/30.0
- 1% rule +10.0/10.0
- DSCR +10.0/10.0
- ARV discount +8.5/15.0
- Schools +5.4/10.0
- Livability +3.7/5.0
- Rent growth +2.5/5.0
- Condition / age +2.5/5.0
- Appreciation +0.0/10.0
$294,000
🖨 Deal sheet 📄 Offer letter ✓ Due diligence
Multi-family units
County records classify this as Multi-Family (2-4 Unit). Listing-text estimate: 1 unit. estimate disagrees with records
Listing remarks
e ready to be impressed by this charming and well-cared-for three-unit multifamily located in the desirable Village of Chittenango. Just steps away from local shops, dining, and the character this village is known for, this property blends convenience with long-term investment potential. Thoughtful updates throughout the property include new front windows that enhance curb appeal, improved insulation for efficiency, new gutters, and select updated appliances. Apartment one showcases new flooring, with additional updates including fresh carpeting in portions of the home. Tenants will appreciate the convenience of a coin-operated laundry area on the second floor, offering both ease of use and
Key facts
- New flooring
- Improved insulation
- New gutters
Tags
Property features AI
Finance
- Financial info: Three total rental units with separate gas meters for each unit; Four separate electric meters; Owner pays water; rent includes water; Operating expenses include insurance (see remarks)
Exterior
- Parking: Gravel parking; Two or more parking spaces
- Utilities: Public water connected; Sewer connected; High-speed internet available; Circuit breaker electrical service
- Home design: Two-story multi-unit property; Existing/resale condition
- Construction: Vinyl siding; Spray foam insulation; Copper plumbing; Stone foundation; Asphalt shingle roof
- Exterior features: Rectangular lot with 66 x 112 dimensions; Main thoroughfare road frontage; Business zoning
Interior
- Kitchen: Oven/range in each unit; Refrigerator in each unit; Eat-in kitchens
- Bedrooms: Two 2-bedroom units; One 1-bedroom unit
- Flooring: Carpet; Laminate; Varied flooring types
- Bathrooms: Three full bathrooms (one per unit)
- Heating & cooling: Gas forced-air heating
- Interior features: Ceiling fans; Drapes and window treatments
- Laundry & utility: Washer and dryer included in one unit; Gas water heater
Neighborhood map
What this means for you Summary
Snapshot
- This is a 3-bed/3.0-bath multifamily listed at $294k.
Deal economics
- At list price, monthly cash flow is $3k ($36k/yr) — positive.
- The deal already cash-flows at list — no discount required.
- Meets the 1% rule at list price ($6k rent vs $294k).
- Recommended offer: $285k (3.0% below list) — sets the bar for market timing.
- Cap rate 18.6% vs local median 4.2% in Chittenango — top-decile yield for the area; either an underpriced asset or a hidden risk that comps aren't pricing in. Stress-test before assuming the spread holds.
Location & tenants
- Location reads 74/100 on livability (#296 in NY, #4,790 nationally) — a middle-class / working-renter tenant base. Strengths: housing A+, employment A, cost of living A; Watch: amenities F, commute F.
- Chittenango Central School District (rural): math 61% / reading 64% proficiency, ranked #192 of 590 in NY (top 32%) — acceptable for families but not a draw, mixed tenant base, ~2y average lease.
- Market conditions: 73 active listings in the ZIP; 137 units permitted in Madison County in 2024 (46 in 5+ unit buildings).
Forward outlook
- Local home prices are declining (-3.0%/yr); year-one equity from $2k of loan paydown is wiped out by about $9k of value loss. Plan a longer hold.
- Madison County population projected at -24% by 2050 — secular population decline; favor cash flow + early exit over multi-decade hold.
- At projected returns (-3.0% appreciation + 3.0% rent growth), your $82k cash investment doubles in ~3 years — after that, you're playing with house money.
Negotiation context
- It's been on market 52 days — a 3% lower offer ($285k) is reasonable based on typical stale-listing flexibility.
- Current owner paid $140k; list at $294k implies a 110% gain — meaningful room to come down on a strong offer.
Risks & watch-outs
- Watch-outs: built in 1865 — expect roof / HVAC / electrical / plumbing capex.
Questions for the listing agent
- It's been on market 52 days. Have you received any prior offers? Is the seller open to a 3% concession, seller financing, or rate buy-down credit?
- Built in 1865 — when were the roof, HVAC, electrical panel, plumbing, and water heater last replaced?
- Is there a deadline driving the sale (1031 exchange, divorce, estate, relocation)? That informs how much negotiation room exists.
- Schools are A-rated — typically a magnet for longer-tenancy family renters. What's the average tenant stay here, and is there a school-zone premium baked into asking?
- What's the average days-on-market for RENTAL listings here right now (not sales)? A rising rental-DOM trend means longer vacancies and softer asking-rent achievability than the comps imply.
- What's the recent tenant-quality profile in this submarket — average credit score on applications, eviction rate, late-payment / NSF rate, and stable-employment percentage? A property-management company in the area should have these aggregated.
- How much new apartment / multifamily construction is in the pipeline within 1–3 miles? Heavy new supply (>2% of stock underway) typically softens rents 12–24 months out; light construction supports rent growth.
Investment metrics
- 1% rule
- 2.18% ✓
- Cap rate
- 18.56%
- Cash-on-cash
- 43.80%
- DSCR
- 2.95
- GRM
- 3.8
CMA / ARV
- ARV (median comp)
- $300,926
- List price
- $294,000
- Delta
- -2.30%
- Verdict
- FAIR
- Comps
- 4 within 1.0 mi
Projected returns pro-forma
-3.0% appreciation · 3.0% rent growth · sell at horizon
- IRR
- 40.7%
- Equity multiple
- 2.75×
- Total profit
- $143,840
- Equity at exit
- $43,836
- IRR
- 47.0%
- Equity multiple
- 5.52×
- Total profit
- $372,115
- Equity at exit
- $25,420
Cash invested: $82,320 (down + closing). Projections, not guarantees.
Landlord ↔ Tenant lean methodology
- Overall (STATE)
- 15 Strongly Tenant-Friendly
- State New York
- 15 Strongly Tenant-Friendly · D+10
- County
- — inherits STATE
- City
- — inherits STATE
ZIP-level market 13037
- Home prices YoY
- -17.1%
- Active inventory
- 73
- Price-to-rent
- 11.5×
Monthly cashflow live
- Estimated rent
- $6,399 medium interval (Pro) →
- Mortgage (P&I)
- −$1,542
- Tax from tax record
- −$386 /mo · $4,635/yr
- Insurance
- −$122
- HOA
- −$0
- Vacancy / Maint / Mgmt
- −$1,344
- Net cashflow
- $3,005
Break-even live
3-unit breakdown (identical units grouped — click to expand)
| Units | Beds | Baths | Est. rent |
|---|---|---|---|
| 3× units | 2 | 1 | $6,399 |
| #1 | 2 | 1 | $2,133 |
| #2 | 2 | 1 | $2,133 |
| #3 | 2 | 1 | $2,133 |
| Total (3 units) | $6,399 | ||
UW: 25.0% down · 7.5% · 30yr · 1.5% tax · 5.0% vac · 8.0% maint · 8.0% mgmt
Financing live
Cash to close
- Down payment
- $73,500
- Closing costs
- $8,820
- Reserves months
- —
- Total cash needed
- —
Loan-product check · same deal, 3 products live
Conventional
25% down · 7.5% · 30yr
- Down + closing
- —
- Monthly P&I
- —
- Monthly cashflow
- —
- DSCR
- —
- Eligible?
- —
Personal DTI + credit; lowest rate.
DSCR
20% down · 8.5% · 30yr
- Down + closing
- —
- Monthly P&I
- —
- Monthly cashflow
- —
- DSCR
- —
- Eligible?
- —
No personal income docs; deal must DSCR.
Hard money
10% down · 12.0% · 12mo
- Down + closing
- —
- Monthly P&I
- —
- Monthly cashflow
- —
- DSCR
- —
- Eligible?
- —
Short-term bridge; refi at stabilization.
Listing history 17 events
-
2026-06-18days on market $294,000 Active 52 DOM
-
2026-06-17days on market $294,000 Active 51 DOM
-
2026-06-16days on market $294,000 Active 50 DOM
-
2026-06-15days on market $294,000 Active 49 DOM
-
2026-06-14days on market $294,000 Active 47 DOM
-
2026-06-13days on market $294,000 Active 46 DOM
-
2026-06-10days on market $294,000 Active 44 DOM
-
2026-06-09days on market $294,000 Active 43 DOM
-
2026-06-08days on market $294,000 Active 42 DOM
-
2026-06-07pricedays on market $294,000 Active 41 DOM
-
2026-06-02days on market $299,000 Active 36 DOM
-
2026-06-01days on market $299,000 Active 35 DOM
-
2026-05-31days on market $299,000 Active 34 DOM
-
2026-05-30days on market $299,000 Active 33 DOM
-
2026-04-27$299,000 Active 937-char remark
-
2020-08-27soldstatus $140,000
-
1994-07-19soldstatus $75,000
ⓘ Source: listings_history table (triggers on properties + properties_extension) + one-shot
backfill from property_details.listing_events for pre-trigger history.
Tax reassessment forecast NY · Partial reset (capped growth)
- Current annual tax
- $4,635 · $386/mo
- Projected year-2 tax
- $4,802 · $400/mo
- Expected delta
- +$167/yr (+$14/mo · 3.6%)
ⓘ Screening estimate from a state-policy table — verify with the county assessor before closing.
Climate risk First Street
- Flood 4/10 Moderate FEMA zone X · 22% chance over 30 yrs
- Wildfire 1/10 Low
- Heat 3/10 Moderate 7 d/yr ≥94°F today · 17 d/yr by 30 yrs out
- Wind 1/10 Low 0% chance of damaging wind over 30 yrs
- Air quality 2/10 Low 0 unhealthy d/yr today · 1 by 30 yrs out
Nearby sold comps map
Loading sold comps map…
Walkable amenities ~0.75 mi
Loading nearby amenities…
Taxation est. · year 1
- Rental income
- $76,788
- − Mortgage interest
- −$16,469
- − Property taxes
- −$4,635
- − Insurance
- −$1,470
- − Repairs & maintenance
- −$6,143
- − Management
- −$6,143
- − Depreciation
- −$8,553
- Taxable income
- $33,376
- Est. tax owed @ 24.0%
- −$8,010
- After-tax cash flow
- $28,046/yr
For passive investors: Depreciation is non-cash, so a rental often shows a tax loss while cash-flowing — sheltering income. Rental losses are passive: they offset passive income freely, and up to $25,000/yr can offset ordinary (W-2) income if you actively participate and your MAGI is under $100k (phasing out to $0 by $150k); unused losses carry forward. On sale, claimed depreciation is recaptured at up to 25%, and gains may owe capital-gains tax (a 1031 exchange can defer both). Figures are a year-1 estimate at your 24.0% rate — not tax advice; consult a CPA.
Schools (NCES district)
- District
- Chittenango Central School District
- NCES district ID
- 3607470
- Math proficiency
- 61% ▼ -4.00%
- Reading proficiency
- 64% ▲ 9.00%
- Median HH income
- $62,521
- Composite
- 54.34/100
- National rank
- #1365
- State rank
- #192 of 590 in NY
Livability — Chittenango
- Score
- 74/100
- State rank
- #296
- US rank
- #4790
Category grades
Schools grade is shown separately in the Schools card above.
Census & demographics
- Census place
- Chittenango, NY
- Population (ZIP)
- 9,519
Population outlook (Madison County) Hauer SSP2
- Today (2025)
- 69,528 people
- By 2030
- 66,599 · -4.2%
- By 2040
- 59,814 · -14.0%
- By 2050
- 52,842 · -24.0%
- By 2075
- 39,167 · -43.7%
- By 2100
- 28,442 · -59.1%
Race, ethnicity, and origin ACS 2023
- Neighborhood character
- Predominantly White (92%)
- Race & ethnicity
- White 92% Two or more races 5% Hispanic / Latino 4%
- Common ancestry
- Romanian 9% Iranian 3% Lithuanian 3%
- Foreign-born
- 3% · Canada, Jamaica
- Languages at home
- 96% English-only · Spanish 2% French/Haitian/Cajun 1%
Political lean MEDSL · Madison
- 2024 margin
- R (+13.1) · D 43.5% · R 56.5%
- 2008→2024 swing
- -13.9pp toward R · 2008: 0.9pp · 2024: -13.1pp
- All cycles
- 2024: R+13.1 2020: R+10.6 2016: R+15.9 2012: D+0.3 2008: D+0.9
Not yet ingested
- Civics
- —
Market trends
- HPI YoY
- ▼ -56.53%
- Current HPI
- 272.9953
- Rent YoY
- —
- Metro
- —
- State GDP YoY
- ▲ 2.60%
- F500 in state
- 92
Industry mix (Fortune 500 HQ in NY)
| Industry | F500 HQs | Revenue |
|---|---|---|
| Financial Services | 10 | $950B |
|
||
| Consumer Goods | 9 | $162B |
|
||
| Insurance | 4 | $225B |
|
||
| Telecommunications | 2 | $144B |
|
||
| Pharmaceuticals | 2 | $112B |
|
||
| Media / Entertainment | 2 | $69B |
|
||
Price history
+292.0% since first listed4 events — show timeline
- 2026-06-03 Price Changed $294,000 CNYIS
- 2026-04-27 Listed $299,000 CNYIS
- 2020-08-27 Sold (Public Records) $140,000 Public Records
- 1994-07-19 Sold (Public Records) $75,000 Public Records
Property tax history
+1.0%/yrLatest (2025): $4,635 · +3.4% YoY. Source: county tax records.
Cash-flow waterfall
monthlySold comps — $/sqft
last 12 mo · ≤1 miLoading sold comps…