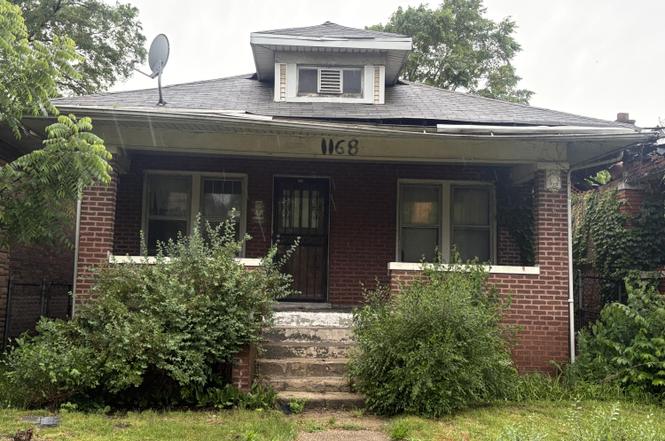
1168 Van Buren St · Gary, IN
Flood risk 6/10 · Moderate
- FEMA flood zone
- X (unshaded)
- Chance of flooding over 30 yrs
- 0.72%
- Est. flood insurance / yr
- $473 – $860
Fire risk 2/10 · Minimal
- Est. fire insurance / yr
- $717 – $1,331
Heat risk 3/10 · Minor
- Hot days now (above 102°F)
- 7 days/yr
- Hot days in 30 yrs
- 15 days/yr
Wind risk 2/10 · Minimal
- Chance of severe wind over 30 yrs
- —
Air-quality risk 4/10 · Minor
- Unhealthy air days now
- 6 days/yr
- Unhealthy air days in 30 yrs
- 7 days/yr
Risk factors via First Street. Map © Google.
Why this score? — see what drove the D+ grade
The composite is a weighted blend of 9 inputs, each scored 0–100. Each bar is that input's sub-score; the figure is the points it added to the 100-point composite (weight × sub-score).
- Cash flow +15.0/30.0
- ARV discount +7.5/15.0
- Appreciation +5.5/10.0
- 1% rule +5.0/10.0
- DSCR +5.0/10.0
- Livability +3.7/5.0
- Rent growth +2.5/5.0
- Condition / age +2.5/5.0
- Schools +0.5/10.0
$8,000
🖨 Deal sheet 📄 Offer letter ✓ Due diligence
Listing remarks MLS
THIS MOVE IN READY HOME HAS BEEN DRASTICALLY REDUCED! IT'S IDEAL FOR SOMEONE LOOKING FOR AFFORDABLE LIVING OR INCOME PROPERTY!! This Very Charming well maintained 3 bedroom brick home with 9 Ft. ceilings, beautiful wood trim and window sills thru-out, hardwood floors and very dry basement has Character Galore! It features built-in dual matching curios with leaded glass in the living room. The dining room has Crown molding and a beveled mirrored Buffet with dual matching cabinets. In addition, there is a newly remodeled kitchen and bathroom. Some additional amenities include approx. 3 year old furnace, ductwork, basement block windows a newer hot water heater, a 2 car detached garage, freezer, gas range AND A 1 YEAR HOME WARRANTY! Seller MAY consider Contract or Lease/Purchase terms.
Key facts
- 3,615 sq ft lot
- Garage
- Built 1924
Neighborhood map
What this means for you Summary
Snapshot
- This is a 3-bed/1.0-bath single-family listed at $8k.
Deal economics
- At list price, monthly cash flow is $922 ($11k/yr) — positive.
- The deal already cash-flows at list — no discount required.
- Meets the 1% rule at list price ($1k rent vs $8k).
- Cap rate 144.7% vs local median 9.1% in Gary — top-decile yield for the area; either an underpriced asset or a hidden risk that comps aren't pricing in. Stress-test before assuming the spread holds.
Location & tenants
- Location reads 73/100 on livability (#105 in IN) — a middle-class / working-renter tenant base. Strengths: commute A+, cost of living A+, housing A+; Watch: schools F, crime F, employment F.
- Gary Community School Corporation (urban): math 3% / reading 11% proficiency, ranked #299 of 301 in IN (top 99%) — low school quality limits family demand, transient renter base, plan for 1-2y turnover; 80% free/reduced lunch — lower-income household profile, screen leases tightly.
- Market conditions: 121 active listings in the ZIP; 32 comparable units currently listed for rent nearby; rentals leasing fast (median 2d on market — plan ~1-2 weeks tenant-placement turnaround); lower-income renter base — watch delinquency; 1,642 units permitted in Lake County in 2024 (14 in 5+ unit buildings).
- At $1,238/mo this rent would consume 52% of the median local household income ($29k/yr) (locally 392% of renters already pay >50% of income on rent) — very limited rent-growth headroom before tenants either downsize or default.
Forward outlook
- In year one you build about $133 of equity ($55 loan paydown + $78 appreciation (1.0% local appreciation)).
- Lake County population projected to shrink 7% by 2050 — rents likely to lag national; underwrite the cash flow, not the appreciation.
- At projected returns (1.0% appreciation + 3.0% rent growth), your $2k cash investment doubles in ~1 year — after that, you're playing with house money.
Negotiation context
- Only 0 days on market — expect competitive offers; lowballing is unlikely to land.
- 2 sale attempts since 19y ago with the ask held roughly flat each time — persistent listings suggest the price (not the market) is what's stuck; bring a comps-based counter.
Risks & watch-outs
- Watch-outs: built in 1924 — expect roof / HVAC / electrical / plumbing capex.
- Climate carrying-cost: major flood risk — expect insurance premiums to compound above CPI over the hold.
Questions for the listing agent
- Built in 1924 — when were the roof, HVAC, electrical panel, plumbing, and water heater last replaced?
- Is there a deadline driving the sale (1031 exchange, divorce, estate, relocation)? That informs how much negotiation room exists.
- Schools are F-rated, which usually means shorter tenancies and higher turnover. Who's the typical renter profile here, and what's been the actual vacancy rate?
- Crime grade is F in this area — have there been break-ins, vandalism, or insurance claims at this property in the last 3 years? What carrier currently insures it and at what premium?
- The area grade is low — what's the realistic commute time and amenity access for the typical tenant pool here? Any planned neighborhood developments (good or bad) we should know about?
- What's the average days-on-market for RENTAL listings here right now (not sales)? A rising rental-DOM trend means longer vacancies and softer asking-rent achievability than the comps imply.
- What's the recent tenant-quality profile in this submarket — average credit score on applications, eviction rate, late-payment / NSF rate, and stable-employment percentage? A property-management company in the area should have these aggregated.
- How much new for-sale + rental construction is in the pipeline within 1–3 miles? Heavy new supply typically softens prices + rents 12–24 months out; constrained supply supports both.
Investment metrics
- 1% rule
- 15.47% ✓
- Cap rate
- 144.67%
- Cash-on-cash
- 494.19%
- DSCR
- 22.99
- GRM
- 0.5
CMA / ARV
- ARV (on-the-fly)
- $31,992
- Comps found
- 12
Show comp detail 12 sales within ~0.75 mi
| Address | Dist | Beds/Ba | Sqft | Sold | Price | $/sf | Match |
|---|---|---|---|---|---|---|---|
| 1561 Tyler St | 0.29mi | 3/1.0 | 1,008 (-2%) | 0mo | $12,000 | $12 | 82 |
| 1177 Harrison St | 0.04mi | 2/1.0 (-1) | 946 (-8%) | 2mo | $8,500 | $9 | 78 |
| 1349 Harrison St | 0.11mi | 3/1.0 | 1,068 (+4%) | 14mo | $22,900 | $21 | 77 |
| 1067 Polk St | 0.26mi | 3/1.5 | 1,088 (+5%) | 7mo | $116,000 | $107 | 71 |
| 1161 Harrison Blvd | 0.10mi | 4/2.0 (+1) | 912 (-12%) | 0mo | $21,000 | $23 | 67 |
| 668 Harrison St | 0.58mi | 3/1.5 | 1,008 (-2%) | 10mo | $40,000 | $40 | 59 |
| 1384 Fillmore St | 0.32mi | 2/1.5 (-1) | 1,078 (+4%) | 14mo | $39,900 | $37 | 59 |
| 1151 Delaware St | 0.69mi | 3/1.0 | 1,057 (+2%) | 9mo | $34,500 | $33 | 56 |
| 1014 W 19th Ave | 0.47mi | 3/1.5 | 960 (-7%) | 14mo | $30,000 | $31 | 53 |
| 1161 Fillmore St | 0.26mi | 2/1.0 (-1) | 905 (-12%) | 14mo | $42,000 | $46 | 51 |
| 1690 W 12th Ave | 0.69mi | 3/1.0 | 1,134 (+10%) | 6mo | $25,000 | $22 | 46 |
| 1567 Hayes St | 0.68mi | 2/1.0 (-1) | 934 (-10%) | 4mo | $29,000 | $31 | 44 |
Match score weights: distance 35% · size 25% · config 20% · recency 20%. Top-matched comps best support the ARV.
Projected returns pro-forma
0.98% appreciation · 3.0% rent growth · sell at horizon
- IRR
- —
- Equity multiple
- 27.30×
- Total profit
- $58,914
- Equity at exit
- $2,723
- IRR
- —
- Equity multiple
- 58.38×
- Total profit
- $128,525
- Equity at exit
- $3,612
Cash invested: $2,240 (down + closing). Projections, not guarantees.
Landlord ↔ Tenant lean methodology
- Overall (STATE)
- 90 Strongly Landlord-Friendly
- State Indiana
- 90 Strongly Landlord-Friendly · R+11
- County
- — inherits STATE
- City
- — inherits STATE
ZIP-level market 46407
- Home prices YoY
- 0.4%
- Active inventory
- 121
- Price-to-rent
- 0.5×
Monthly cashflow live
- Estimated rent
- $1,238 high interval (Pro) →
- Mortgage (P&I)
- −$42
- Tax est. 1.5%
- −$10 /mo · $120/yr
- Insurance
- −$3
- HOA
- −$0
- Vacancy / Maint / Mgmt
- −$260
- Net cashflow
- $922
Break-even live
UW: 25.0% down · 7.5% · 30yr · 1.5% tax · 5.0% vac · 8.0% maint · 8.0% mgmt
Financing live
Cash to close
- Down payment
- $2,000
- Closing costs
- $240
- Reserves months
- —
- Total cash needed
- —
Loan-product check · same deal, 3 products live
Conventional
25% down · 7.5% · 30yr
- Down + closing
- —
- Monthly P&I
- —
- Monthly cashflow
- —
- DSCR
- —
- Eligible?
- —
Personal DTI + credit; lowest rate.
DSCR
20% down · 8.5% · 30yr
- Down + closing
- —
- Monthly P&I
- —
- Monthly cashflow
- —
- DSCR
- —
- Eligible?
- —
No personal income docs; deal must DSCR.
Hard money
10% down · 12.0% · 12mo
- Down + closing
- —
- Monthly P&I
- —
- Monthly cashflow
- —
- DSCR
- —
- Eligible?
- —
Short-term bridge; refi at stabilization.
Rent comps 32 comps
| Address | Beds | Baths | Sqft | Rent | $/sqft | DOM | Units | Dist |
|---|---|---|---|---|---|---|---|---|
| 1572 Polk St Gary, IN | 3.0 | 1.0 | 1500 | $1,250 | $0.83 | 1d | 1 | 0.33mi |
| 1521 Pierce St Unit 1 Gary, IN | 2.0 | 1.0 | 800 | $850 | $1.06 | 1d | 1 | 0.38mi |
| 840 W 19th Ave Gary, IN | 2.0 | 1.0 | 1035 | $1,150 | $1.11 | 19d | 1 | 0.42mi |
| 1316 Delaware St Unit 2 Gary, IN | 2.0 | 1.0 | 700 | $950 | $1.36 | 20d | 1 | 0.65mi |
| 1329 Delaware St Gary, IN | 2.0 | 1.0 | 1100 | $1,100 | $1.00 | 43d | 1 | 0.68mi |
| 2022 Massachusetts St Gary, IN | 2.0 | 1.0 | 965 | $1,000 | $1.04 | 1d | 1 | 0.74mi |
| 672 Connecticut St Apt 1S Gary, IN | 3.0 | 1.0 | 1247 | $875 | $0.70 | 15d | 1 | 0.79mi |
| 501 Madison St Gary, IN | 1.0–4.0 | 1.0 | 883 | $1,362 | $1.54 | 1d | 11 | 0.83mi |
| 2061 Maryland St Gary, IN | 2.0 | 1.0 | 975 | $950 | $0.97 | 43d | 1 | 0.98mi |
| 411 Pierce St Gary, IN | 3.0 | 1.0 | 874 | $1,395 | $1.60 | 22d | 1 | 1.00mi |
| 2361 Pierce St Unit 2 Gary, IN | 3.0 | 1.0 | 860 | $900 | $1.05 | 1d | 1 | 1.03mi |
| 2336 Delaware St Gary, IN | 3.0 | 1.0 | 816 | $1,100 | $1.35 | 1d | 1 | 1.16mi |
| 2300 Maryland St Gary, IN | 2.0 | 1.0 | 900 | $1,000 | $1.11 | 19d | 1 | 1.16mi |
| 1595 Ellsworth St Unit 1 Gary, IN | 2.0 | 1.0 | 868 | $1,100 | $1.27 | 1d | 1 | 1.23mi |
| 1595 Ellsworth St Gary, IN | 2.0 | 1.0 | 868 | $1,100 | $1.27 | 2d | 1 | 1.23mi |
| 844 Tennessee St Gary, IN | 3.0 | 1.5 | 1000 | $1,500 | $1.50 | 43d | 1 | 1.23mi |
| 2315 Industrial Blvd Gary, IN | 2.0 | 1.0 | 989 | $950 | $0.96 | 4d | 1 | 1.24mi |
| 2315 Industrial Blvd Gary, IN | 2.0 | 1.0 | 989 | $950 | $0.96 | 1d | 1 | 1.24mi |
| 2315 Industrial Blvd Unit B Gary, IN | 3.0 | 1.0 | 989 | $1,150 | $1.16 | 1d | 1 | 1.24mi |
| 2572-76 Van Buren Pl Gary, IN | 2.0 | 1.0 | 700 | $1,025 | $1.46 | 1d | 1 | 1.25mi |
| 317 Garfield St Gary, IN | 3.0 | 1.0 | 936 | $1,495 | $1.60 | 43d | 1 | 1.27mi |
| 358 Arthur St Unit 2 Gary, IN | 2.0 | 1.0 | 800 | $1,250 | $1.56 | 1d | 1 | 1.28mi |
| 1030 E 6th Ave Gary, IN | 3.0 | 1.5 | 1400 | $1,600 | $1.14 | 1d | 1 | 1.32mi |
| 2280 Roosevelt Pl Gary, IN | 3.0 | 1.0 | 864 | $1,560 | $1.81 | 1d | 1 | 1.35mi |
| 2306 W 5th Ave Gary, IN | 2.0–3.0 | 1.0 | 937 | $1,299 | $1.39 | 1d | 2 | 1.37mi |
| 2306 W 5th Ave Apt 3 Gary, IN | 3.0 | 1.0 | 1025 | $1,299 | $1.27 | 1d | 1 | 1.37mi |
| 2425 Prospect St Gary, IN | 3.0 | 1.0 | 1051 | $1,400 | $1.33 | 1d | 1 | 1.38mi |
| 2264 Taft St Gary, IN | 2.0 | 1.0 | 800 | $1,275 | $1.59 | 1d | 1 | 1.39mi |
| 2306 Vermont St Gary, IN | 3.0 | 1.5 | 1200 | $1,300 | $1.08 | 1d | 1 | 1.39mi |
| 2355 Rhode Island St Gary, IN | 2.0 | 1.0 | 701 | $1,095 | $1.56 | 43d | 1 | 1.42mi |
| 2453 Prospect St Gary, IN | 2.0 | 1.0 | 704 | $1,095 | $1.56 | 1d | 1 | 1.42mi |
| 837 W 27th Ave Unit A Gary, IN | 2.0 | 1.0 | 750 | $1,150 | $1.53 | 1d | 1 | 1.44mi |
Listing history 2 events
-
2026-06-17remarks 69-char remark
-
2026-06-17$8,000 Pending
ⓘ Source: listings_history table (triggers on properties + properties_extension) + one-shot
backfill from property_details.listing_events for pre-trigger history.
Climate risk First Street
- Flood 6/10 Major FEMA zone X (unshaded) · 72% chance over 30 yrs
- Wildfire 2/10 Low
- Heat 3/10 Moderate 7 d/yr ≥102°F today · 15 d/yr by 30 yrs out
- Wind 2/10 Low
- Air quality 4/10 Moderate 6 unhealthy d/yr today · 7 by 30 yrs out
Nearby sold comps map
Loading sold comps map…
Walkable amenities ~0.75 mi
Loading nearby amenities…
Taxation est. · year 1
- Rental income
- $14,852
- − Mortgage interest
- −$448
- − Property taxes
- −$120
- − Insurance
- −$40
- − Repairs & maintenance
- −$1,188
- − Management
- −$1,188
- − Depreciation
- −$233
- Taxable income
- $11,635
- Est. tax owed @ 24.0%
- −$2,792
- After-tax cash flow
- $8,277/yr
For passive investors: Depreciation is non-cash, so a rental often shows a tax loss while cash-flowing — sheltering income. Rental losses are passive: they offset passive income freely, and up to $25,000/yr can offset ordinary (W-2) income if you actively participate and your MAGI is under $100k (phasing out to $0 by $150k); unused losses carry forward. On sale, claimed depreciation is recaptured at up to 25%, and gains may owe capital-gains tax (a 1031 exchange can defer both). Figures are a year-1 estimate at your 24.0% rate — not tax advice; consult a CPA.
Schools (NCES district)
- District
- Gary Community School Corporation
- NCES district ID
- 1803870
- Math proficiency
- 3% ▼ -10.00%
- Reading proficiency
- 11% ▼ -6.00%
- Median HH income
- $27,739
- Composite
- 4.98/100
- National rank
- #10039
- State rank
- #299 of 301 in IN
Livability — Gary
- Score
- 73/100
- State rank
- #105
- US rank
- #5592
Category grades
Schools grade is shown separately in the Schools card above.
Census & demographics
- Census place
- Gary, IN
- County
- Lake County · 422,878 people
- City population
- 63,701
- Metro
- Chicago-Naperville-Elgin, IL-IN-WI
- Population (ZIP)
- 8,577
- Household income
- $28,526
- Rent vs Own
- Severe rent burden
- 392.0
Population outlook (Lake County) Hauer SSP2
- Today (2025)
- 484,026 people
- By 2030
- 478,091 · -1.2%
- By 2040
- 462,974 · -4.3%
- By 2050
- 449,894 · -7.1%
- By 2075
- 436,169 · -9.9%
- By 2100
- 426,607 · -11.9%
Race, ethnicity, and origin ACS 2023
- Neighborhood character
- Predominantly Black (91%)
- Race & ethnicity
- Black 91% Hispanic / Latino 3% White 2% Two or more races 1%
- Common ancestry
- Romanian 1%
- Foreign-born
- 1% · Canada
- Languages at home
- 97% English-only · Spanish 1% Russian/Polish/Slavic 1% French/Haitian/Cajun 1%
Political lean MEDSL · Lake
- 2024 margin
- Lean D (+5.6) · D 52.1% · R 46.5% · Other 1.5%
- 2008→2024 swing
- -28.6pp toward R · 2008: 34.3pp · 2024: 5.6pp
- All cycles
- 2024: D+5.6 2020: D+15.1 2016: D+20.6 2012: D+31.0 2008: D+34.3
Not yet ingested
- Civics
- —
Market trends
- HPI YoY
- ▲ 0.98%
- Current HPI
- 253.2856
- Rent YoY
- —
- Metro
- Chicago-Naperville-Elgin, IL-IN-WI
- State GDP YoY
- ▲ 2.90%
- F500 in state
- 18
Industry mix (Fortune 500 HQ in IN)
| Industry | F500 HQs | Revenue |
|---|---|---|
| Industrial Machinery | 2 | $37B |
|
||
| Healthcare | 1 | $177B |
|
||
| Pharmaceuticals | 1 | $45B |
|
||
| Metals / Steel | 1 | $18B |
|
||
| Agriculture | 1 | $17B |
|
||
| Packaging | 1 | $12B |
|
||
Price history
-59.8% since first listed3 events — show timeline
- 2026-06-17 Listing Removed — NIRA MLS as Distributed by MLS Grid
- 2026-06-16 Listed $8,000 NIRA MLS as Distributed by MLS Grid
- 2007-07-11 Listed $19,900 NIRA MLS as Distributed by MLS Grid
Property tax history
-7.0%/yrLatest (2024): $737 · +1.9% YoY. Source: county tax records.
Cash-flow waterfall
monthlySold comps — $/sqft
last 12 mo · ≤1 miLoading sold comps…