1030 E Avenue S #114 · Palmdale, CA
Flood risk 1/10 · Minimal
- FEMA flood zone
- X (unshaded)
- Chance of flooding over 30 yrs
- 0.0%
- Est. flood insurance / yr
- $507 – $1,088
Fire risk 8/10 · Major
- Est. fire insurance / yr
- $659 – $1,223
Heat risk 6/10 · Moderate
- Hot days now (above 98°F)
- 5 days/yr
- Hot days in 30 yrs
- 12 days/yr
Wind risk 1/10 · Minimal
- Chance of severe wind over 30 yrs
- —
Air-quality risk 10/10 · Severe
- Unhealthy air days now
- 25 days/yr
- Unhealthy air days in 30 yrs
- 29 days/yr
Risk factors via First Street. Map © Google.
Why this score? — see what drove the B grade
The composite is a weighted blend of 9 inputs, each scored 0–100. Each bar is that input's sub-score; the figure is the points it added to the 100-point composite (weight × sub-score).
- Cash flow +30.0/30.0
- ARV discount +11.0/15.0
- 1% rule +10.0/10.0
- DSCR +10.0/10.0
- Condition / age +3.8/5.0
- Rent growth +2.9/5.0
- Livability +2.8/5.0
- Schools +2.5/10.0
- Appreciation +0.0/10.0
$174,990
🖨 Deal sheet 📄 Offer letter ✓ Due diligence
Listing remarks
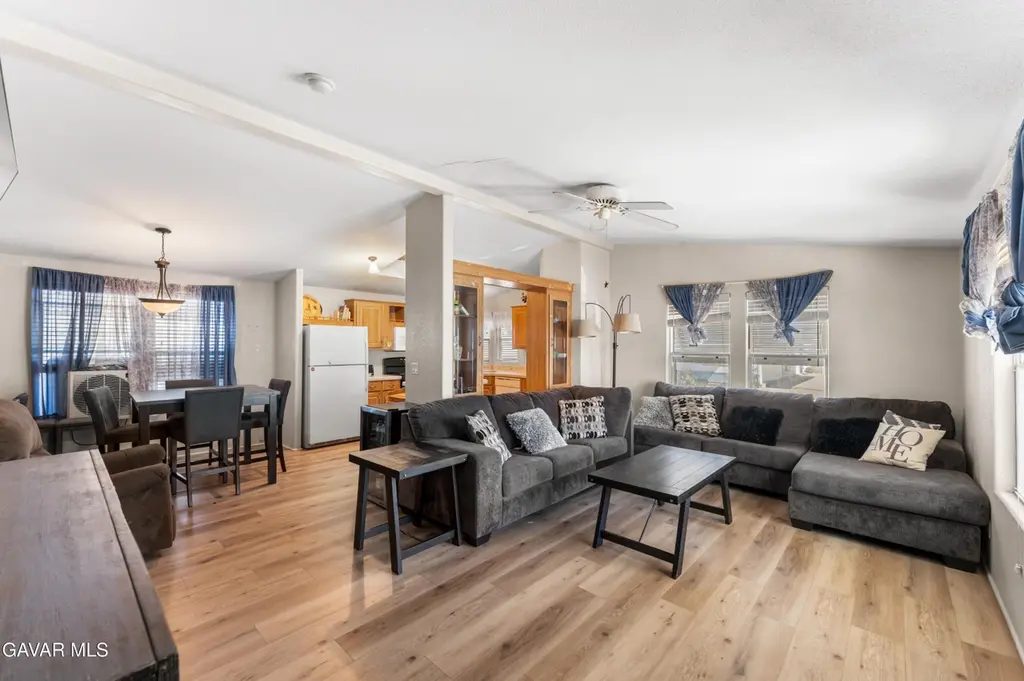
Welcome to The Boulders, one of the most desirable and tightly held manufactured home communities in the area--a park where homes rarely hit the market. This spacious 3-bedroom home has been aggressively priced to draw strong interest and sell quickly. Inside, enjoy the fresh feel of brand new flooring and interior paint, giving the home a bright and updated look throughout. The open living room, dining area, and kitchen layout offer plenty of natural light and comfortable flow. The primary suite includes its own private bathroom with a large soaking tub, and the additional bedrooms are great for family, guests, or a home office. Outside, the home features covered parking, a large lot, and
Key facts
- Community pool
- Built 2003
- Listed 21 days
Property features AI
Finance
- Other: Serial numbers: CAVAZLP0313614U, CAVAZLP0313614X; Trade name: CAVCO; Label/Insignia numbers: ARZ268747, ARZ268746; Length 54 (manufactured home); Width 20101 (listed value)
- HOA & community: Park name: The Boulders; Space number 114; New space rent $662; Park deposit $500; Deposit $2,000
Exterior
- Utilities: 220V electric
- Home design: Manufactured home; Model GS-2544A-90; Manufactured by Cavco Industries LLC; All ages park
- Construction: Tile roof; Built in 2003 (manufacture date 2003-05-20); Skirting: Other
- Exterior features: Pool (community); Clubhouse/rec room (community)
Interior
- Kitchen: Dishwasher; Microwave; Gas range and gas oven
- Bathrooms: 2 full bathrooms
- Heating & cooling: Central air; Central electric heat
- Interior features: Dishwasher; Microwave; Gas range and gas oven; Awning(s); Porch
Neighborhood map
What this means for you Summary
Snapshot
- This is a 3-bed/2.0-bath manufactured listed at $175k. Condition is rated good.
Deal economics
- At list price, monthly cash flow is $1k ($13k/yr) — positive.
- The deal already cash-flows at list — no discount required.
- Meets the 1% rule at list price ($3k rent vs $175k).
- Recommended offer: $172k (1.5% below list) — sets the bar for market timing.
- Cap rate 13.4% vs local median 4.5% in Palmdale — top-decile yield for the area; either an underpriced asset or a hidden risk that comps aren't pricing in. Stress-test before assuming the spread holds.
Location & tenants
- Location reads 55/100 on livability (#861 in CA) — a working-class tenant base; expect higher turnover. Strengths: housing A+; Watch: schools F, crime F, amenities F.
- Palmdale Elementary (suburban): math 20% / reading 31% proficiency, ranked #1,147 of 1,400 in CA (top 82%) — low school quality limits family demand, transient renter base, plan for 1-2y turnover; 69% free/reduced lunch — lower-income household profile, screen leases tightly.
- Market conditions: Rents rising (+1.8%/yr); 410 active listings in the ZIP; 6 comparable units currently listed for rent nearby; rentals leasing fast (median 1d on market — plan ~1-2 weeks tenant-placement turnaround); 19,697 units permitted in Los Angeles County in 2024 (9,426 in 5+ unit buildings).
- At $2,702/mo this rent would consume 52% of the median local household income ($62k/yr) (locally 4384% of renters already pay >50% of income on rent) — very limited rent-growth headroom before tenants either downsize or default.
Forward outlook
- Local home prices are declining (-3.0%/yr); year-one equity from $1k of loan paydown is wiped out by about $5k of value loss. Plan a longer hold.
- Los Angeles County population projected at +9% by 2050 — modest demand growth; plan on rents tracking national, not racing it.
- At projected returns (-3.0% appreciation + 1.8% rent growth), your $49k cash investment doubles in ~6 years — after that, you're playing with house money.
Negotiation context
- It's been on market 21 days — a 2% lower offer ($172k) is reasonable based on typical stale-listing flexibility.
Risks & watch-outs
- Climate carrying-cost: severe wildfire risk; extreme-heat days projected 5→12/yr by 2055 (HVAC capex compounding) — expect insurance premiums to compound above CPI over the hold.
Questions for the listing agent
- Is there a deadline driving the sale (1031 exchange, divorce, estate, relocation)? That informs how much negotiation room exists.
- Schools are F-rated, which usually means shorter tenancies and higher turnover. Who's the typical renter profile here, and what's been the actual vacancy rate?
- Crime grade is F in this area — have there been break-ins, vandalism, or insurance claims at this property in the last 3 years? What carrier currently insures it and at what premium?
- What's the average days-on-market for RENTAL listings here right now (not sales)? A rising rental-DOM trend means longer vacancies and softer asking-rent achievability than the comps imply.
- What's the recent tenant-quality profile in this submarket — average credit score on applications, eviction rate, late-payment / NSF rate, and stable-employment percentage? A property-management company in the area should have these aggregated.
- How much new for-sale + rental construction is in the pipeline within 1–3 miles? Heavy new supply typically softens prices + rents 12–24 months out; constrained supply supports both.
Investment metrics
- 1% rule
- 1.54% ✓
- Cap rate
- 13.44%
- Cash-on-cash
- 25.53%
- DSCR
- 2.14
- GRM
- 5.4
CMA / ARV
- ARV (on-the-fly)
- $189,528
- Comps found
- 9
Show comp detail 9 sales within ~0.75 mi
| Address | Dist | Beds/Ba | Sqft | Sold | Price | $/sf | Match |
|---|---|---|---|---|---|---|---|
| 1030 E Avenue S #31 | 0.00mi | 2/2.0 (-1) | 1,248 (-2%) | 6mo | $200,000 | $160 | 86 |
| 1030 E Avenue S #36 | 0.00mi | 2/2.0 (-1) | 1,344 (+6%) | 4mo | $185,000 | $138 | 83 |
| 1030 E Avenue S #108 | 0.00mi | 3/2.0 | 1,380 (+8%) | 8mo | $220,000 | $159 | 80 |
| 1030 E Avenue S #159 | 0.00mi | 3/2.0 | 1,440 (+13%) | 0mo | $220,000 | $153 | 78 |
| 1030 E Avenue S #76 | 0.00mi | 3/2.0 | 1,344 (+6%) | 23mo | $177,000 | $132 | 72 |
| 1030 E Avenue S #37 | 0.00mi | 3/2.0 | 1,176 (-8%) | 20mo | $212,000 | $180 | 71 |
| 1030 E Avenue S #21 | 0.00mi | 3/2.0 | 1,456 (+14%) | 14mo | $195,000 | $134 | 64 |
| 1030 E Avenue S #16 | 0.00mi | 3/2.0 | 1,440 (+13%) | 21mo | $215,000 | $149 | 61 |
| 1030 Avenue S Spc # #16 | 0.17mi | 3/2.0 | 1,440 (+13%) | 21mo | $215,000 | $149 | 53 |
Match score weights: distance 35% · size 25% · config 20% · recency 20%. Top-matched comps best support the ARV.
Projected returns pro-forma
-3.0% appreciation · 1.76% rent growth · sell at horizon
- IRR
- 17.8%
- Equity multiple
- 1.71×
- Total profit
- $34,681
- Equity at exit
- $26,092
- IRR
- 25.4%
- Equity multiple
- 3.09×
- Total profit
- $102,243
- Equity at exit
- $15,130
Cash invested: $48,997 (down + closing). Projections, not guarantees.
Landlord ↔ Tenant lean methodology
- Overall (STATE)
- 18 Strongly Tenant-Friendly
- State California
- 18 Strongly Tenant-Friendly · D+13
- County
- — inherits STATE
- City
- — inherits STATE
ZIP-level market 93550
- Home prices YoY
- -29.4%
- Rents YoY
- 1.8%
- Active inventory
- 410
- Price-to-rent
- 5.4×
Monthly cashflow live
- Estimated rent
- $2,702 high interval (Pro) →
- Mortgage (P&I)
- −$918
- Tax from tax record
- −$102 /mo · $1,220/yr
- Insurance
- −$73
- HOA
- −$0
- Vacancy / Maint / Mgmt
- −$567
- Net cashflow
- $1,043
Break-even live
UW: 25.0% down · 7.5% · 30yr · 1.5% tax · 5.0% vac · 8.0% maint · 8.0% mgmt
Financing live
Cash to close
- Down payment
- $43,748
- Closing costs
- $5,250
- Reserves months
- —
- Total cash needed
- —
Loan-product check · same deal, 3 products live
Conventional
25% down · 7.5% · 30yr
- Down + closing
- —
- Monthly P&I
- —
- Monthly cashflow
- —
- DSCR
- —
- Eligible?
- —
Personal DTI + credit; lowest rate.
DSCR
20% down · 8.5% · 30yr
- Down + closing
- —
- Monthly P&I
- —
- Monthly cashflow
- —
- DSCR
- —
- Eligible?
- —
No personal income docs; deal must DSCR.
Hard money
10% down · 12.0% · 12mo
- Down + closing
- —
- Monthly P&I
- —
- Monthly cashflow
- —
- DSCR
- —
- Eligible?
- —
Short-term bridge; refi at stabilization.
Rent comps 6 comps
| Address | Beds | Baths | Sqft | Rent | $/sqft | DOM | Units | Dist |
|---|---|---|---|---|---|---|---|---|
| 1138 E Avenue R7 Palmdale, CA | 3.0 | 2.0 | 1264 | $2,455 | $1.94 | 13d | 1 | 0.66mi |
| 37414 Drexel St Palmdale, CA | 3.0 | 2.5 | 1452 | $2,500 | $1.72 | 1d | 1 | 0.69mi |
| 37938 Palm Vista Ave Unit A Palmdale, CA | 3.0 | 1.0 | 1223 | $2,150 | $1.76 | 1d | 1 | 1.06mi |
| 1715 Boysenberry Way Palmdale, CA | 4.0 | 3.0 | 1744 | $2,900 | $1.66 | 1d | 1 | 1.06mi |
| 239 Katherine Ct Palmdale, CA | 3.0 | 3.0 | 1386 | $2,900 | $2.09 | 1d | 1 | 1.15mi |
| 38225 9th St E Unit 1 Palmdale, CA | 2.0 | 2.5 | 1500 | $2,500 | $1.67 | 1d | 1 | 1.35mi |
Listing history 2 events
-
2026-05-22status Pending
-
2026-04-30$174,990 Active
ⓘ Source: listings_history table (triggers on properties + properties_extension) + one-shot
backfill from property_details.listing_events for pre-trigger history.
Tax reassessment forecast CA · Resets to sale price
- Current annual tax
- $1,220 · $102/mo
- Projected year-2 tax
- $1,330 · $111/mo
- Expected delta
- +$110/yr (+$9/mo · 9.0%)
ⓘ Screening estimate from a state-policy table — verify with the county assessor before closing.
Climate risk First Street
- Flood 1/10 Low FEMA zone X (unshaded) · 0% chance over 30 yrs
- Wildfire 8/10 Severe
- Heat 6/10 Major 5 d/yr ≥98°F today · 12 d/yr by 30 yrs out
- Wind 1/10 Low
- Air quality 10/10 Extreme 25 unhealthy d/yr today · 29 by 30 yrs out
Nearby sold comps map
Loading sold comps map…
Walkable amenities ~0.75 mi
Loading nearby amenities…
Taxation est. · year 1
- Rental income
- $32,427
- − Mortgage interest
- −$9,802
- − Property taxes
- −$1,220
- − Insurance
- −$875
- − Repairs & maintenance
- −$2,594
- − Management
- −$2,594
- − Depreciation
- −$5,091
- Taxable income
- $10,251
- Est. tax owed @ 24.0%
- −$2,460
- After-tax cash flow
- $10,050/yr
For passive investors: Depreciation is non-cash, so a rental often shows a tax loss while cash-flowing — sheltering income. Rental losses are passive: they offset passive income freely, and up to $25,000/yr can offset ordinary (W-2) income if you actively participate and your MAGI is under $100k (phasing out to $0 by $150k); unused losses carry forward. On sale, claimed depreciation is recaptured at up to 25%, and gains may owe capital-gains tax (a 1031 exchange can defer both). Figures are a year-1 estimate at your 24.0% rate — not tax advice; consult a CPA.
Condition & rehab AI · 3 photos
This well-maintained 3-bedroom manufactured home in a desirable community offers a fresh and updated interior with good curb appeal. Minor improvements could further enhance its value.
Value-add opportunities
- Both Landscaping improvements — Enhances curb appeal and adds value.
- Resale Kitchen appliances — Modernizes the space and attracts buyers.
- Resale Primary suite bathroom vanity — Upgrades the bathroom and enhances the primary suite appeal.
Renovation cost estimate screening
Value-add ROI direction
- Both Landscaping improvements — Enhances curb appeal and adds value. ↑
- Resale Kitchen appliances — Modernizes the space and attracts buyers. ↑
- Resale Primary suite bathroom vanity — Upgrades the bathroom and enhances the primary suite appeal. ↑
ⓘ Cost ranges are severity-bucket heuristics (US national rule-of-thumb). Get contractor quotes + a written scope before underwriting a rehab budget.
Schools (NCES district)
- District
- Palmdale Elementary
- NCES district ID
- 0629580
- Math proficiency
- 20% ▲ 1.00%
- Reading proficiency
- 31% ▲ 1.00%
- Median HH income
- $48,652
- Composite
- 25.34/100
- National rank
- #12888
- State rank
- #1147 of 1400 in CA
Livability — Palmdale
- Score
- 55/100
- State rank
- #861
- US rank
- #23501
Category grades
Schools grade is shown separately in the Schools card above.
Census & demographics
- Census place
- Palmdale, CA
- County
- Los Angeles County · 9,444,647 people
- City population
- 177,644
- Metro
- Los Angeles-Long Beach-Anaheim, CA
- Population (ZIP)
- 80,645
- Household income
- $62,078
- Rent vs Own
- Severe rent burden
- 4384.0
Population outlook (Los Angeles County) Hauer SSP2
- Today (2025)
- 10,940,515 people
- By 2030
- 11,256,481 · +2.9%
- By 2040
- 11,729,929 · +7.2%
- By 2050
- 11,948,407 · +9.2%
- By 2075
- 11,818,114 · +8.0%
- By 2100
- 10,842,928 · -0.9%
Race, ethnicity, and origin ACS 2023
- Neighborhood character
- Predominantly Hispanic (69%)
- Race & ethnicity
- Hispanic / Latino 69% Two or more races 15% Black 14% White 12% Asian 3% Native American 2%
- Hispanic origin (detail)
- Mexican 52%
- Foreign-born
- 26% · Canada
- Languages at home
- 42% English-only · Spanish 55% Tagalog/Filipino 1% Other Asian/Pacific 1%
Political lean MEDSL · Los Angeles
- 2024 margin
- Solid D (+32.9) · D 64.8% · R 31.9% · Other 3.3%
- 2008→2024 swing
- -7.4pp toward R · 2008: 40.4pp · 2024: 32.9pp
- All cycles
- 2024: D+32.9 2020: D+44.2 2016: D+48.0 2012: D+40.0 2008: D+40.4
Not yet ingested
- Civics
- —
Market trends
- HPI YoY
- ▼ -183.38%
- Current HPI
- 440.8844
- Rent YoY
- ▲ 1.76%
- Metro
- Los Angeles-Long Beach-Anaheim, CA
- State GDP YoY
- ▲ 3.21%
- F500 in state
- 116
Industry mix (Fortune 500 HQ in CA)
| Industry | F500 HQs | Revenue |
|---|---|---|
| Technology | 27 | $1,492B |
|
||
| Financial Services | 3 | $174B |
|
||
| Retail | 3 | $44B |
|
||
| Insurance | 3 | $26B |
|
||
| Media / Entertainment | 2 | $115B |
|
||
| Pharmaceuticals / Biotech | 2 | $62B |
|
||
Price history
2 events — show timeline
- 2026-05-22 Pending — AVMLS
- 2026-04-30 Listed $174,990 AVMLS
Property tax history
+33.7%/yrLatest (2025): $1,220 · +33.7% YoY. Source: county tax records.
Cash-flow waterfall
monthlySold comps — $/sqft
last 12 mo · ≤1 miLoading sold comps…