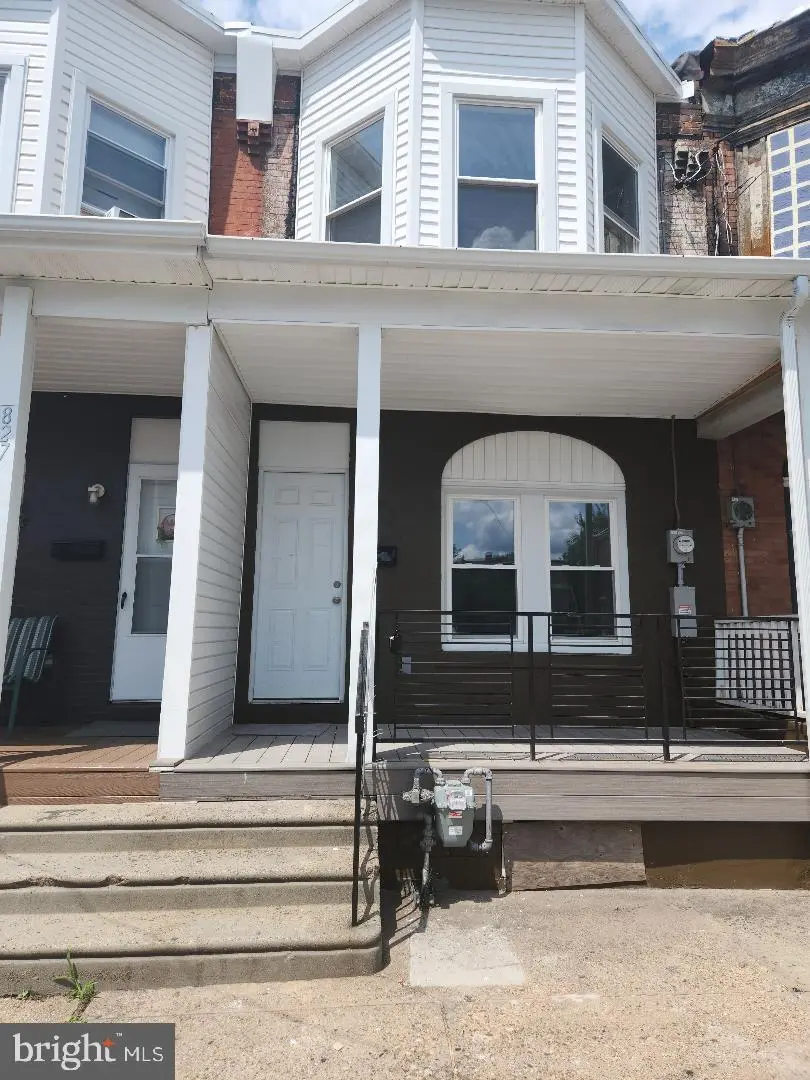
829 York St · Camden, NJ
Flood risk 1/10 · Minimal
- FEMA flood zone
- X (unshaded)
- Chance of flooding over 30 yrs
- 0.0%
- Est. flood insurance / yr
- $507 – $1,088
Fire risk 1/10 · Minimal
- Est. fire insurance / yr
- $526 – $976
Heat risk 6/10 · Moderate
- Hot days now (above 104°F)
- 7 days/yr
- Hot days in 30 yrs
- 15 days/yr
Wind risk 6/10 · Moderate
- Chance of severe wind over 30 yrs
- 27.0%
Air-quality risk 4/10 · Minor
- Unhealthy air days now
- 5 days/yr
- Unhealthy air days in 30 yrs
- 6 days/yr
Risk factors via First Street. Map © Google.
Why this score? — see what drove the C grade
The composite is a weighted blend of 9 inputs, each scored 0–100. Each bar is that input's sub-score; the figure is the points it added to the 100-point composite (weight × sub-score).
- Cash flow +25.5/30.0
- DSCR +8.5/10.0
- ARV discount +7.5/15.0
- 1% rule +6.2/10.0
- Livability +3.5/5.0
- Rent growth +2.5/5.0
- Condition / age +2.5/5.0
- Appreciation +0.7/10.0
- Schools +0.7/10.0
$204,911
🖨 Deal sheet 📄 Offer letter ✓ Due diligence
Listing remarks MLS
Two story, three bedroom, porch front row. Property is fire damage with no interior access. Property being sold strictly As Is. Buyer is responsible for ordering the Use and Occupancy Certification and all city requirements.
Key facts
- Total rehab
- Fenced yard
- Open front porch
Tags
Property features AI
Finance
- Financial info: Not in a federal flood zone; Lease not considered
Exterior
- Parking: On-street parking
- Utilities: Public water; Public sewer; Electric available (100 amp service); Natural gas available; Cable TV available; Phone service available
- Home design: Interior townhouse/rowhouse; 2 floors in unit; Main entrance faces south; Excellent condition; Fee simple ownership; Year of major remodel: 2025
- Construction: Brick construction; Brick/mortar foundation; Flat roof; Double-pane, energy-efficient, insulated replacement windows with screens; vinyl-clad and sliding/storm window options
- Exterior features: Sidewalks; Street lights; Exterior lighting; Rear yard; Rear fencing; Level lot
Interior
- Kitchen: Built-in microwave; Gas oven/range
- Bedrooms: 3 bedrooms on the first upper level
- Bathrooms: 1 full bathroom; 1 half bathroom
- Heating & cooling: Forced air heating; Electric cooling; Hot water on natural gas
- Interior features: Eat-in kitchen; 6 total rooms; Basement (unfinished)
- Laundry & utility: Laundry located in the basement
Neighborhood map
What this means for you Summary
Snapshot
- This is a 3-bed/1.5-bath single-family listed at $205k.
Deal economics
- At list price, monthly cash flow is $480 ($6k/yr) — positive.
- The deal already cash-flows at list — no discount required.
- Meets the 1% rule at list price ($2k rent vs $205k).
- Recommended offer: $193k (6.0% below list) — sets the bar for market timing.
- Cap rate 9.1% vs local median 7.1% in Camden — meaningfully above typical; check what's discounted (condition, days-on-market, listing class) to confirm the premium yield is real.
Location & tenants
- Location reads 70/100 on livability (#262 in NJ) — a middle-class / working-renter tenant base. Strengths: amenities A+, commute A+, cost of living A; Watch: schools F, crime F, employment F.
- Camden City School District (urban): math 3% / reading 16% proficiency, ranked #472 of 472 in NJ (top 100%) — low school quality limits family demand, transient renter base, plan for 1-2y turnover; 86% free/reduced lunch — lower-income household profile, screen leases tightly.
- Market conditions: 24 active listings in the ZIP; 19 comparable units currently listed for rent nearby; rentals leasing fast (median 13d on market — plan ~1-2 weeks tenant-placement turnaround); lower-income renter base — watch delinquency; 1,018 units permitted in Camden County in 2024 (509 in 5+ unit buildings).
- At $2,300/mo this rent would consume 82% of the median local household income ($34k/yr) (locally 562% of renters already pay >50% of income on rent) — very limited rent-growth headroom before tenants either downsize or default.
Forward outlook
- Local home prices are declining (-3.0%/yr); year-one equity from $1k of loan paydown is wiped out by about $6k of value loss. Plan a longer hold.
- Camden County population projected to shrink 8% by 2050 — rents likely to lag national; underwrite the cash flow, not the appreciation.
Negotiation context
- It's been on market 83 days — a 6% lower offer ($193k) is reasonable based on typical stale-listing flexibility.
- 6 sale attempts since 19y ago with the ask held roughly flat each time — persistent listings suggest the price (not the market) is what's stuck; bring a comps-based counter.
- Current owner paid $42k; list at $205k implies a 394% gain — meaningful room to come down on a strong offer.
Risks & watch-outs
- Watch-outs: built in 1909 — expect roof / HVAC / electrical / plumbing capex.
- Climate carrying-cost: major wind risk, 27% chance of damaging wind over 30y; extreme-heat days projected 7→15/yr by 2055 (HVAC capex compounding) — expect insurance premiums to compound above CPI over the hold.
Questions for the listing agent
- It's been on market 83 days. Have you received any prior offers? Is the seller open to a 6% concession, seller financing, or rate buy-down credit?
- Built in 1909 — when were the roof, HVAC, electrical panel, plumbing, and water heater last replaced?
- Why hasn't it sold? Are there any deal-killer items the seller is aware of (foundation, flood, title, zoning, code violations)?
- Is there a deadline driving the sale (1031 exchange, divorce, estate, relocation)? That informs how much negotiation room exists.
- Schools are F-rated, which usually means shorter tenancies and higher turnover. Who's the typical renter profile here, and what's been the actual vacancy rate?
- Crime grade is F in this area — have there been break-ins, vandalism, or insurance claims at this property in the last 3 years? What carrier currently insures it and at what premium?
- What's the average days-on-market for RENTAL listings here right now (not sales)? A rising rental-DOM trend means longer vacancies and softer asking-rent achievability than the comps imply.
- What's the recent tenant-quality profile in this submarket — average credit score on applications, eviction rate, late-payment / NSF rate, and stable-employment percentage? A property-management company in the area should have these aggregated.
- How much new for-sale + rental construction is in the pipeline within 1–3 miles? Heavy new supply typically softens prices + rents 12–24 months out; constrained supply supports both.
Investment metrics
- 1% rule
- 1.12% ✓
- Cap rate
- 9.11%
- Cash-on-cash
- 10.05%
- DSCR
- 1.45
- GRM
- 7.4
CMA / ARV
- ARV (on-the-fly)
- $103,230
- Comps found
- 1
Show comp detail 1 sale within ~0.75 mi
| Address | Dist | Beds/Ba | Sqft | Sold | Price | $/sf | Match |
|---|---|---|---|---|---|---|---|
| 548 Grant St | 0.25mi | 2/1.5 (-1) | 1,004 (-12%) | 17mo | $90,000 | $90 | 49 |
Match score weights: distance 35% · size 25% · config 20% · recency 20%. Top-matched comps best support the ARV.
Projected returns pro-forma
-3.0% appreciation · 3.0% rent growth · sell at horizon
- IRR
- -1.2%
- Equity multiple
- 0.95×
- Total profit
- $-2,618
- Equity at exit
- $30,553
- IRR
- 8.5%
- Equity multiple
- 1.65×
- Total profit
- $37,066
- Equity at exit
- $17,717
Cash invested: $57,375 (down + closing). Projections, not guarantees.
Landlord ↔ Tenant lean methodology
- Overall (STATE)
- 21 Tenant-Leaning
- State New Jersey
- 21 Tenant-Leaning · D+6
- County
- — inherits STATE
- City
- — inherits STATE
ZIP-level market 08102
- Home prices YoY
- -4.3%
- Active inventory
- 24
- Price-to-rent
- 7.4×
Monthly cashflow live
- Estimated rent
- $2,300 high interval (Pro) →
- Mortgage (P&I)
- −$1,075
- Tax from tax record
- −$177 /mo · $2,124/yr
- Insurance
- −$85
- HOA
- −$0
- Vacancy / Maint / Mgmt
- −$483
- Net cashflow
- $480
Break-even live
UW: 25.0% down · 7.5% · 30yr · 1.5% tax · 5.0% vac · 8.0% maint · 8.0% mgmt
Financing live
Cash to close
- Down payment
- $51,228
- Closing costs
- $6,147
- Reserves months
- —
- Total cash needed
- —
Loan-product check · same deal, 3 products live
Conventional
25% down · 7.5% · 30yr
- Down + closing
- —
- Monthly P&I
- —
- Monthly cashflow
- —
- DSCR
- —
- Eligible?
- —
Personal DTI + credit; lowest rate.
DSCR
20% down · 8.5% · 30yr
- Down + closing
- —
- Monthly P&I
- —
- Monthly cashflow
- —
- DSCR
- —
- Eligible?
- —
No personal income docs; deal must DSCR.
Hard money
10% down · 12.0% · 12mo
- Down + closing
- —
- Monthly P&I
- —
- Monthly cashflow
- —
- DSCR
- —
- Eligible?
- —
Short-term bridge; refi at stabilization.
Rent comps 19 comps
| Address | Beds | Baths | Sqft | Rent | $/sqft | DOM | Units | Dist |
|---|---|---|---|---|---|---|---|---|
| 527 Penn St Unit 1A Camden, NJ | 2.0 | 1.0 | 800 | $1,500 | $1.88 | 18d | 1 | 0.49mi |
| 331 Point St Camden, NJ | 3.0 | 1.0 | 1000 | $1,900 | $1.90 | 18d | 1 | 0.75mi |
| 1 Market St Camden, NJ | 3.0 | 1.0–2.0 | 1190 | $2,456 | $2.06 | 2d | 15 | 0.80mi |
| 727 Berkley St Camden, NJ | 2.0 | 1.5 | 1008 | $1,660 | $1.65 | 24d | 1 | 0.97mi |
| 440 Henry St Camden, NJ | 3.0 | 1.5 | 1224 | $2,200 | $1.80 | 24d | 1 | 1.01mi |
| 537 Newton Ave Camden, NJ | 2.0 | 1.0 | 1092 | $1,500 | $1.37 | 18d | 1 | 1.03mi |
| 537 Newton Ave Camden, NJ | 2.0 | 1.0 | 1092 | $1,500 | $1.37 | 12d | 1 | 1.03mi |
| 708 Royden St Camden, NJ | 3.0 | 1.0 | 1113 | $1,595 | $1.43 | 17d | 1 | 1.07mi |
| 609 Henry St Camden, NJ | 3.0 | 1.0 | 1290 | $1,600 | $1.24 | 24d | 1 | 1.16mi |
| 1325 N Beach St Philadelphia, PA | 1.0–2.0 | 1.0–2.0 | 859 | $4,039 | $4.70 | 1d | 10 | 1.26mi |
| 1509 Park Blvd Camden, NJ | 1.0–2.0 | 1.0 | 1075 | $1,650 | $1.53 | 24d | 1 | 1.27mi |
| 501 N Christopher Columbus Blvd Philadelphia, PA | 1.0–3.0 | 1.0–3.0 | 1062 | $5,148 | $4.85 | 1d | 100 | 1.28mi |
| 1055 Kenwood Ave Camden, NJ | 4.0 | 1.0 | 1088 | $1,875 | $1.72 | 24d | 1 | 1.30mi |
| 1130 N Delaware Ave Philadelphia, PA | 2.0 | 1.0–2.5 | 1194 | $3,600 | $3.01 | 10d | 12 | 1.34mi |
| 503 N Christopher Columbus Blvd Unit 1503 Philadelphia, PA | 3.0 | 2.5 | 1450 | $3,825 | $2.64 | 5d | 1 | 1.35mi |
| 503 N Christopher Columbus Blvd Unit TOWNHOUSE Philadelphia, PA | 2.0 | 2.5 | 1311 | $3,610 | $2.75 | 2d | 1 | 1.35mi |
| 503 N Christopher Columbus Blvd Unit TOWNHOUSE Philadelphia, PA | 2.0 | 2.5 | 1311 | $4,593 | $3.50 | 1d | 1 | 1.35mi |
| 1455 Wildwood Ave Camden, NJ | 3.0 | 1.5 | 1353 | $1,900 | $1.40 | 10d | 1 | 1.40mi |
| 700 N Delaware Ave Philadelphia, PA | 3.0 | 2.0 | 1067 | $5,110 | $4.79 | 1d | 166 | 1.44mi |
Listing history 21 events
-
2026-05-09status Pending
-
2026-02-15$204,911 Active
-
2026-01-06historical
-
2025-10-07price $204,911
-
2025-07-14status Active
-
2025-07-14historical
-
2025-07-14$224,911
-
2024-06-17status Pending 224-char remark
Show marketing remark (224 chars)
Two story, three bedroom, porch front row. Property is fire damage with no interior access. Property being sold strictly As Is. Buyer is responsible for ordering the Use and Occupancy Certification and all city requirements.
-
2024-06-17soldstatus $41,500 Closed 224-char remark
Show marketing remark (224 chars)
Two story, three bedroom, porch front row. Property is fire damage with no interior access. Property being sold strictly As Is. Buyer is responsible for ordering the Use and Occupancy Certification and all city requirements.
-
2024-05-25historical Active Under Contract 224-char remark
Show marketing remark (224 chars)
Two story, three bedroom, porch front row. Property is fire damage with no interior access. Property being sold strictly As Is. Buyer is responsible for ordering the Use and Occupancy Certification and all city requirements.
-
2024-05-14$19,900 Active 224-char remark
Show marketing remark (224 chars)
Two story, three bedroom, porch front row. Property is fire damage with no interior access. Property being sold strictly As Is. Buyer is responsible for ordering the Use and Occupancy Certification and all city requirements.
-
2008-09-05soldstatus $90,000
-
2008-08-29soldstatus $90,000
-
2008-07-29historical
-
2007-08-04$89,911
-
2007-06-05soldstatus $78,000
-
2007-05-21soldstatus $15,600
-
2007-05-01historical
-
2007-04-28$15,600
-
2006-04-27soldstatus $25,000
-
2002-11-08soldstatus $4,850
ⓘ Source: listings_history table (triggers on properties + properties_extension) + one-shot
backfill from property_details.listing_events for pre-trigger history.
Tax reassessment forecast NJ · Partial reset (capped growth)
- Current annual tax
- $2,124 · $177/mo
- Projected year-2 tax
- $3,613 · $301/mo
- Expected delta
- +$1,489/yr (+$124/mo · 70.1%)
ⓘ Screening estimate from a state-policy table — verify with the county assessor before closing.
Climate risk First Street
- Flood 1/10 Low FEMA zone X (unshaded) · 0% chance over 30 yrs
- Wildfire 1/10 Low
- Heat 6/10 Major 7 d/yr ≥104°F today · 15 d/yr by 30 yrs out
- Wind 6/10 Major 27% chance of damaging wind over 30 yrs
- Air quality 4/10 Moderate 5 unhealthy d/yr today · 6 by 30 yrs out
Nearby sold comps map
Loading sold comps map…
Walkable amenities ~0.75 mi
Loading nearby amenities…
Taxation est. · year 1
- Rental income
- $27,606
- − Mortgage interest
- −$11,478
- − Property taxes
- −$2,124
- − Insurance
- −$1,025
- − Repairs & maintenance
- −$2,208
- − Management
- −$2,208
- − Depreciation
- −$5,961
- Taxable income
- $2,601
- Est. tax owed @ 24.0%
- −$624
- After-tax cash flow
- $5,141/yr
For passive investors: Depreciation is non-cash, so a rental often shows a tax loss while cash-flowing — sheltering income. Rental losses are passive: they offset passive income freely, and up to $25,000/yr can offset ordinary (W-2) income if you actively participate and your MAGI is under $100k (phasing out to $0 by $150k); unused losses carry forward. On sale, claimed depreciation is recaptured at up to 25%, and gains may owe capital-gains tax (a 1031 exchange can defer both). Figures are a year-1 estimate at your 24.0% rate — not tax advice; consult a CPA.
Schools (NCES district)
- District
- Camden City School District
- NCES district ID
- 3402640
- Math proficiency
- 3% ▼ -6.00%
- Reading proficiency
- 16% ▬ 0.00%
- Median HH income
- $25,845
- Composite
- 6.85/100
- National rank
- #9981
- State rank
- #472 of 472 in NJ
Livability — Camden
- Score
- 70/100
- State rank
- #262
- US rank
- #7721
Category grades
Schools grade is shown separately in the Schools card above.
Census & demographics
- Census place
- Camden, NJ
- County
- Camden County · 407,624 people
- City population
- 20,865
- Metro
- Philadelphia-Camden-Wilmington, PA-NJ-DE-MD
- Population (ZIP)
- 8,292
- Household income
- $33,852
- Rent vs Own
- Severe rent burden
- 562.0
Population outlook (Camden County) Hauer SSP2
- Today (2025)
- 507,964 people
- By 2030
- 502,182 · -1.1%
- By 2040
- 485,602 · -4.4%
- By 2050
- 465,630 · -8.3%
- By 2075
- 419,986 · -17.3%
- By 2100
- 369,492 · -27.3%
Race, ethnicity, and origin ACS 2023
- Neighborhood character
- Majority Hispanic (64%)
- Race & ethnicity
- Hispanic / Latino 64% Black 20% Two or more races 14% White 13% Asian 1%
- Hispanic origin (detail)
- Mexican 3% Puerto Rican 40% Dominican 14%
- Common ancestry
- Romanian 2% Hispanic 1% Serbian 1%
- Foreign-born
- 13% · Canada
- Languages at home
- 48% English-only · Spanish 50%
Political lean MEDSL · Camden
- 2024 margin
- Strong D (+27.4) · D 63.0% · R 35.5% · Other 1.5%
- 2008→2024 swing
- -8.8pp toward R · 2008: 36.2pp · 2024: 27.4pp
- All cycles
- 2024: D+27.4 2020: D+33.5 2016: D+32.4 2012: D+36.6 2008: D+36.2
Not yet ingested
- Civics
- —
Market trends
- HPI YoY
- ▼ -8.61%
- Current HPI
- 192.0092
- Rent YoY
- —
- Metro
- Philadelphia-Camden-Wilmington, PA-NJ-DE-MD
- State GDP YoY
- ▲ 2.05%
- F500 in state
- 34
Industry mix (Fortune 500 HQ in NJ)
| Industry | F500 HQs | Revenue |
|---|---|---|
| Consumer Goods | 3 | $31B |
|
||
| Pharmaceuticals | 2 | $153B |
|
||
| Technology | 2 | $21B |
|
||
| Insurance | 2 | $20B |
|
||
| Healthcare | 2 | $19B |
|
||
| Financial Services | 1 | $70B |
|
||
Price history
+4125.0% since first listed21 events — show timeline
- 2026-05-09 Pending — BRIGHT MLS
- 2026-02-15 Listed $204,911 BRIGHT MLS
- 2026-01-06 Listing Removed — BRIGHT MLS
- 2025-10-07 Price Changed $204,911 BRIGHT MLS
- 2025-07-14 Relisted — BRIGHT MLS
- 2025-07-14 Listed $224,911 BRIGHT MLS
- 2025-07-14 Listing Removed — BRIGHT MLS
- 2024-06-17 Pending — BRIGHT MLS
- 2024-06-17 Sold (MLS) $41,500 BRIGHT MLS
- 2024-05-25 Contingent — BRIGHT MLS
- 2024-05-14 Listed $19,900 BRIGHT MLS
- 2008-09-05 Sold (Public Records) $90,000 Public Records
- 2008-08-29 Sold (MLS) $90,000 BRIGHT MLS
- 2008-07-29 Listing Removed — BRIGHT MLS
- 2007-08-04 Listed $89,911 BRIGHT MLS
- 2007-06-05 Sold (Public Records) $78,000 Public Records
- 2007-05-21 Sold (MLS) $15,600 BRIGHT MLS
- 2007-05-01 Listing Removed — BRIGHT MLS
- 2007-04-28 Listed $15,600 BRIGHT MLS
- 2006-04-27 Sold (Public Records) $25,000 Public Records
- 2002-11-08 Sold (Public Records) $4,850 Public Records
Property tax history
+3.0%/yrLatest (2025): $2,124 · +37.2% YoY. Source: county tax records.
Cash-flow waterfall
monthlySold comps — $/sqft
last 12 mo · ≤1 miLoading sold comps…