5327 W Lang Rd · Beaverton, MI
Flood risk 1/10 · Minimal
- FEMA flood zone
- X (unshaded)
- Chance of flooding over 30 yrs
- 0.0%
- Est. flood insurance / yr
- $473 – $860
Fire risk 4/10 · Minor
- Est. fire insurance / yr
- $784 – $1,456
Heat risk 2/10 · Minimal
- Hot days now (above 96°F)
- 7 days/yr
- Hot days in 30 yrs
- 14 days/yr
Wind risk 1/10 · Minimal
- Chance of severe wind over 30 yrs
- —
Air-quality risk 2/10 · Minimal
- Unhealthy air days now
- 1 days/yr
- Unhealthy air days in 30 yrs
- 1 days/yr
Risk factors via First Street. Map © Google.
Why this score? — see what drove the B- grade
The composite is a weighted blend of 9 inputs, each scored 0–100. Each bar is that input's sub-score; the figure is the points it added to the 100-point composite (weight × sub-score).
- Cash flow +30.0/30.0
- 1% rule +10.0/10.0
- DSCR +10.0/10.0
- ARV discount +7.5/15.0
- Livability +3.5/5.0
- Schools +2.6/10.0
- Rent growth +2.5/5.0
- Condition / age +2.5/5.0
- Appreciation +0.0/10.0
$30,000
🖨 Deal sheet 📄 Offer letter ✓ Due diligence
Listing remarks MLS
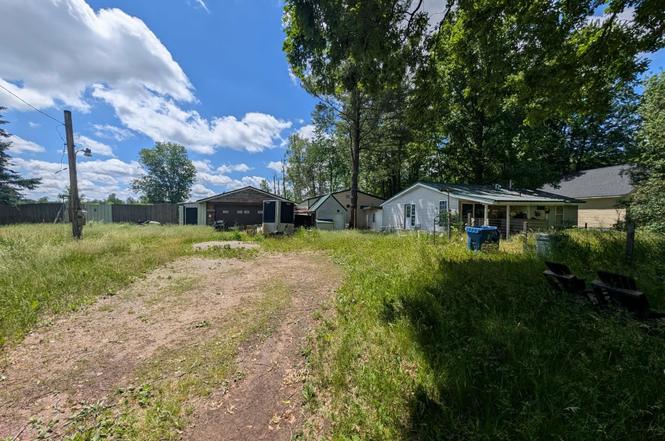
Bring your imagination and make this home your own. The garage is 24 X 40, and there is a separate outbuilding that is 30 X 40. Both have concrete and power (100KVA Transformer). Enjoy the big fenced-in backyard. Its nice country setting. The house could be fixed, but it is not financeable in its current state. There is a lot here for the money! See it today!
Key facts
- Separate outbuilding
- Concrete and power
- Fenced-in backyard
Tags
Property features AI
Finance
- Other: Zoned residential; Approximately 1 acre lot; No water features
Exterior
- Parking: Detached 2-car garage; Garage parking available
- Utilities: Private well water; Septic system; Electric/LP propane service (forced air heating)
- Home design: Single-story residential manufactured home (manufactured before 1976); Built in 1969; Crawlspace foundation
- Construction: Vinyl siding exterior; Crawl foundation; Manufactured home construction
- Exterior features: Vinyl siding; Porch; Second detached garage/outbuilding; Gravel road access
Interior
- Kitchen: Wood flooring; Kitchen on main level (11 x 15)
- Bedrooms: First-floor bedroom; Main-level bedroom (8 x 11) with vinyl flooring; Main-level bedroom (11 x 12)
- Flooring: Vinyl flooring in at least one bedroom; Wood flooring in kitchen
- Bathrooms: One full bathroom (main level)
- Heating & cooling: Forced air heating; LP/propane gas fuel
- Interior features: Porch
- Laundry & utility: Laundry room on main level
Neighborhood map
What this means for you Summary
Snapshot
- This is a 2-bed/1.0-bath single-family listed at $30k.
Deal economics
- At list price, monthly cash flow is $427 ($5k/yr) — positive.
- The deal already cash-flows at list — no discount required.
- Meets the 1% rule at list price ($855 rent vs $30k).
- Cap rate 23.4% vs local median 3.4% in Beaverton — top-decile yield for the area; either an underpriced asset or a hidden risk that comps aren't pricing in. Stress-test before assuming the spread holds.
Location & tenants
- Location reads 70/100 on livability (#323 in MI) — a middle-class / working-renter tenant base. Strengths: cost of living A+, health & safety A+, housing A-; Watch: schools D-, amenities F, commute F.
- Beaverton Rural Schools (rural): math 24% / reading 37% proficiency, ranked #364 of 540 in MI (top 67%) — families likely to look elsewhere, expect single-tenant / working-renter base with shorter leases.
- Market conditions: 103 active listings in the ZIP; 90 units permitted in Gladwin County in 2024 (0 in 5+ unit buildings).
Forward outlook
- Local home prices are declining (-3.0%/yr); year-one equity from $207 of loan paydown is wiped out by about $900 of value loss. Plan a longer hold.
- Gladwin County population projected at -25% by 2050 — secular population decline; favor cash flow + early exit over multi-decade hold.
- At projected returns (-3.0% appreciation + 3.0% rent growth), your $8k cash investment doubles in ~2 years — after that, you're playing with house money.
Negotiation context
- Only 2 days on market — expect competitive offers; lowballing is unlikely to land.
- 5 sale attempts since 9y ago with the ask held roughly flat each time — persistent listings suggest the price (not the market) is what's stuck; bring a comps-based counter.
- Current owner paid $15k; list at $30k implies a 100% gain — meaningful room to come down on a strong offer.
Risks & watch-outs
- Watch-outs: property tax is 3.2% of price.
Questions for the listing agent
- Built in 1969 — when were the roof, HVAC, electrical panel, plumbing, and water heater last replaced?
- Property tax is high relative to price — has the assessment been appealed recently, and will the sale trigger a re-assessment?
- Is there a deadline driving the sale (1031 exchange, divorce, estate, relocation)? That informs how much negotiation room exists.
- Schools are D-rated, which usually means shorter tenancies and higher turnover. Who's the typical renter profile here, and what's been the actual vacancy rate?
- What's the average days-on-market for RENTAL listings here right now (not sales)? A rising rental-DOM trend means longer vacancies and softer asking-rent achievability than the comps imply.
- What's the recent tenant-quality profile in this submarket — average credit score on applications, eviction rate, late-payment / NSF rate, and stable-employment percentage? A property-management company in the area should have these aggregated.
- How much new for-sale + rental construction is in the pipeline within 1–3 miles? Heavy new supply typically softens prices + rents 12–24 months out; constrained supply supports both.
Investment metrics
- 1% rule
- 2.85% ✓
- Cap rate
- 23.36%
- Cash-on-cash
- 60.94%
- DSCR
- 3.71
- GRM
- 2.9
CMA / ARV
No comps found within radius.
Projected returns pro-forma
-3.0% appreciation · 3.0% rent growth · sell at horizon
- IRR
- 59.8%
- Equity multiple
- 3.66×
- Total profit
- $22,346
- Equity at exit
- $4,473
- IRR
- 64.5%
- Equity multiple
- 7.50×
- Total profit
- $54,598
- Equity at exit
- $2,594
Cash invested: $8,400 (down + closing). Projections, not guarantees.
Landlord ↔ Tenant lean methodology
- Overall (STATE)
- 62 Landlord-Friendly
- State Michigan
- 62 Landlord-Friendly · EVEN
- County
- — inherits STATE
- City
- — inherits STATE
ZIP-level market 48612
- Home prices YoY
- -23.3%
- Active inventory
- 103
- Price-to-rent
- 2.9×
Monthly cashflow live
- Estimated rent
- $855 medium interval (Pro) →
- Mortgage (P&I)
- −$157
- Tax from tax record
- −$79 /mo · $946/yr
- Insurance
- −$12
- HOA
- −$0
- Vacancy / Maint / Mgmt
- −$179
- Net cashflow
- $427
Break-even live
Sensitivity live
| Price | -10% $444 | -5% $435 | +0% $427 | +5% $418 | +10% $410 |
|---|---|---|---|---|---|
| Rent | -10% $359 | -5% $393 | +0% $427 | +5% $460 | +10% $494 |
| Rate | -1.0pp $442 | -0.5pp $434 | base $427 | +0.5pp $419 | +1.0pp $411 |
UW: 25.0% down · 7.5% · 30yr · 1.5% tax · 5.0% vac · 8.0% maint · 8.0% mgmt
Financing live
Cash to close
- Down payment
- $7,500
- Closing costs
- $900
- Reserves months
- —
- Total cash needed
- —
Loan-product check · same deal, 3 products live
Conventional
25% down · 7.5% · 30yr
- Down + closing
- —
- Monthly P&I
- —
- Monthly cashflow
- —
- DSCR
- —
- Eligible?
- —
Personal DTI + credit; lowest rate.
DSCR
20% down · 8.5% · 30yr
- Down + closing
- —
- Monthly P&I
- —
- Monthly cashflow
- —
- DSCR
- —
- Eligible?
- —
No personal income docs; deal must DSCR.
Hard money
10% down · 12.0% · 12mo
- Down + closing
- —
- Monthly P&I
- —
- Monthly cashflow
- —
- DSCR
- —
- Eligible?
- —
Short-term bridge; refi at stabilization.
Listing history 4 events
-
2026-06-17status $30,000 Pending 2 DOM
-
2026-06-16days on market $30,000 Active 2 DOM
-
2026-06-15remarks 361-char remark
-
2026-06-15$30,000 Active 1 DOM
ⓘ Source: listings_history table (triggers on properties + properties_extension) + one-shot
backfill from property_details.listing_events for pre-trigger history.
Tax reassessment forecast MI · Partial reset (capped growth)
- Current annual tax
- $946 · $79/mo
- Projected year-2 tax
- $946 · $79/mo
- Expected delta
- $0/yr ($0/mo · 0.0%)
ⓘ Screening estimate from a state-policy table — verify with the county assessor before closing.
Climate risk First Street
- Flood 1/10 Low FEMA zone X (unshaded) · 0% chance over 30 yrs
- Wildfire 4/10 Moderate
- Heat 2/10 Low 7 d/yr ≥96°F today · 14 d/yr by 30 yrs out
- Wind 1/10 Low
- Air quality 2/10 Low 1 unhealthy d/yr today · 1 by 30 yrs out
Nearby sold comps map
Loading sold comps map…
Walkable amenities ~0.75 mi
Loading nearby amenities…
Taxation est. · year 1
- Rental income
- $10,257
- − Mortgage interest
- −$1,680
- − Property taxes
- −$946
- − Insurance
- −$150
- − Repairs & maintenance
- −$821
- − Management
- −$821
- − Depreciation
- −$873
- Taxable income
- $4,966
- Est. tax owed @ 24.0%
- −$1,192
- After-tax cash flow
- $3,927/yr
For passive investors: Depreciation is non-cash, so a rental often shows a tax loss while cash-flowing — sheltering income. Rental losses are passive: they offset passive income freely, and up to $25,000/yr can offset ordinary (W-2) income if you actively participate and your MAGI is under $100k (phasing out to $0 by $150k); unused losses carry forward. On sale, claimed depreciation is recaptured at up to 25%, and gains may owe capital-gains tax (a 1031 exchange can defer both). Figures are a year-1 estimate at your 24.0% rate — not tax advice; consult a CPA.
Schools (NCES district)
- District
- Beaverton Rural Schools
- NCES district ID
- 2604440
- Math proficiency
- 24% ▼ -2.00%
- Reading proficiency
- 37% ▼ -2.00%
- Median HH income
- $39,200
- Composite
- 25.54/100
- National rank
- #7431
- State rank
- #364 of 540 in MI
Livability — Beaverton
- Score
- 70/100
- State rank
- #323
- US rank
- #7931
Category grades
Schools grade is shown separately in the Schools card above.
Census & demographics
- Population (ZIP)
- 8,505
Population outlook (Gladwin County) Hauer SSP2
- Today (2025)
- 23,440 people
- By 2030
- 22,281 · -4.9%
- By 2040
- 19,867 · -15.2%
- By 2050
- 17,667 · -24.6%
- By 2075
- 12,909 · -44.9%
- By 2100
- 8,629 · -63.2%
Race, ethnicity, and origin ACS 2023
- Neighborhood character
- Predominantly White (92%)
- Race & ethnicity
- White 92% Two or more races 5% Hispanic / Latino 2%
- Common ancestry
- Lithuanian 5% Romanian 5% Slovak 2%
- Foreign-born
- 2% · Canada
- Languages at home
- 97% English-only · Spanish 2% German/W. Germanic 1%
Political lean MEDSL · Gladwin
- 2024 margin
- Solid R (+40.7) · D 29.1% · R 69.8% · Other 1.1%
- 2008→2024 swing
- -42.2pp toward R · 2008: 1.5pp · 2024: -40.7pp
- All cycles
- 2024: R+40.7 2020: R+36.8 2016: R+34.7 2012: R+7.2 2008: D+1.5
Not yet ingested
- Civics
- —
Market trends
- HPI YoY
- ▼ -65.55%
- Current HPI
- 215.4508
- Rent YoY
- —
- Metro
- —
- State GDP YoY
- ▲ 1.37%
- F500 in state
- 28
Industry mix (Fortune 500 HQ in MI)
| Industry | F500 HQs | Revenue |
|---|---|---|
| Automotive Parts | 3 | $48B |
|
||
| Automotive | 2 | $372B |
|
||
| Chemicals | 1 | $45B |
|
||
| Automotive Retail | 1 | $29B |
|
||
| Healthcare / Medical Devices | 1 | $23B |
|
||
| Automotive Technology | 1 | $20B |
|
||
Price history
+50.8% since first listed7 events — show timeline
- 2026-06-12 Listed $30,000 REALCOMP
- 2026-06-12 Listed $30,000 MiRealSource-MiMLS
- 2017-11-17 Sold (MLS) $15,000 MiRealSource-MiMLS
- 2017-11-17 Sold (MLS) $15,000 REALCOMP
- 2017-11-15 Listed $19,900 MiRealSource-MiMLS
- 2017-11-15 Listed $19,900 REALCOMP
- 2017-09-20 Listed $19,900 MiRealSource-MiMLS
Property tax history
+3.8%/yrLatest (2025): $946 · -40.3% YoY. Source: county tax records.
Cash-flow waterfall
monthlySold comps — $/sqft
last 12 mo · ≤1 miLoading sold comps…